
Manuscript accepted on :02-12-2019
Published online on: 28-12-2019
Plagiarism Check: Yes
Reviewed by: Dr.Chaitany Patel
Second Review by: R H Dahal
Final Approval by: Dr. Francesca Gorini
Fenty Alia1, Mas Rizky A. A Syamsunarno2,3, Vanessa Ayu Sumirat4,5, Mohammad Ghozali2 and Nur Atik
1Study Program of Magister of Anti Aging and Aesthetic Medicine, Faculty of Medicine, Universitas Padjadjaran, Indonesia, 45363
2Department of Biomedical Sciences, Faculty of Medicine, Universitas Padjadjaran, Indonesia, 45363
3Central Laboratory, Universitas Padjadjaran, Indonesia, 45363
4Study Program of Magister of Biotechnology, Postgraduate School, Universitas Padjadjaran, Indonesia, 40132
5Medical Laboratory Technologist, Bakti Asih School of Analyst, Bandung, Indonesia, 40192
Corresponding Author E-mail: n.atik@unpad.ac.id
DOI : https://dx.doi.org/10.13005/bpj/1849
Abstract
Characteristics of obesity as dysfunction of adipose tissue and chronic low-grade inflammation can have impacts to haematological parameters. The Moringa oleifera leaves have been used empirically to treat metabolic and blood-related diseases. However, it is still unknown whether Moringa oleifera leaves can influence haematological parameters in high fat diet. The study aimed to investigate the hematological parameter of high-fat diet mice in parallel with Moringa oleifera leaves ethanol extract (MOLE). Forty male DDY mice in 5 weeks of age were randomly divided into five groups as follows: The SD group was fed with a standard diet, the HFD group was fed with high fat diet, the HFD+S group was fed with high-fat diet and simvastatin (0,8 mg/20gBW/day). The HFD+MOLE1 and the HFD+MOLE2 groups were fed with high-fat diet and MOLE in a dose of 5,6 mg/20gBW/day and 11,2 mg/20gBW/day, respectively. The experiment was performed for 7 weeks. At the end of the experiment, blood was drawn for haematology analysis of blood parameters. We found that sub-chronic high fat diet might alter the haematological parameters. Two different doses of MOLE might have potencies to prevent the worsening caused by those alterations, by increased of haemoglobin [12,9(10,4-15,3) vs 13,9(12,9-18,2) and 14(10,2-14,8), p>0,05)], slight decreased of WBC [(3,59±1,974) vs (3,433±1,747) and (3,42±1,014), p>0,05]. Additionally, the MOLE might have an effect to decreasing the granulocyte percentage [18,5(9,2-43,6) vs 11,5(7,6-18,2) and 8,05(3,2-25,1), p>0,05], and slight decreased of MPV [4,2(2,6-6,7) vs 3,6(3,2-4,1) and 3,55(2,6-6,8), p>0,05]. In summary, the study showed that MOLE might have potencies to prevent the worsening of hematological parameters in the sub-chronic high fat diet.
Keywords
High fat diet; Haematological parameter; Moringa oleifera leaves ethanol extract.
Download this article as:| Copy the following to cite this article: Alia F,Syamsunarno M.R.A.A, Sumirat V A, Ghozali M, Atik N. The Haematological Profiles of High Fat Diet Mice Model with Moringa oleifera Leaves Ethanol Extract Treatment. Biomed Pharmacol J 2019;12(4). |
| Copy the following to cite this URL: Alia F,Syamsunarno M.R.A.A, Sumirat V A, Ghozali M, Atik N. The Haematological Profiles of High Fat Diet Mice Model with Moringa oleifera Leaves Ethanol Extract Treatment. Biomed Pharmacol J 2019;12(4). Available from: https://bit.ly/39dZ1VT |
Introduction
Obesity is known as an imbalance between energy intake and energy expenditure.1 The morphological hallmark of obesity is an increase in adipocyte mass and number, but the characteristics of obesity that need to be concerned are dysfunction of adipose tissue and chronic low-grade inflammation.2 These conditions have negative impacts, such as alteration in iron metabolism, immune system, and platelet activity and further can change the haematological parameter.
People with obesity have a higher risk to undergo iron deficiency anaemia compare to lean people.3 Anaemia is a decrease in the total amount of haemoglobin or the number of RBC. Iron deficiency anaemia is commonly known due to the lack of sufficient iron to form normal RBC, caused by inadequate intake of iron, chronic blood loss, or a combination of both.4 In overweight/obesity, iron deficiency anaemia can be caused by dilutional hypoferremia, inadequate dietary iron intake, increased iron requirements, and/or impaired iron absorption.3 The characteristic of obesity as a systemic low-grade inflammation makes iron deficiency is linked to inflammatory markers. Adipose-derived cytokines such as IL-6 and IL-1 act as potent inducers of hepcidin expression in adipose tissue.2 This elevation can decrease iron absorption and impair the effectiveness of iron fortification3,5
Adipose tissue is composed of mature adipocytes and stromal vascular fraction, including macrophages. Macrophages residing in adipose tissue are called adipose tissue macrophages (ATMs).6,7 In lean phenotype, ATMs display the anti-inflammatory macrophage (M2). In obesity, there is a phenotype switch in macrophage from M2 to M1, a classical pro-inflammatory macrophage.7,8 Many studies indicate that increased accumulation of ATMs is associated with obesity-related conditions such as type 2 diabetes, cardiovascular disease, and fatty liver.7 Obesity alters the lymphoid tissues, pro-inflammatory leucocyte distribution and population, and the amount of WBC, lymphocyte, neutrophil and monocyte.9,10 The WBC count will increase when the inflammation and leucocyte activation occurred.10
Moringa tree grows in Asia and Africa. It has 13 species, and the most often cultivated is Moringa oleifera (MO).11 Traditionally, people use all parts of the tree for medication, but the leaves are useful for treating malaria, typhoid fever, joint pain, skin disease and to enhance breast milk.12 The leaves are known rich of vitamin A, B1, B2, B3, carotenoid, polyphenol, phenolic acid, flavonoid, alkaloid, glucosinolates, isothiocyanates, tannin and saponin.11,12 The leave part is rich of minerals such as calcium, potassium, zinc, magnesium, iron and copper.13 It also contains iron 25 times higher than spinach.13 The vitamin C and carotenoid contents in the leave part can enhance iron absorption.14
Many studies were performed to explore MO leaves potencies for health conditions, such as hypercholesterolemia, hypertension, hyperglycaemia, type 2 diabetes, insulin resistance, non-alcoholic fatty liver disease, anticancer, and antiinflammation.11 Some studies have shown the effect of MO leave on blood profiles. In animals experiment, MO leave is more effective as supplementation for iron deficiency anaemia than synthetic supplementation.14 In anaemic rats, MO leaves ethanol extract (MOLE) could increase haemoglobin, RBC, haematocrit, and total iron concentration, and decrease WBC count.15,16A study involving women with iron deficiency anaemia showed that MOLE supplementation for three weeks increased haematocrit, Mean Corpuscular Haemoglobin (MCH), Mean Corpuscular Haemoglobin Concentration (MCHC), and decreased platelet concentration significantly as compared to the control group.17 Based on the background, this study aimed to investigate the haematological parameter of high fat diet mice in parallel with MOLE oral administration.
Material and Methods
Animals
Considering the Declaration of Helsinki for the welfare of animals used for research, the Research Ethics Committee Universitas Padjadjaran Bandung has approved the experimental animal protocol (Approval No. 107/UN6.KEP/EC/2019). Forty male DDY mice with 5 weeks of age were obtained from PT. Biofarma Bandung, Indonesia. Mice were acclimatized for 2 weeks in the Animal Laboratory Faculty of Medicine, Padjadjaran University, Bandung, Indonesia. Mice were placed in room controlled-temperature, 12 light and 12 dark cycle and had free access to diet and water.
Extract and Drug Preparation
MO leaf powder is produced by PT. Moringa Organik Indonesia, from fresh leaves. School of Life Sciences and Technology, Bandung Institute of Technology accomplished the identification of the plant. The leaves powder was extracted by maceration method with 95% ethanol. The ethanol extract was concentrated with freeze-dried, then kept in the refrigerator until used in the treatment. Two doses were selected from the previous study.18 Simvastatin was purchased from PT.Kimia Farma Pharmacy, Indonesia, with dose as previously described.18
Diet Preparation
Standard diet (SD) and high fat diet (HFD) were purchased from Animal Laboratory, Faculty of Pharmacy, Bandung Institute of Technology, Indonesia. SD contained 40,7% protein, 29,2% fat, and 30,1% carbohydrate. HFD contained 38,7% protein, 56,3% fat, and 5% carbohydrate.
High Fat Diet and MOLE Treatment
Mice were divided into 5 groups (n= 8 mice per group). The SD group: mice were given standard diet as negative control group; HFD group: high fat diet treatment; HFD+S group: high fat diet + simvastatin 0,8 mg/20gBW/day treatment as positive control group; HFD+MOLE1: high fat diet+MOLE 5,6 mg/20gBW/day treatment; and HFD+MOLE2 : high fat diet + MOLE 11,2 mg/20gBW/day treatment. Simvastatin and MOLE were given by intragastric tube every day. SD and HFD were given ad libitum and the treatment was performed for 7 weeks.
Sample Collection
At the end of experimental day, mice were fasted overnight. Mice were euthanized after anesthetized, blood samples were collected via cardiac puncture and drawn into EDTA tubes (Becton Dickinson, New Jersey, USA). The fresh blood in the EDTA tubes was then processed for haematology examination by used haematology analyser (The Samsung LABGEO HC10, Suwon, Korea) to measure 18 whole blood indices.
Statistical Analysis
All of the data were submitted to the Saphiro-Wilk test of normality. Values are shown as Mean ± SD for variables that met the criteria of normality, and non-parametric variables are shown as median (min-max) values. Statistical analysis was performed using Graphpad Prism 7.00 program (GraphPad Software, Inc. San Diego, CA)
Results and Discussion
Haematological analysis for RBC and related parameters
Red Blood Cells (RBC) and RBC-related parameters are presented in figure 1. The amount of RBC was tending to lower in the negative control group compared with the normal control group [5,805(4,12-9,07) vs 7,535(6,13-9,32)]. After treatment with MOLE dose 1, the amount of RBC was tend to increase as compared with the negative control group [8,265(5,57-11,61) vs 5,805 (4,12-9,07), p=0,6589].
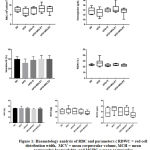 |
Figure 1: Haematology analysis of RBC and parameters ( RDWC = red cell distribution width, MCV = mean corpuscular volume, MCH = mean corpuscular haemoglobin, and MCHC = mean corpuscular haemoglobin concentration).
|
The examination of RBC-related parameters, such as the concentration of haemoglobin (HB), haematocrit (HCT), mean corpuscular volume (MCV), mean corpuscular haemoglobin (MCH), mean corpuscular haemoglobin concentration (MCHC) and red cell distribution width (RDWC), showed that there was no significant alteration found among groups in all RBC-related parameters.
In line with the RBC analysis, the concentration of HB and HCT were tended to decrease in the negative control group as compared with the normal group [12,9(10,4-12,3) and (31,58±8,686) vs 13,7(12-15,8) and (39,52±5,661)]. These situations might represent the character of obesity as a low grade inflammation that tends to come up with iron-deficiency anemia.3,5 Previous studies found that the presence of ascorbic acid and beta-carotene in MO leaves can enhance the absorption of non-heme iron, and amino acids in MO leaves can contribute to erythropoietin activity.19 In this study, MOLE could not significantly increase the concentration of haemoglobin. This could be explained by the presence of polyphenol, a bioactive compound that is known to have an inhibitory effect on iron bioavailability by chelating iron.19
The RDW value was tend to increase in negative control group as compared with normal group [26,5(19,6-39,5) vs 23(21,7-25,5), p>0,05]. RDW is sensitive for iron deficiency.20 In iron deficiency anemia, RDW value increases along with low MCV, showing microcytic heterogenous anemia form20. However there was no difference in MCV value between negative control group as compared with normal group [(52,25±7,498) vs (52,25±0,8864), p>0,05]. Treatment with MOLE showed that the RDW values were tend to decrease in two treatment groups as compared with negative control group [22,8(21,9-26,1) and 22,1(20,7-25) vs 26,5(19,6-39,5)], but did not show any improvement in MCV values [(49,75±3,24) and (51±3,891) vs (52,25±7,498)].
The haematology analysis of WBC and related parameters
The amount of WBCs was tend to increase in negative control group as compared with normal control group [(3,59±1,974) vs (2,419±0,8047), p=0,5471]. This increase of WBC in treatment groups could be due to the reaction in bone marrow because of inflammation.17 There were no significant differences among all groups (p=0,3856), indicating that MOLE did not affect the alteration of WBC count (Figure 2).
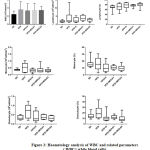 |
Figure 2: Haematology analysis of WBC and related parameters ( WBC= white blood cells).
|
We further performed haematology analysis on an absolute count of lymphocyte, monocyte, and granulocyte, and also lymphocyte, monocyte, and granulocyte percentage (Figure 2). The amount of lymphocyte was tend to decrease in negative control group as compared with all treatment groups [2,135(1,13-13,44) vs 3,6(1,61-6,18) and 2,98(0,92-3,84)], however treatment group 2 was tend to increase the lymphocyte percentage as compared with treatment group 1 [82,75(56,7-89,1) vs 77,55(63,8-81,7), p>0,9999].
Chronic overnutrition causes adipocytes to release chemokines, such as monocyte chemoattractant protein-1 (MCP-1), that attracts monocytes into adipose tissue, thus can transform into adipose tissue macrophage (ATM).7 Obesity also induces a shift in macrophage balance towards the M1 phenotype, which is the proinflammatory type that secreting cytokines such as TNFα, IL-1β, and IL-6, contributing to inflammation.7,8 In line with those situations, we found that the amount of monocyte was tend to increase in negative control group as compared with normal control group [0,55(0,14-1,02) vs 0,365(0,3-0,5), p>0,9999], however we noticed that by giving MOLE dose 1 and 2 was tend to lower monocyte count as compared with the negative control group [0,29(0,2-0,95) and 0,285(0,19-0,51) vs 0,55(0,14-1,02)]. The amount of granulocyte in negative control group was tend to increase as compared with normal control group [0,745(0,2-1,24) vs 0,315(0,21-0,52), p=9734]. A significant difference among groups was found in granulocyte percentage (p=0,0344), and we also noticed that the granulocyte percentage tended to decrease in treatment group 2 as compared with the negative control group [8,05(3,2-25,1) vs 18,5(9,2-43,6), p=0,1234]. The slight increase of monocyte and granulocyte in the negative control group showed that there was an acute inflammation occurred, and MOLE was tended to improve this condition.
The haematology analysis of platelet and related parameters
We further examined the platelet count, plateletcrit (PCT), mean platelet volume (MPV) and platelet distribution width (PDWC). There was no significant difference found among groups in all parameters (Figure 3). Although there was a rise of platelet count with a higher dose of MOLE, but it did not show any significant differences among groups (p=0,3856), indicating that MOLE did not affect the platelet count. It was similar to findings of Adepapo et al21. However, we found that the MPV value tended to increase in the negative control group as compared with the control group [4,2(2,6-6,7) vs 3,5(3,2-4,2), p>0,9999]. MPV is elevated in some conditions, such as hypercholesterolemia, diabetes mellitus and hypertension, that also life-threatening conditions for people with obesity.22 MOLE might improve these conditions since we noticed that MPV values in the treatment group 1 and 2 tended to decrease as compared with the negative control group [3,6(3,2-4,1) and 3,55(2,6-6,8) vs 4,2(2,6-6,7)].
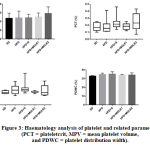 |
Figure 3: Haematology analysis of platelet and related parameters (PCT = plateletcrit, MPV = mean platelet volume, and PDWC = platelet distribution width).
|
Conclusion
In summary, the study showed that MOLE might have potencies to prevent the worsening of hematological parameters in the sub-chronic high fat diet by slight increased of haemoglobin, slight decreased of WBC, decreased the granulocyte percentage, and slight decreased of MPV.
Acknowledgement
We would like to thank to Neni Anggraeni, Suhendra Praptama and Asep Saepuloh for excellent assistance.
Conflict of Interest
All authors report no conflict of interest relevant to this article.
Funding Source
This research was supported by Research Grant from the Ministry of Research, Technology and Higher Education of the Republic of Indonesia.
References
- Tseng YH, Cypess AM, Kahn CR. Cellular bioenergetics as a target for obesity therapy. Nat Rev Drug Discov. 2010;9(6):465–82.
- Aigner E, Feldman A, Datz C. Obesity as an emerging risk factor for iron deficiency. Nutrients. 2014;6(9):3587–600.
- Cepeda-lopez AC, Aeberli I, Zimmermann MB. Does Obesity Increase Risk for Iron Deficiency? A Review of the Literature and the Potential Mechanisms. IntJ Vitam Nutr Res. 2010;80(4–5):263–70.
- Johnson Wimbley TD, Graham DY. Diagnosis and management of iron deficiency anemia in the 21st century. Therap Adv Gastroenterol. 2011;4(3):177–84.
- Ausk KJ, Ioannou GN. Is Obesity Associated With Anemia of Chronic Disease ? A Population-based Study. Obesity. 2008;16:2356–61.
- Heilbronn LK, Campbell L V. Adipose Tissue Macrophages , Low Grade Inflammation and Insulin Resistance in Human Obesity. Curr Pharm Des. 2008;14:1225–30.
- Patel PS, Buras ED, Balasubramanyam A. The Role of the Immune System in Obesity and Insulin Resistance. J Obes. 2013;2013.
- Exley MA, Hand L, Shea DO, Lynch L. Interplay between the immune system and adipose tissue in obesity. J Endocrinol. 2014;223(2):R41–8.
- Heredia FP De, Martínez SG, Marcos A. Obesity, Inflammation and The Immune System. Proc Nutr Soc. 2012;71(3):332–8.
- Andersen CJ, Murphy KE, Fernandez ML. Impact of Obesity and Metabolic Syndrome on Immunity. Adv Nutr. 2016;7:66–75.
- Vergara-Jimenez M, Almatrafi M, Fernandez M. Bioactive Components in Moringa Oleifera Leaves Protect against Chronic Disease. Antioxidants. 2017;6(4):91.
- Leone A, Spada A, Battezzati A, Schiraldi A, Aristil J, Bertoli S. Cultivation, genetic, ethnopharmacology, phytochemistry and pharmacology of Moringa oleifera leaves: An overview. Int J Mol Sci. 2015;16(6):12791–835.
- Gopalakrishnan L, Doriya K, Santhosh D. Moringa oleifera : A review on nutritive importance and its medicinal application. Food Sci Hum Wellness. 2016;5(2):49–56.
- Saini RK, Manoj P, Shetty NP, Srinivasan K, Giridhar P. Dietary iron supplements and Moringa oleifera leaves influence the liver hepcidin messenger RNA expression and biochemical indices of iron status in rats. Nutr Res. 2014;34(7):630–8.
- Mun’im A, Puteri MU, Sari SP. Anti-anemia Effect of Standardized Extract of Moringa Oleifera Lamk . Leaves on Aniline Induced Rats. Pharmacogn J. 2016;8(3):255–8.
- Ameh SS, Alafi OF. Effect of Ethanol Extract of Moringa Oleifera Leaves in Protecting Anaemia Induced in Rats by Aluminium Chloride. IOSR J Biotechnol Biochem. 2018;4(6):34–52.
- Suzana D, Suyatna FD, Andrajati R, Sari SP, Mun A. Effect of Moringa oleifera Leaves Extract Against Hematology and Blood Biochemical Value of Patients with Iron Deficiency Anemia. J Young Pharm. 2017;9(1):79–84.
- Bais S, Singh GS, Sharma R. Antiobesity and Hypolipidemic Activity of Moringa oleifera Leaves against High Fat Diet-Induced Obesity in Rats. Adv Biol. 2014;2014:1–9.
- Idohou-dossou N. Impact of Daily Consumption of Moringa (Moringa oleifera) Dry Leaf Powder on Iron Status of Senegalese Lactating Women. African J Food, Agric Dev. 2011;11(4):4985–99.
- Anuja S, Mahima S, Vandana S. Evaluation of Red Cell Distribution Width in the Diagnosis of Iron Deficiency Anemia. Int J Res Med Sci. 2016;4(8):3733–6.
- Adedapo AA, Mogbojuri OM, Emikpe BO. Safety evaluations of the aqueous extract of the leaves of Moringa oleifera in rats. J Med Plants Res. 2009;3(8):586–91.
- Jamshidi L, Seif A. Association Between Obesity , White Blood Cell and Platelet Count. Zahedan J Res Med Sci. 2017;19(2).

