
Manuscript accepted on :14-11-2019
Published online on: 07-12-2019
Plagiarism Check: Yes
Reviewed by: Mingxiao Ye
Second Review by: Jayendra Patel
Final Approval by: Prof. Dr. H.-J. Freisleben
Mohd Hafiz Mail1* , Nurhidayah Ab. Rahim3, Azimah Amanah1, Muhammad Hidhir Khawory1, Mohd Anuar Shahudin1 and Azman Seeni2
1Malaysian Institute of Pharmaceuticals and Nutraceuticals, National Institute of Biotechnology Malaysia, Ministry of Energy, Science, Technology, Environment and Climate Change, 11700 Penang, Malaysia
2Advanced Medical and Dental Institute, Universiti Sains Malaysia, Bertam, 13200 Pulau Pinang, Malaysia
3Fakulti Sains Kesihatan, Universiti Teknologi MARA, Cawangan Pulau Pinang, 13200 Pulau Pinang, Malaysia
Corresponding Author E-mail: mohdhafizmail@gmail.com
DOI : https://dx.doi.org/10.13005/bpj/1833
Abstract
Honey is at high risk for the adulteration in global trade. Studies on the authenticity of stingless bee honey from Trigona spp. is necessary since the market demand for this product is increasing, particularly in Malaysia, due to its high nutritional value. FTIR spectroscopy has recently been used approach for a rapid and non-destructive measurement of honey quality and discriminate adulterated honey. The purpose of this study is to determine the FTIR and elementary content of Trigona spp. and Apis spp. honey, and further investigate the influence of the additional adulterants to the measured spectra absorbance. Both Trigona spp. and Apis spp. honey exhibit almost identical IR spectra curves, but there are notable different of their absorbance peak at the identified functional group regions. There is a correlation of the measured absorbance to the actual composition of Trigona spp. honey, which emphasized the low carbohydrate but high water content of the honey. Water or vinegar diluted honey has segregated absorbance peak from the pure honey. Our finding indicated that the FTIR is applicable in discriminate of pure and adulterated Trigona honey, but a further investigation on physico-chemical properties such as elementary content is needed for a comprehensive analysis.
Keywords
Stingless bee; Trigona; Adulterated honey; Spectroscopy; FTIR
Download this article as:| Copy the following to cite this article: Mail M. H, Rahim N. A, Amanah A, Khawory M. H, Shahudin M. A, Seeni A. FTIR and Elementary Analysis of Trigona Honey, Apis Honey and Adulterated Honey Mixtures. Biomed Pharmacol J 2019;12(4). |
| Copy the following to cite this URL: Mail M. H, Rahim N. A, Amanah A, Khawory M. H, Shahudin M. A, Seeni A. FTIR and Elementary Analysis of Trigona Honey, Apis Honey and Adulterated Honey Mixtures. Biomed Pharmacol J 2019;12(4). Available from: https://bit.ly/33UYQuM |
Introduction
Honey is a natural product produced by bees from nectar. Major chemical constituents of honey are sugar and water, whereas minerals, vitamins, amino acids, organic acids, flavonoids and other phenolic compounds and aromatic substances are the minor components [1]. Its composition is particularly variable, depending on its geographical origins and bee species [2, 3]. Some bee species produced honey with distinct physical characteristic and chemical constituent. For instance, Apis spp., a large bee produces a sweet, viscous, dark brown color honey while Trigona spp., a small, stingless bee produces a sweet-sour, watery and light brown color honey. The amount of chemical constituent of the honey such as reducing sugars, sucrose, water content, minerals, diastase and hydroxymethylfurfural are also different between the two species [4].
Honey is much expensive than other type of food sweeteners but yet it still has high demand for its nutritional value [5], thus, it is at high risk for adulteration in global market [6]. Adulteration of honey is related to the addition of adulterant into pure honey. Most of Apis spp. honey is adulterated with cheaper, commercially-available sweeteners such as corn syrup and cane sugar syrup [7, 8]. Based on local apiarist report, adulteration of Trigona spp. honey involves with dilution of water to increase the yield volume of the honey. In some cases, other cheaper honey is mixed with sour-tasting liquid such vinegar to produce a sour taste, resemble to the Trigona spp. honey and sell at a higher price. This is deceitful and unfair to the consumer. Thus, laboratory investigation on the adulteration of Trigona spp. honey is proposed.
Optical spectroscopy technique has been recently used for a rapid and non-destructive measurement of food quality, chemical constituent and discriminate food origins [9-11]. This includes the use of fourier transform infrared spectroscopy (FTIR) technique in analysis of the quality of natural honey [12]. Other studies have reported that combination of FTIR with chemometric methods could provide a useful way to predict sugars and other chemical contents in honey [13, 14]. In addition, the FTIR is able to discriminate the pure and adulterated honey, that’s been added with food sweeteners or other adulterants [15, 16].
This paper presents the comparison of FTIR and elements of honey from Trigona spp. and Apis spp. Not even the pure honey, the FTIR analysis also was performed on the honey mixture which involve with the mixing of pure honey with other honey, vinegar or water. The analysis is focused on the absorbance peak shift of the infrared spectra that possibly response to the changes of the elementary composition in the honey mixture.
Materials and Methods
Honey Samples
The experiment was conducted on Trigona spp. and Apis spp., honey samples. Both honey was collected from apiarists and vendors in Malaysia. In addition, some of intentionally adulterated honey sample was produced in this study simulated to the actual adulteration process in real environment. The adulteration includes mixing of Apis with Trigona honey, Apis honey with white food acetic acid vinegar and Trigona honey with water. Each of the sample was mixed at the proportion of 10, 20 and 30% (Table 1) followed by vortex for 5 to 10 minutes to homogenize the mixture.
Table 1: List of honey sample and its adulterated mixture
| No. | Sample | Label | Volume of mixture | |
| 1. | Trigona honey | T1, T2, T3 | ||
| 2. | Apis honey | A1, A2, A3 | ||
| 3. | Apis honey + 10% Trigona honey | AT10 | 0.9 ml Apis honey | 0.1 ml Trigona honey |
| 4. | Apis honey + 20% Trigona honey | AT20 | 0.8 ml Apis honey | 0.2 ml Trigona honey |
| 5. | Apis honey + 30% Trigona honey | AT30 | 0.7 ml Apis honey | 0.3 ml Trigona honey |
| 6. | Apis honey + 10% vinegar | Av10 | 0.9 ml Apis honey | 0.1 ml vinegar |
| 7. | Apis honey + 20% vinegar | Av20 | 0.8 ml Apis honey | 0.2 ml vinegar |
| 8. | Apis honey + 30% vinegar | Av30 | 0.7 ml Apis honey | 0.3 ml vinegar |
| 9. | Trigona honey + 10% water | Tw10 | 0.9 ml Trigona honey | 0.1 ml water |
| 10. | Trigona honey + 20% water | Tw20 | 0.8 ml Trigona honey | 0.2 ml water |
| 11. | Trigona honey + 30% water | Tw30 | 0.7 ml Trigona honey | 0.3 ml water |
FTIR Measurements and Analysis
Prior measurement, all the samples were warmed up to 30°C to dissolve solid content and obtain an adequate viscosity. The infrared (IR) absorption was measured at constant volume of 20µl for each sample. The measurement was conducted using a Fourier transform infrared (FTIR) spectrometer, Perkin Elmer Spectrum Two with middle infrared (MIR) detector (Perkin Elmer, USA). The measurement was recorded in the wavenumber range between 4000-900 cm-1. The spectral resolution was 2 cm−1 and 64 scans were used. For all obtained spectra, baseline correction and normalization were applied using the FTIR Spectrum 10 software version 10.4.3. FTIR analysis was determined based on the detected absorbance peak, measured by the software.
Elementary CHNS analysis
Total element contents; carbon, hydrogen, nitrogen and sulfur (CHNS) in both Apis and Trigona honey were measured for the purpose of comparative analysis. The measurement was conducted using LECO CHNS TruSpec Micro elemental analyzer (LECO, USA). A total amount of 2.3mg of each sample was tested. Three burning steps were run sequentially within 5 seconds limit time and at low furnace flow for each step. Minimum analysis time was recorded in range 100-180 seconds. The CHNS content of both samples were measured independently.
Results and Discussion
Figure 1 presents the FTIR profile of Trigona and Apis honey in the region of 4000-900 cm-1. Both honey exhibit almost identical pattern of spectral curve. The curve represents the chemical constituent of natural honey. In general, the honey consist of five major functional group regions at specific wavenumber; (i) Carbohydrate, water and organic acids O-H stretching at maximum bandwidth of 3280-3271 cm-1, (ii) Carbohydrate and carboxylic acids C-H stretching at maximum bandwidth of 2935-2931 cm-1, (iii) Water O-H bending at maximum bandwidth of 1643-1642cm-1, (iv) Carbohydrate and organic acids O-H, C-H, -OH bending and C-H, C-O stretching at maximum bandwidth of 1416-1252 cm-1 and (v) Carbohydrates and organic acids C-O, C-C stretching at maximum bandwidth of 1031-1020 cm-1 [13, 17, 18].
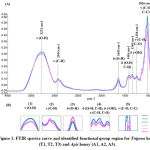 |
Figure 1: FTIR spectra curve and identified functional group region for Trigona honey (T1, T2, T3) and Apis honey (A1, A2, A3). |
The absorbance peak of the identified functional group for both honey is plotted in Table 2. It is clearly demonstrated Trigona honey has lower absorption at carbohydrate regions, but higher absorption at water (δ OH) region compared to Apis honey. This finding correlates with the natural chemical constituent of Trigona honey, consisting low carbohydrate but high water content [4]. In addition, CHNS analysis reveals the percentage of carbon (C) and hydrogen (H) element in Trigona honey (C=30.933±0.708, H=6.059±0.485) is lesser than Apis honey (C=33.333±0.599, H=6.485±0.245) as shown in Table 3. These C and H elements are highly associated to the composition of carbohydrate molecules in the form of reducing sugars, predominantly fructose and glucose in the honey [19].
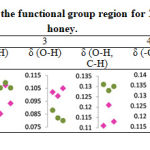 |
Table 2: Absorbance peak of the functional group region for Trigona (T) and Apis (A) honey. |
Table 3: CHNS percentage in Trigona and Apis honey samples. a,b has significant difference at p<0.01. Statistical analysis was performed using one tailed unpaired t-test.
| Sample | Mass mg | Carbon % | Hydrogen % | Nitrogen % | Sulfur % |
| T1 | 2.375 | 30.729 | 6.574 | -0.814 | -0.062 |
| T2 | 2.430 | 31.720 | 5.611 | -0.650 | -0.062 |
| T3 | 2.387 | 30.349 | 5.992 | -0.544 | -0.050 |
| 2.397 ± 0.029 | 30.933 ± 0.708a | 6.059 ± 0.485 | -0.669 ± 0.136 | -0.058 ± 0.007 | |
| A1 | 2.390 | 34.019 | 6.396 | -0.521 | -0.058 |
| A2 | 2.297 | 33.067 | 6.297 | -0.676 | -0.059 |
| A3 | 2.393 | 32.914 | 6.761 | -0.289 | 0.004 |
| 2.360 ± 0.055 | 33.333 ± 0.599b | 6.485 ± 0.245 | -0.495 ± 0.195 | -0.038 ± 0.036 |
Further FTIR measurement was performed on the honey mixtures and the IR curves as shown in Figure 2. These experiments were carried out based on the reported cases by local apiarists regarding on the adulteration of Trigona honey. First scenario, the cheaper Apis honey was mixed with small portion of Trigona honey to yield a replicate Trigona honey and sell at higher price. Thus, our first experiment involved mixing of Apis honey with 10-30% of Trigona honey. The absorbance peak of the functional group region for Apis–Trigona honey mixtures (AT) was plotted as shown in Table 4. There was a slight shift of the AT observance in most regions, except in region 1, which the absorbance closely shifted to the Trigona honey. Furthermore, the AT absorbance shifted away, above from Apis honey at region 2 and 5 with inconsistent trend. Chemical properties of Apis honey seem not much affected by the added Trigona honey and thus, caused slight changes to its IR characteristic.
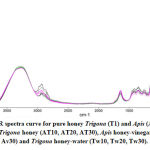 |
Figure 2: FTIR spectra curve for pure honey Trigona (T1) and Apis (A1) and honey mixture; Apis-Trigona honey (AT10, AT20, AT30), Apis honey-vinegar (Av10, Av20, Av30) and Trigona honey-water (Tw10, Tw20, Tw30). |
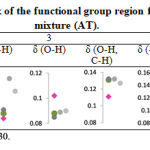 |
Table 4: Absorbance peak of the functional group region for Apis-Trigona honey mixture (AT). |
Second scenario, the cheaper Apis honey was mixed with vinegar to produce a sour taste that resemble to the Trigona honey and sell at a higher price. This experiment involved mixing of Apis honey with 10-30% of white acetic acid vinegar. The absorbance peak of the functional group region for Apis honey-vinegar mixture (Av) was plotted as shown in Table 5. Differ with AT, Av produced a drastic changes to the absorbance plot. The Av absorbance shifted towards Trigona honey at all regions. The absorbance shift was proportionate to the increment percentage of the vinegar in Av. The addition of vinegar even at low percentage changed the IR characteristic of Apis honey and this probably due to dilution of the honey content by huge amounts of water in the vinegar. The addition of 10% vinegar, Av10 showed the most identical absorbance pattern to Trigona honey. Further analysis on the Av10 was done using CNHS and the result showed that there was significant different in percentage of hydrogen (5.018%), nitrogen (0.130%) and sulfur (0.028%) but not to carbon (30.349%) when compared to Trigona honey. The reduction amount of hydrogen could possibly due to dilution effect and the increment of nitrogen and sulfur may correlated to the trace amount from other ingredients in the vinegar. CHNS can be used as supportive analysis for a better discrimination of pure honey and adulterated honey mixture.
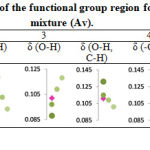 |
Table 5: Absorbance peak of the functional group region for Apis honey-vinegar mixture (Av). |
The third scenario where Trigona honey was diluted with water to increase yield volume of the honey to gain more profit. This experiment involved dilution of Trigona honey with 10-30% of water. The absorbance peak of the functional group region for Trigona honey-water mixture (Tw) was plotted as shown in Table 6. The Tw absorbance shifted away from Trigona honey at all regions with inconsistent trend except at region 1, which Tw has a constant absorbance value of 0.300. There was no absorbance observed at region 4 (δ O-H, C-H), probably due to very low detected amount of the component in the sample after dilution [20].
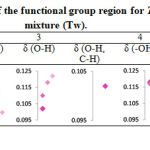 |
Table 6: Absorbance peak of the functional group region for Trigona honey-water mixture (Tw). |
Conclusions
Result from current study presents a distinct FTIR profile of Trigona spp. and Apis spp. honey. Even both honey exhibit almost identical pattern of spectral curve, there are notable differences observed from the absorbance peak and elementary analysis. The spectroscopic IR analysis shows the correlation of the measured absorbance to the actual composition of Trigona spp. honey, which emphasized the low carbohydrate but high water content of the honey. This study also highlights the changes in the spectral absorbance of the pure honey after addition of the adulterants, especially the changes influenced by the adulterant containing high water content such as white vinegar. The addition series concentration of water and vinegar causes the absorbance of the adulterated mixture shift away from the pure honey and making them segregated, identifiable from each other. FTIR is able to differentiate Trigona honey from its adulterated mixture. However, additional investigation on physico-chemical properties such as elementary content is suggested for a comprehensive analysis and better discrimination of pure honey and adulterated honey mixture.
Acknowledgments
This experiment was conducted in Malaysian Institute of Pharmaceuticals and Nutraceuticals, National Institute of Biotechnology Malaysia, Ministry of Energy, Science, Technology, Environment and Climate Change.
Conflict of Interest
The authors declare that they have no conflict of interest.
Funding Source
This research received no external funding.
References
- Santos-Buelga, C. and A.M. González-Paramás, Chemical Composition of Honey, in Bee Products – Chemical and Biological Properties, J.M. Alvarez-Suarez, Editor. 2017, Springer International Publishing: Cham. p. 43-82.
- Bogdanov, S., et al., Minerals in honey: environmental, geographical and botanical aspects. Journal of Apicultural Research, 2007. 46(4): p. 269-275.
- Kaškonienė, V. and P.R. Venskutonis, Floral Markers in Honey of Various Botanical and Geographic Origins: A Review. Comprehensive Reviews in Food Science and Food Safety, 2010. 9(6): p. 620-634.
- de Almeida-Muradian, L.B., Tetragonisca angustula Pot-Honey Compared to Apis mellifera Honey from Brazil, in Pot-Honey: A legacy of stingless bees, P. Vit, S.R.M. Pedro, and D. Roubik, Editors. 2013, Springer New York: New York, NY. p. 375-382.
- Ajibola, A., J.P. Chamunorwa, and K.H. Erlwanger, Nutraceutical values of natural honey and its contribution to human health and wealth. Nutrition & metabolism, 2012. 9: p. 61-61.
- Strayer, S.E., K. Everstine, and S. Kennedy, Economically motivated adulteration of honey: Quality control vulnerabilities in the international Money Market. Food Protection Trends, 2014. 34(1): p. 8-14.
- Nisbet, C., F. Kazak, and Y. Ardalı, Determination of Quality Criteria that Allow Differentiation Between Honey Adulterated with Sugar and Pure Honey. Biological Trace Element Research, 2018. 186(1): p. 288-293.
- Rios-Corripio, M.A., M. Rojas-López*, and R. Delgado-Macuil, Analysis of adulteration in honey with standard sugar solutions and syrups using attenuated total reflectance-Fourier transform infrared spectroscopy and multivariate methods. CyTA – Journal of Food, 2012. 10(2): p. 119-122.
- Omar, A.F., H. Atan, and M.Z. MatJafri, Peak Response Identification through Near-Infrared Spectroscopy Analysis on Aqueous Sucrose, Glucose, and Fructose Solution. 2012. 45(3): p. 190-201.
- Fairuz Omar, A., Spectroscopic profiling of soluble solids content and acidity of intact grape, lime, and star fruit. Sensor Review, 2013. 33(3): p. 238-245.
- Hong, X.-Z., et al., Tracing Geographical Origins of Teas Based on FT-NIR Spectroscopy: Introduction of Model Updating and Imbalanced Data Handling Approaches. Journal of Analytical Methods in Chemistry, 2019. 2019: p. 8.
- Kasprzyk, I., et al., FTIR-ATR spectroscopy of pollen and honey as a tool for unifloral honey authentication. The case study of rape honey. Food Control, 2018. 84: p. 33-40.
- Anguebes, F., et al., Application of Multivariable Analysis and FTIR-ATR Spectroscopy to the Prediction of Properties in Campeche Honey. Journal of Analytical Methods in Chemistry, 2016. 2016: p. 14.
- Anjos, O., et al., Application of FTIR-ATR spectroscopy to the quantification of sugar in honey. Food Chem., 2015. 169:218-23.(doi): p. 10.1016/j.foodchem.2014.07.138. Epub 2014 Aug 10.
- Rios-Corripio, M.A., et al., FTIR characterization of Mexican honey and its adulteration with sugar syrups by using chemometric methods. Journal of Physics: Conference Series, 2011. 274: p. 012098.
- Omar, A.F., et al., The influence of additional water content towards the spectroscopy and physicochemical properties of genus Apis and stingless bee honey. SPIE Photonics Europe. Vol. 9899. 2016: SPIE.
- Svečnjak, L., et al., Application of infrared spectroscopy in honey analysis. Agriculturae Conspectus Scientificus, 2011. 76(3): p. 191-195.
- Gok, S., et al., Differentiation of Anatolian honey samples from different botanical origins by ATR-FTIR spectroscopy using multivariate analysis. Food Chemistry, 2015. 170: p. 234-240.
- Schellenberg, A., et al., Multielement stable isotope ratios (H, C, N, S) of honey from different European regions. Food Chemistry, 2010. 121(3): p. 770-777.
- Jin, M., F. Lu, and M.A. Belkin, High-sensitivity infrared vibrational nanospectroscopy in water. Light: Science &Amp; Applications, 2017. 6: p. e17096.

