
Manuscript accepted on :27-11-2019
Published online on: 30-12-2019
Plagiarism Check: Yes
Reviewed by: Hind shakir
Second Review by: Hanefi Özbek
Final Approval by: Dr. Ian James Martin
 and Fayez Althobaiti
1Laboratory Technology Department, Turabah University College, Taif University, Taif, Saudi Arabia
2Department of Biotechnlogy ,Faculty of science, Taif University, Taif, Saudi Arabia
Corresponding Author E-mail: adildh@hotmail.com
DOI : https://dx.doi.org/10.13005/bpj/1823
Abstract
This study investigated the prevention effect of Acacia gerrardii leaf extracts on genetic variation in male rats exposed to streptozotocin-induced diabetes. Male rats (n=70) were treated with A. gerrardii leaf extract using concentrations ranging from 100 to 500 mg/kg body weight/day for four weeks against streptozotocin-induced possibly genetic variation. Blood samples and pancreatic tissues were collected at the end of the experiment. Ten Inter-Simple Sequence Repeat primers and ten Start Codon Targeted Polymorphism primers were used to detect genetic variations between the different groups. The biochemical results indicated a reduction in serum glucose levels, especially at doses of 400 and 500 mg/kg body weight. Molecular analysis showed that Inter-Simple Sequence Repeat primers and SCoT detected 119 and 97 amplicons, with 0.43% and 0.55% polymorphic respectively. Based on the previous markers analyzed, cluster analysis revealed that genetic variation was high in the pancreatic tissues of streptozotocin-treated rats in the groups treated with 0 (C+) > 100 (T1) > 200 (T2) > 300 (T3) mg/kg body weight/day. However, low genetic variation was observed in the pancreatic tissues of streptozotocin-treated rats in the groups treated with 400 (T4) > 500 (T5) mg/kg body weight/day. These results indicate that the A. gerrardii leaf extracts are rich in antioxidants preventing genetic variation in the pancreatic tissues. Therefore, A. gerrardii leaf extracts could be recommended as good source of dietary antioxidant.
Keywords
Acacia gerrardii; Genetic diversity; ISSR and SCoT marker; Streptozotocin; Diabetes; Rats
Download this article as:| Copy the following to cite this article: Aldhahrani A and Althobaiti F. Acacia Gerrardii Leaf Extracts Inhibit Genetic Diversity Induced by Streptozotocin in Male Rats. Biomed Pharmacol J 2019;12(4). |
| Copy the following to cite this URL: Aldhahrani A and Althobaiti F. Acacia Gerrardii Leaf Extracts Inhibit Genetic Diversity Induced by Streptozotocin in Male Rats. Biomed Pharmacol J 2019;12(4). Available from: https://bit.ly/2QrMF3M |
Introduction
About 400 million people had Diabetes Mellitus (DM) worldwide in 2013 and this number will increase to almost 600 million by 20351. Most people with DM live in low or medium-income countries, where rapid changes in lifestyle have increased the prevalence of cancer, diabetes and heart diseases. These countries are expected to experience the greatest increase in diabetes in the next 20 years2.
Development of diabetes can be attributed to the combined effect of genetic and environmental factors3. The most effective method to investigate genetic variations in diabetes uses molecular markers, which in biotechnology and molecular biology contexts, identify specific sequences within a wider pool of unknown DNA. These markers can be used to detect sequence changes, such as insertion, duplication, inversion, deletion or nucleotide changes4, using either long or short sequences5.
Such markers include: Single-Nucleotide Polymorphism (SNP), Inter-Simple Sequence Repeat (ISSR) and Start Codon Targeted Polymorphism (SCoT)6. Of these, ISSRs are inexpensive and comparatively easy to use, so are well-suited to beginners or for use with organisms where genetic information is lacking7. The ISSRs refer to genomic regions that are bounded by microsatellite sequences. A single-primer PCR amplification of these regions yields multiple amplification products, enabling a dominant multi-locus marker system to identify genome variations in a range of organisms. Similarly, SCoT is relatively simple and new to the market. Dependent on the short-conserved genetic region, SCoT marker primers focus on the translation initiation codon, ATG, and its surrounding conserved regions8-9. In this procedure, single primers are formed from the above-mentioned region without knowing any genomic sequence information10. The SCoT markers are deemed to have more precision than either Random Amplified Polymorphic DNA (RAPD) or ISSR. Furthermore, Gorji et al11 have proposed that the reproducibility of SCoT markers are not solely dependent on annealing temperature or primer length. The primer has also demonstrated its value in the analysis of genetic variation among a group of plant species12.
The relationship between genetic variation, detected using different molecular marker assays, and genes responsible for morphological and physiological traits, has been identified using advanced bioinformatics analysis techniques13.
Different medicinal plants have clearly shown the presence of antidiabetic compounds14. Herbal drugs and medicinal plants may provide the best substitution to synthetic drugs as they are more affordable and have a long history of safe and effective use in both conventional and folk medicine14. Herbs are used as a drug source to treat diseases and ailments such as diarrhea, colds, flu, dysentery, malaria, wounds, sexually transmitted infections (STIs), as well as being used as an ethno-veterinary and colic medicine15.
Multiple classes of phytochemicals such as phenols, flavonoids, phytosterols, tannin, proanthocyanidin and terpenes, as well as many minerals have been recognized in the roots and leaves of Acacia species16.
Acacia gerrardii is a small tree belonging to the Fabaceae family. It is found in tropical and subtropical areas17 and is an essential component of hilly desert and wadi areas, due to its nitrogen fixation ability. It could therefore be considered a keystone species18. Because it is a good source of tannins and gums, A. gerrardii is considered one of the most essential tree species in Saudi Arabia19.
There is now published data about the relationship between medicinal herbs and decreased genetic variation in induced diabetic animal models. The present study was therefore conducted to determine genetic variation among diabetic rats treated with different concentrations of A. gerrardii leaf extracts using different marker systems.
Material and Methods
Plant materials
Gerrardii leaves were collected from the Taif region, south-east of Jeddah and Makkah, in the Kingdom of Saudi Arabia in April 2019 and were dried in shade for 4 days and stored. Prof. Dr. Yassin M. Al-Sodany (Botany Department, Faculty of Science, University of Kafr El-Sheikh, Kafr El-Sheikh, Egypt) identified the plant material.
Chemicals
Gentamicin grade, used for induction of chronic kidney disease (CKD) among rats was purchased from Sigma Chemical Co. (St. Louis, MO, USA). Kits for determining the parameters were purchased from Sigma-Aldrich Corp., MO, USA. Streptozotocin-induced diabetic rats were purchased from Upjohn Company, USA. The DNeasy Mini Kit, ISSR and SCoT primers were purchased from QIAGEN, Germany.
Methanol extraction from Acacia gerrardii leaves
The mill machine was used to obtain A. gerrardii leaf powder extracts, which was stored in amber bottles to prevent degradation. About 50ml methanol water (4:1 v/v) was used to dissolve 5g of the extract powder at room temperature, using an orbital shaker overnight. The methanol extract solution was filtered using centrifugation (5000rpm for 10min) and the supernatant was subjected to rotary evaporation at 40ºC for concentration. After the solvent evaporated, the remaining extract was dissolved in distilled water.
Animals
Seventy male albino rats were used in this experiment in laboratory animals, depending on the animal ethical approved by the committee of King Fahd Medical Research Center. These rats weighing 155-185g each, were acquired from the King Saud University College of Pharmacy and transported to the King Fahd Medical Research Center in Jeddah. Their basal diet which consisted of corn starch (65%), casein (15%, containing 12.6% protein), vitamin mixture (1%), salt mixture (4%), and cellulose (5%) was prepared according to AOAC20. Rats were kept separately in wired cages at 25 ± 2oC and under good healthy environmental conditions.
Experimental diabetes induction
Diabetes was induced in rats that had been fasted for 12 hours via a single intraperitoneal injection of STZ (50 mg/kg) dissolved in citrate buffer (0.01 M, pH 4.5), while a control group was injected with citrate buffer only. The threshold to be considered diabetic was a blood glucose level exceeding 250 mg/dl21 and these rats were added to the study 72h post-injection.
Experimental setup
All rats were fed on the basal diet for one-week at the start of the study for environmental acclimatization. They were then divided into two groups: Group 1 (n=10) was fed on the basal diet and labeled control-ve (C-). Group 2 (n=60) were induced with diabetes by injecting streptozotocin dissolved in citric acid (0.1M, pH 4.5) IP into the leg muscle (5mg /100g body weight) after fasting overnight22. The second main group was divided into six sub-groups (n=10 rats each) 48h after the injection and fed on different diets for four weeks as follows: Group (1): Negative control (C-), fed on basal diet. Group (2): Control positive (C+), fed on basal diet. Groups (3-7): Fed on basal diet, with 100, 200, 300, 400 and 500 mg/kg body weight/day of A. gerrardii leaf extract, taken orally. Blood samples of fasting rats from retro-orbital venous plexus were obtained under diethyl ether anesthesia. These blood samples were drawn at several intervals, collected in dry, clean centrifuge tubes and left to clot. For the purpose of glucose estimation, the blood serum was then separated from samples23. The clear sera was separated though centrifugation (3000 rpm for 15 min at 4°C), then stored at –20ºC. After scarifying ether-anesthetized rats, the pancreatic tissues were gathered for molecular biological assays.
DNA Extraction
Genomic DNA was obtained from the pancreas using the DNeasy Mini Kit (QIAGEN). DNA quality and quantity was determined through comparison with standard lambda DNA on 1% (w/v) agarose gel24.
Inter-Simple Sequence Repeat (ISSR) Technique
Ten ISSR primers, detailed in Table 1, were used in this study. Our PCR reaction and amplification method replicated that used by Attallah et al24. 10µl of the ISSR-PCR products were resolved using 1.5% agarose gel electrophoresis with ethidium bromide. A standard for DNA molecular weight was determined using a 100bp DNA marker (Fermentas), and the Gel Doc™ System (Bio-Rad) was used to visualize and photographically record the results.
Table 1: The primer name (PN) and primer sequence of ISSR and SCoT PCR primers.
| PN | PS |
| ISSR- 7 | 5′-GACGATAGATAGATAGATA-3′ |
| ISSR- 8 | 5′-AGACAGACAGACAGACGC-3′ |
| ISSR-10 | 5′-GACAGACAGACAGACAAT-3′ |
| ISSR-11 | 5′-ACACACACACACACACY*A-3′ |
| ISSR-12 | 5′-ACACACACACACACACYC-3′ |
| ISSR-13 | 5′-AGAGAGAGAGAGAGAGYT-3′ |
| ISSR-17 | 5′-TCTCTCTCTCTCTCTCA-3′ |
| ISSR-18 | 5′-HVHCACACACACACACAT-3′ |
| ISSR-19 | 5′-HVHTCCTCCTCCTCCTCC-3′ |
| ISSR-20 | 5′-HVHTGTGTGTGTGTGTGT-3′ |
| SCoT-1 | 5′-ACGACATGGCGACCACGC-3′ |
| SCoT-2 | 5′-ACCATGGCTACCACCGGC-3′ |
| SCoT-3 | 5′-ACGACATGGCGACCCACA-3′ |
| SCoT-4 | 5′-ACCATGGCTACCACCGCA-3′ |
| SCoT-5 | 5′-CAATGGCTACCACTAGCG-3′ |
| SCoT-6 | 5′-CAATGGCTACCACTACAG-3′ |
| SCoT-7 | 5′-ACAATGGCTACCACTGAC-3′ |
| SCoT-8 | 5′-CATGGCTACCACCGGCCC-3′ |
| SCoT-9 | 5′-ACAATGGCTACCACTGCC-3′ |
| SCoT-10 | 5′-ACAATGGCTACCACCAGC-3′ |
SCoT (Start Codon Targeted) Technique
The study used ten SCoT primers, detailed in Table 1. The PCR reaction and amplification program was performed as described by Ibrahim et al25. The amplification products were separated, visualized and photographed as mentioned in the ISSR assay.
Statistical Analysis
The statistical procedure of analysis of variance was applied. Means were compared using Duncan’s Multiple Range test (DMRT) at (P ≤ 0.05). This analysis was carried out using SAS26. A present (1) and absent (0) reading system was used in recording PCR fragments and the Dice’s similarity matrix coefficient was used to measure the genetic variation between control and treatment through the unweighted pair group method (UPGMA). The obtained data matrix was used to construct phylogenetic trees using Dendro UPGMA (genomes.urv.es/UPGMA).
Results and Discussion
Effect of A. gerrardii leaf extract on serum glucose levels
The effect of different concentrations of A. gerrardii leaf extracts on serum glucose levels in STZ-treated rats is summarized in Table 2. Rats treated with STZ showed significantly increased (P<0.01) levels of serum glucose at the onset and the end of the experiment. Supplementation of STZ-treated rats with 100 mg/kg body weight/day with A. gerrardii leaf extract did not significantly decrease the glucose levels compared with rats treated with STZ. The serum glucose levels started to decrease significantly in STZ treated-rats with the dose of 100 mg /kg body weight/day from A. gerrardii leaf extract. The glucose levels decreased to levels similar to the negative control at the highest dose (500 mg/kg body weight/day) of A. gerrardii leaf extract. Blood glucose levels in STZ-induced diabetic experimental rats increased significantly compared with the control group. Similar results have been reported by others27-29. STZ is diabetogenic agent with alkylating properties and is cytotoxic to mammalian pancreatic beta cells (β-cells)30. The consumption of STZ molecules results in the formation of superoxide radicals in β-cells and also β-cell destruction by necrosis by the of NO moiety from STZ31. Moreover, Asad et al29 reported that a significant decrease in blood glucose was observed in diabetic rats treated with Acacia nilotica leaf extract in comparison to diabetes controlled rats. It is evident from this investigation that the Acacia extract was effective in maintaining the blood glucose levels in STZ-induced diabetic rats.
Table 2: Effect of A. gerrardii leaf extract concentrations on serum glucose levels in STZ-treated rats.
| Treatment | Glucose level (mg/dl)
|
|
| Day 0* | Week 4 | |
| Control (C-) | 86.5 ± 10.3 | 84.2 ± 11.2 d |
| Control (C+) | 349.2 ± 18.5 | 341.6 ± 22.3 a |
| T1 | 332.8 ± 22.1 | 318.3 ± 10.5 a |
| T2 | 337.6 ± 20.8 | 254.6 ± 11.6b |
| T3 | 331.4± 17.5 | 158.2 ± 9.4 c |
| T4 | 336.5± 21.3 | 127.2 ± 8.2 cd |
| T5 | 330.9 ± 24.7 | 98.6 ± 7.6d |
Day 0*: blood sugar reached >250 mg/dl (2-3 days post-STZ treatment); Control (C-): Negative control (C-) fed on basal diet. Control (C+): Positive control treated with STZ and fed on basal diet. T1-T5: Male rats treated with STZ and fed on basal diet and orally injected with 100, 200, 300, 400 and 500 mg /kg/ day body weight from A. gerrardii leaves extract, respectively.
ISSR- and SCoT PCR Analysis
This study successfully used ISSR and SCoT to differentiate between five treated pancreatic tissues and its control by components of A. gerradii. The ability to detect polymorphic loci among the control and the treatments was compared between ISSR and SCoT assays. ISSR analysis found a total of 119 polymorphic and mono-morphic bands, using ten primers in n=7 groups, each with a distinct scorable fragment. The PCR products’ molecular weight ranged from 144bp to 2,307bp, where the number of observed and scorable fragments ranged from 9 to 16, with a mean of 11.9 bands per PCR primer (Fig.1). Out of 119 bands, 46 were polymorphic with an average of polymorphism of 38.7% across all treatments. The maximum number of polymorphic bands was 8 (ISSR-18) (Table 3).
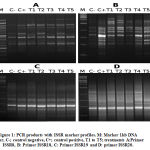 |
Figure 1: PCR products with ISSR marker profiles. M: Marker 1kb DNA ladder, C-; control negative, C+; control positive, T1 to T5; treatments A:Primer ISSR8, B: Primer ISSR18, C: Primer ISSR19 and D: primer ISSR20. |
ISSR-18 was the most polymorphic, with 8 bands. This was followed by ISSR-17 (7 bands), ISSR-7 (6 bands) and ISSR-10 (6 bands). Polymorphism resulting from ISSR primers spanned from 0% (ISSR-11, with no monomorphic band) to 55% (ISSR-8). The band frequency mean ranged from 0.5% (ISSR-7, which yielded high polymorphic bands) to 1% (ISSR-11, with 0% polymorphism efficiency). Full results are given in Table 3. Using the same primers, Hatti et al32 achieved the same results as our study. Following Ali33, we calculated polymorphism as the percentage of polymorphic bands from the total number of bands produced by each primer.
Table 3: ISSR primers used in this study.
| PN | NSB | NPB | %P | MBF |
| ISSR- 7 | 12 | 6 | 50.0% | 0.5 |
| ISSR- 8 | 9 | 5 | 55.6% | 0.8 |
| ISSR- 10 | 11 | 6 | 54.5% | 0.7 |
| ISSR- 11 | 9 | 0 | 0.0% | 1 |
| ISSR- 12 | 9 | 2 | 22.2% | 0.8 |
| ISSR- 13 | 14 | 5 | 35.7% | 0.9 |
| ISSR- 17 | 15 | 7 | 46.7% | 0.7 |
| ISSR- 18 | 16 | 8 | 50.0% | 0.8 |
| ISSR- 19 | 11 | 3 | 27.3% | 0.8 |
| ISSR- 20 | 13 | 4 | 30.8% | 0.9 |
| Total | 119 | 46 | 38.7% | |
| Average | 11.9 | 4.6 | 38.7% | 0.79 |
Primer Name (PN); primer sequence (PS); number of scored bands (NSB); number of polymorphic bands (NPB); mean band frequency (MBF).
Variable factors influence the number of bands amplified by different primers as the annealing sites in the genome and primer structure34-35.
This study found significant variation between differently-treated rat pancreatic tissues, in concordance with Raghunathachari et al 36, Saker et al37 and Abdulateef et al38. The present study obtained results using ISSR assay, indicating that (AC)8 repeats are more frequent in the A. gerrardii genome than in the TG repeats.
SCoT Polymorphism
39 PCR markers exhibited the total number of scored bands (97) and polymorphism. SCoT-7 and 9 primers had the highest number of bands (6 each) and the SCoT-4 primer did not reveal any polymorphic bands. Figure 2 illustrates some SCoT primer PCR patterns. Polymorphism averaged at 40.2%. SCoT-2 produced 0% polymorphism, while SCoT-7 produced the highest percentage (75%). The mean band frequency average across all primers was 0.71. Scot-7 and Scot-10 produced the highest value (0.90), while SCoT-3 produced the lowest value (0.50), illustrated in Table 4.
Table 4: Statistical analysis of SCoT primers used in this study and the amplification results.
| PN | NSB | NPB | %P | MBF |
| SCoT -1 | 8 | 4 | 50.00% | 0.7 |
| SCoT -2 | 16 | 4 | 25.00% | 0.5 |
| SCoT -3 | 10 | 1 | 10.00% | 0.4 |
| SCoT -4 | 12 | 0 | 0.00% | 0.7 |
| SCoT -5 | 8 | 5 | 62.50% | 0.8 |
| SCoT -6 | 6 | 3 | 50.00% | 0.8 |
| SCoT -7 | 8 | 6 | 75.00% | 0.9 |
| SCoT -8 | 9 | 5 | 55.56% | 0.8 |
| SCoT -9 | 13 | 6 | 46.15% | 0.6 |
| SCoT -10 | 7 | 5 | 71.43% | 0.9 |
| Total | 97 | 39 | 7.1 | |
| Average | 9.7 | 3.9 | 40.21% | 0.71 |
Of the 97 scored bands of PCR products, 39 were polymorphic, while 17 were unique, reflecting the findings of Gorji et al11 and Ibrahim et al25, in their SCoT assays in potato and grape respectively.
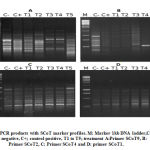 |
Figure 2: PCR products with SCoT marker profiles. M: Marker 1kb DNA ladder,C-; control negative, C+; control positive, T1 to T5; treatment A:Primer SCoT9, B: Primer SCoT2, C: Primer SCoT4 and D: primer SCoT1
|
Cluster analysis using PCR markers
The study used cluster analysis to estimate the differences between control and treatment polymorphism. This resulted from the banding patterns of ISSR and SCoT markers (Tables 3 and 4, and Figs. 3A and 3B).
![Figure 3: Dendrogram [(A) ISSR; (B) SCoT] illustrated genetic fingerprint and relationships between control and treatments.](https://biomedpharmajournal.org/wp-content/uploads/2019/12/Vol12No4_Aca_Adil_fig3-150x150.jpg) |
Figure 3: Dendrogram [(A) ISSR; (B) SCoT] illustrated genetic fingerprint and relationships between control and treatments.
|
A dendrogram, constructed using a distance matrix, using the UPGMA method, depending on genetic distances from ISSR marker analysis, showed that three major groups were observed. T1 was separated into a single group (group I), whereas T2 and T3 were placed in a second group (group II), with a similarity ranging from 0.82 to 0.91. T5 and T4 were separated into a third group, with a similarity range from 0.82 to 0.88.
The control (C and C+) and treatments could be divided into three groups. Group I consisted of C-, T4 and T5; Group II of T3 (which was similar to T2 and T1); and Group III contained only C+. These findings agreed with those of Xiong et al39, who concluded that the highly polymorphic nature of SCoT markers make them useful for genetic analysis of functional genetic variation and examining the relationships between different genotypes.
Conclusion
The molecular biological analysis revealed that genetic diversity was high in the pancreatic tissues of STZ-treated rats collected from the groups treated with 0 (C+) > 100 (T1) > 200 (T2) > 300 (T3) mg/kg body weight/day. However, low genetic variation was observed in the pancreatic tissues of STZ-treated rats collected from the groups treated with 400 (T4) > 500 (T5) mg/kg body weight/day. From this, we concluded that the A. gerrardii leaf extracts are rich in antioxidants, preventing genetic variation in pancreatic tissues. Therefore, A. gerrardii leaf extracts could be recommended as good source of dietary antioxidant.
Acknowledgment and Funding
The authors are deeply grateful to and acknowledge the Deanship of Scientific Research in Taif University, Saudi Arabia, for its financial support for Project (1-439-6076).
Competing interests
The authors declare that no conflicts of interest exist.
References
- Guariguata, L., Whiting, D.R., Hambleton, I., Beagley, J., Linnenkamp, U. and Shaw, J.E., Global estimates of diabetes prevalence for 2013 and projections for 2035. Diabetes research and clinical practice, 103(2), pp.137-149 (2014).
- Xu, Y., Wang, L., He, J., Bi, Y., Li, M., Wang, T., Wang, L., Jiang, Y., Dai, M., Lu, J. and Xu, M., Prevalence and control of diabetes in Chinese adults. JAMA, 310(9), pp.948-959 (2013).
- Rewers, M., and Ludvigsson, J., Environmental risk factors for type 1 diabetes. The Lancet, 387(10035), 2340-2348 (2016).
- White, T. L., Adams, W. T., and Neale, D. B., Genetic markers-morphological, biochemical and molecular markers. Book: Forest Genetics, 53-74 (2007).
- Fraser, M. P., Yue, Z. W., and Buzcu, B., Source apportionment of fine particulate matter in Houston, TX, using organic molecular markers. Atmospheric Environment, 37(15): 2117-2123 (2003).
- Kato N., Insights into the genetic basis of type 2 diabetes. J Diabetes Investig. 4: 233–44 (2013).
- Ng, W. L., and Tan, S. G., Inter-simple sequence repeat (ISSR) markers: are we doing it right. ASM Sci J, 9(1): 30-39 (2015).
- Sawant, S. V., Singh, P. K., Gupta, S. K., Madnala, R., and Tuli, R., Conserved nucleotide sequences in highly expressed genes in plants. Journal of Genetics.78 (2), 123-131 (1999).
- Collard, B. C., and Mackill, D. J., Start codon targeted (SCoT) polymorphism: a simple, novel DNA marker technique for generating gene-targeted markers in plants. Plant Molecular Biology Reporter. 27(1): 86 (2009).
- Zhang, Y., Yan, H., Jiang, X., Wang, X., Huang, L., Xu, B., and Zhang, L., Genetic variation, population structure and linkage disequilibrium in Switchgrass with ISSR, SCoT and EST-SSR markers. Hereditas, 153(1): 4 (2016).
- Gorji, A. M., Poczai, P., Polgar, Z., and Taller, J., Efficiency of arbitrarily amplified dominant markers (SCoT, ISSR and RAPD) for diagnostic fingerprinting in tetraploid potato. American Journal of Potato Research, 88(3): 226-237 (2011).
- Petrovičová, L., Balážová, Ž., Vivodík, M., and Gálová, Z., Detection genetic variability of Secale cereale L. by SCoT markers. Potravinárstvo: Slovak Journal of Food Sciences, 11(1): 197-202 (2017).
- Alsamman, A. M., Ibrahim, S. D., Hamwieh, A., KASPspoon: an in vitro and in silico PCR analysis tool for high-throughput SNP genotyping. Bioinformatics (2019).
- Khan, V., Najmi, A., Mohd, A., Mohd, A., Mohd, M., Pillai, K., A pharmacological appraisal of medicinal plants with antidiabetic potential. Journal of Pharmacy and Bioallied Sciences, 4(1), 27-42 (2012).
- Maroyi, A., Acacia karroo Hayne, Ethnomedicinal uses, phytochemistry and pharmacology of an important medicinal plant in southern Africa. Asian Pacific Journal of Tropical Medicine; 10(4): 351–360 (2017).
- Seigler, D. S., Phytochemistry of Acacia—sensu lato., Biochemical Systematics and Ecology, 31(8), 845-873 (2003).
- Abd_Allah, E. F., Alqarawi, A. A., Hashem, A., Wirth, S. and Egamberdieva, D., Regulatory roles of 24-epibrassinolide in tolerance of Acacia gerrardii Benth to salt stress. Bioengineered, 9(1), 61-71(2018).
- Suleiman, Majda K., K. Dixon, L. Commander, P. Nevill, N. R. Bhat, M. A. Islam, S. Jacob, and R. Thomas., Seed germinability and longevity influences regeneration of Acacia gerrardii . Plant Ecology, 1-19 (2018).
- Waly, N. M., and Emad, H. M., Taxonomical studies of some Acacia spp. growing in Saudi Arabia. Bulletin of Environment, Pharmacology and Life Sciences, 1(10), 55-62 (2012).
- , Official Methods of Analysis of the Association of Official Analytical Chemists, 18th ed., Washington, D.C (2005).
- Cam M., Yavuz O., Guven A., Ercan F., Bukan N., Ustundag N., Protective effects of chronic melatonin treatment against renal injury in streptozotocin-induced diabetic rats. J Pineal Res. 35: 212–20 (2003).
- Mader, Z., Effect of brown rice and soybean dietary fiber on the control, glucose and lipid metabolism in diabetic rats. M. J. Clin. Nutr., 38(3); 388-393 (1983).
- Giordano, B., Thrash, W., Hollenbaugh, L., Dube, W.P., Hodges, C., Swain, A., Banion, C.R. and Klingensmith, G.J., Performance of seven blood glucose testing systems at high altitude. The Diabetes Educator, 15(5), pp.444-448 (1989).
- Attallah, Ashraf & Abd-El-aal, Samir & Ibrahim, S.A. & El-Sayd, M.A., Improvement the efficiency of Sphingomonas paucimobilis to produce gellan gum by genetically approach. International Journal of ChemTech Research. 64-79 (2014).
- Ibrahim, S.D., Adawy, S.S., Atia, M.A.M Alsamman, A.M. and Mokhtar M.M. Genetic diversity, variety identification and gene detection in some Egyptian grape varieties by SSR and SCoT markers. POJ 9(5):311-318 (2016).
- , Statistical Analysis System. SAS User’s Statistics SAS Institute Inc. Editors, Cary, NC (2004).
- Wu Y., Ou-Yang J., Wu K., Wang Y., Zhou Y.F., Wen C.Y., Hypoglycemic effect of Astragalus polysaccharide and its effect on PTP1B1. Acta Pharmacologica Sinica. 26(3):345–352 (2005).
- Shankar P.K., Kumar V., Rao N., Evaluation of antidiabetic activity of Ginko Biloba in strep tozotocin induced diabetic rats. Iranian Journal of Pharmacology and Therapeutics. 4(1):16–19 (2005).
- Asad M, Aslam M, Munir TA, Nadeem A., Effect of Acacia nilotica leaves extract on hyperglycaemia, lipid profile and platelet aggregation in streptozotocin induced diabetic rats. J Ayub Med Coll Abbottabad. 23(2):3-7 (2011).
- Szkudelski T., The mechanism of alloxan and streptozotocin action in B cells of the rat pancreas. Physiological Research. 50(6):537–546 (2001).
- Sriram Prasath G, Subramanian S., Fisetin a bioflavonoid ameliorates hyperglycemia in STZ-induced experimental diabetes in rats. International Journal of Pharmaceutical Sciences Review and Research. 6(1):68–74 (2011).
- Hatti, A. D., Taware, S. D., Taware, A. S., Pangrikar, P. P., Chavan, A. M., and Mukadam, D. S., Genetic diversity of toxigenic and non-toxigenic Aspergillus flavus strains using ISSR markers. Int J Curr Res. 5: 61-66 (2010).
- Ali, B. A., Genetics similarity among four breeds of sheep in Egypt detected by random amplified polymorphic DNA markers. African Journal of Biotechnology, (2)7:194-197 (2003).
- Kernodle, S. P., Cannon, R. E., and Scandalios, J. G., Concentration of primer and template qualitatively affects product in RAPD-PCR. Biotechniques, (1): 362-364. (1993).
- Mayer, M.S.; Tullu, A.; Simon, C.J.; Kaiser, W.J. and Kraft, J.M., Developments of DNA markers for Fusarium wilt resistance in Chickpea. In: DNA markers and breeding for resistance to Ascochyta blight in Chickpea. “Proceeding of the symposium of” application of DNA fingerprinting for crop improvement: Marker-assisted selection of Chickpea for sustainable agriculture in the dry areas”. Upuda, S.M. and Weigand, F. (Eds.). ICARDA, Aleppo, Syria, pp:143-152 (2000).
- Raghunathachari, P., Khanna, V. K., Singh, U. S., Singh, N. K., RAPD analysis of genetic variability in Indian scented rice germplasm (Oryza sativa L.). Current Science, 79(7); 994-998 (2000).
- Saker, M. M., Youssef, S. S., Abdallah, N. A., Bashandy, H. S., and El Sharkawy, A. M., Genetic analysis of some Egyptian rice genotypes using RAPD, SSR and AFLP. African Journal of Biotechnology, 4(9):882-890 (2005).
- Abdulateef, S. M., Aljubori, M. H., and Abdulbaqi, N. J., Genetic Diversity Among Some Aspergillus flavus Isolates by Using Inter simple sequence repeats (ISSR). Iraqi Journal of Science. (55) 3:986-993 (2014).
- Xiong, F., Zhong, R., Han, Z., Jiang, J., He, L., Zhuang, W. and Tang, R., Start codon targeted polymorphism for evaluation of functional genetic variation and relationships in cultivated peanut (Arachishypogaea L.) genotypes. Molecular biology reports. 38(5), pp.3487-3494 (2011).

