
Manuscript accepted on :29 Aug 2019
Published online on: 21-09-2019
Plagiarism Check: Yes
Reviewed by: Arwa Rawashdeh
Second Review by: Amruta Dashputra
Final Approval by: Dr Pallav Sengupta
Inas R. El- Alameey1* , Hanaa H. Ahmed2, Mones M. Abushady3
1Child Health Department, Medical Research Division, National Research Centre, Egypt and Faculty of Applied Medical Sciences, Clinical Nutrition Department, Taibah University, Saudi Arabia
2Hormones Department, Medical Research Division, National Research Centre, Egypt
3Child Health Department, Medical Research Division, National Research Centre, Egypt
Corresponding Author’s Email: inasno@hotmail.com
DOI : https://dx.doi.org/10.13005/bpj/1760
Abstract
Brain derived neurotrophic factor (BDNF) is a neurotrophin probably concerned in the pathophysiology of obesity and metabolic syndrome (MS) in adults. The aim was to explore serum BDNF relationship with metabolic syndrome components before and after one-year of the lifestyle intervention program in obese children. Forty obese children and forty age and gender-matched lean controls were studied. Anthropometric parameters, blood pressure, fasting blood glucose, serum insulin, lipid profile, insulin resistance (HOMA-IR), and serum BDNF, before and after one year of diet control and physical activity were measured. At baseline, fasting glucose, insulin, HOMA-IR, cholesterol, LDL, triglycerides were significantly higher in obese children relative to controls (P=0.00). Serum BDNF concentration was significantly lower in obese children than in lean controls (P=0.00), and its mean concentration of the subjects with MS was significantly lower than those without MS, and control group (P< 0.001). Linear regression analysis suggested that high waist: hip ratio, body adiposity index, fat percentage, diastolic BP, fasting blood glucose, LDL and HOMA-IR are good predictors for decreased serum BDNF concentration in obese children. After one-year intervention program, the obese group showed a significant increase in serum BDNF, and HDL, paralleled by a significant decline in fasting glucose, insulin, HOMA-IR, cholesterol, LDL, triglycerides as compared to the baseline (P =0.00). Serum BDNF was lower in obese children than in lean controls, and seemed to be linked with the metabolic syndrome components. One-year lifestyle intervention program succeeded to enhance BDNF serum concentration in these children.
Keywords
Brain-Derived Neurotrophic Factor; Lifestyle Intervention Program; Metabolic Syndrome; Obese Children
Download this article as:| Copy the following to cite this article: El- Alameey I. R, Ahmed H. H, Abushady M. M. Role of Lifestyle Intervention Program in Regulating Brain Derived Neurotrophic Factor in Obese Children with Metabolic Syndrome Components. Biomed Pharmacol J 2019;12(3). |
| Copy the following to cite this URL: El- Alameey I. R, Ahmed H. H, Abushady M. M. Role of Lifestyle Intervention Program in Regulating Brain Derived Neurotrophic Factor in Obese Children with Metabolic Syndrome Components. Biomed Pharmacol J 2019;12(3). Available from: https://bit.ly/2m26IKy |
Introduction
Obesity in children is a common national health issue, as 70% of obese teenagers develop into obese adults,1 which is associated with a clustering of cardiovascular risk factors, like visceral obesity, impaired glucose tolerance, high blood pressure, and dyslipidemia, that are collectively recognized as metabolic syndrome (MS).2 The increasing worldwide prevalence of obesity in the young pointed to the significance of MS diagnosis in children as a status of high risk for progression to later diseases3-4 Metabolic syndrome constitutes 39.7% among obese Egyptian school students.5
The neurotrophin family including brain-derived neurotrophic factor (BDNF) are considered as key players in the control of growth, survival, and preservation of neurons.6 The brain is the main contributor to blood BDNF.7 BDNF and its receptor are expressed in the hypothalamus8-9 and peripheral tissues such as smooth and skeletal muscle, liver, pancreas and adipose tissue.10-11 Noteworthy BDNF is considered the main constituent of the hypothalamic axis which governs body weight and plays a relevant role in regulating energy homeostasis, glucose metabolism and eating behavior through the central nervous system.12
Many studies have observed low serum concentration of BDNF in children, obese adults and in subjects with metabolic syndrome (MS).13—15 Other studies showed that serum BDNF increases during exercise, and muscle-derived BDNF enhances fatty acid oxidation in skeletal muscle in adults.7, 12 However, Roth et al.,16 mentioned that serum BDNF concentration is higher in obese vs. normal weight children and no significant correlation between cardiovascular risk factors or insulin resistance and BDNF. To our knowledge, the association between serum BDNF concentration and metabolic syndrome in obese Egyptian children has not yet been investigated, and the alternations in serum BDNF concentration in obese children after lifestyle intervention are still unclear. Therefore, this study was tailored to evaluate serum BDNF concentration and to explore its relationship with metabolic syndrome components before and after one year of a lifestyle intervention program in obese Egyptian children.
Subjects and Methods
Design and Setting of the Study
This descriptive comparative case–control study was conducted on 80 children aged 10–15 years. They were selected from the Child Health Outpatients’ Clinic at the Center of Excellence, National Research Centre (NRC), Egypt.
Sample Size
The sample size was calculated to assess the risk factors probably affecting serum concentration of BDNF in obese children. The sample size was calculated by using Open Epi sample size calculator. The calculation based on a confidence interval of 95%, power 80%, ratio of control to cases is 1, and the least extreme Odds ratio to be detected is 2.
Subjects
The participants in this study were divided into two main groups; forty obese children in group I, and forty apparently healthy lean subjects matched for age, sex and social class as controls in group II. According to the criteria of MS, group Ι was further divided into two groups (group Ιa) consisted of twenty-two obese subjects who applies for the criteria of MS and (group Ιb) included eighty obese individuals without MS. Metabolic syndrome was defined as age modified criteria with abnormal values of at least three of the five criteria; systolic or diastolic blood pressure, waist circumference, fasting glucose, HDL, and triglycerides.17 Metabolic syndrome is taken into account in (1) children aged 6–10 years who are obese (defined as waist circumference (WC) ≥ 90th percentile) and have other relevant risk factors (such as family history of cardiometabolic disease) and in (2) children aged 10–16 years who are obese (defined as WC ≥ 90th percentile) and meet the adult metabolic syndrome criteria for triglycerides (TGs), HDL-cholesterol (HDL), blood pressure (BP), and glucose concentrations.
Criteria of Selection
Obese patients were selected according to the inclusion and exclusion criteria. Inclusion criteria included children with simple obesity based on body mass index (BMI), defined as the weight in kilograms divided by the square of the height in meters (kg/m2).18 The age of the study group was between 10-15 years old, and their BMI was above 30. Exclusion criteria involved children with endocrinal and genetic causes of obesity, chronic diseases, antihypertensive medications and those used that affect lipid profile or glucose level. None of the children had premature adrenarche or syndromic obesity.
Standard Protocol Approvals and Consents
This study was approved by the Research Ethics Committee of the NRC with the approval number of 18051. All studied subjects parents’ provided signed written consent form obtained from the Medical Ethical Committee of NRC to participate in this research work before the enrollment of the study.
Methods
All cases and controls were displayed to a full history taking from their parents with particular emphasis on family history of obesity, as well as medical problems such as high blood pressure and diabetes mellitus.
Nutritional Assessment
They were submitted to dietary history including the sort of food, eating, and physical activity behaviors. Dietary intake assessment was done for all participates. Three non-consecutive 24-hour recalls were recorded from the child’s parents, two referring to weekdays and one to the weekend. The information was recorded in household measures servings and thereafter it converted into grams.19
Clinical Examination and Assessment of Pubertal Development
Clinical examination and blood pressure measurements were done for all participates. Blood pressure was taken after the child rested for 15 minutes in a sitting position, with an appropriately sized manual blood pressure cuff according to the method described by Williams et al.,20 Blood pressure was taken 3 times with 5 minutes between each measurement. Lowest BP was recorded and evaluated using the percentiles of the International Task Force for BP21 Pubertal development was assessed by direct physical examination according to Tanner staging for boys and girls22-23
Anthropometric Measurements
All anthropometric measurements were performed, at baseline and one year after intervention by the same investigator, with the patient in light clothes and without shoes. The mean of the two determinations was used for all measurements. Anthropometric parameters included: weight (was measured using a calibrated digital scale to the nearest 0.01 kg), height (was measured to the nearest 0.1 cm using a calibrated stadiometer). The BMI for age z-scores were calculated based on data from the Centers for Disease Control and Prevention growth chart for age and gender. Waist circumference was measured to the nearest 0.1 cm at the umbilical level. Hip circumference was measured around the maximum extension of the buttocks; the reading was approximated to the nearest 0.1 cm. For both girls and boys, waist to hip ratio was calculated by dividing waist circumference by hip circumference. Of note, the waist: hip ratio over 0.96 for boys and 0.83 for girls is associated with an increased risk of developing diabetes and cardiovascular disease with obesity.24 Body composition was determined using body composition analyzer (Computerized Holtain Body Composition Analyzer, UK, and Crosswell No. 646512) displaying body fat percentage (%), fat mass (kg), and body adiposity index (%).
Intervention and Follow-up
Lifestyle modification with changes in dietary habits and physical activity is the primary intervention. After baseline analysis, a personalized balanced normocaloric diet adjusted by age using the nutrient density method.24 was given to the parents of obese cases. The diet contained 15% of energy intake from fat, 15% from protein and 55% from carbohydrate (5% from sugar). An adapted exercise program with thirty to forty-five minutes of moderate exercise three times per week was negotiated. Finally, children were advised to reduce sedentary behavior (particularly television and video games) to less than two hours a day. Visits were programmed every 3 months during the 1-year period. After one year of follow-up, the same clinical, anthropometric and metabolic evaluations were repeated in the obese children.
Laboratory Determinations
The participants in the case group were instructed not to consume any food or beverage, with the exception of water, after 10:00 pm, the night prior to blood collection at the baseline and after one year of the intervention program. The same instructions were given to the control counterparts prior to blood withdrawing. After an overnight fast, 5 ml venous blood samples were withdrawn from all participants and the separated sera were stored at −20°C. Fasting serum glucose and lipid profile were estimated by the colorimetric method using the Bio-diagnostic kit (Cairo, Egypt). Quantitative determination of serum BDNF concentration was performed using enzyme-linked immunosorbent assay ELISA kit obtained from Glory Bioscience, (USA) according to the manufacturer’s manual.
Serum insulin level was measured using an ELISA kit purchased from Glory Bioscience (USA) under the guidance of the manufacturer. The Homeostasis Model Assessment of insulin resistance (HOMA-IR) was calculated as follows: fasting insulin (µU/ml) ×fasting glucose (mg/dl)]/405.25 Children were considered insulin resistant if they had a HOMA-IR score ≥2.99.26
Statistical Analysis
All analyses were carried out using the Statistical Package for the Social Sciences (SPSS), version 23 computer program (SSPS Inc, Chicago, USA), and the results were expressed as Tables and Figures. Quantitative variables were presented as the mean ± SD. To compare anthropometric measures and serum BDNF concentration between groups, Student’s t-test was used. Categorical data were expressed as frequencies and percentages and analyzed with the two-tailed Chi-square test. Pearson’s correlation coefficient was used to assess the association between serum BDNF concentration, anthropometric measures, and laboratory variables. The analysis of variance (ANOVA) with the Turkey test was used to compare BDNF concentration between obese children group (with and without metabolic syndrome) and control group. A receiver operating characteristic (ROC) curve analysis was performed to estimate the cut off values of serum BDNF concentration with the highest sensitivity, specificity and area under the curve (AUC) for early detection of cardiovascular and metabolic risk among obese children. As the concentration of BDNF had a normal distribution, linear regression analysis was carried out to estimate the effect of different risk factors as age (years), anthropometric measures, lipid profiles, and fasting glucose, insulin and insulin resistance on serum BDNF concentration. P<0.05 was considered significant and P<0.001 was considered highly significant.
Results
Forty obese Egyptian children, 24 boys, and 16 girls were recruited in the study. Their ages of the participants are from 10 to 15 (13.35± 0.8; mean ±SD) years old. As expected, obese children have significantly higher BMI, BMI for age percentile and z-score compared to lean control counterparts (P<0.001). The mean waist, and hip circumferences, and the waist: hip ratios in the obese group are significantly greater than those in the lean control ones.
Body fat percentage (%), fat mass (kg), and body adiposity index (%) in the obese group are significantly higher than those in the lean control group, while muscle mass was significantly lower than that in the lean control children. The obese children have a higher systolic and diastolic blood pressure than the lean control group. Serum BDNF concentration at baseline is significantly lesser in the obese group than in the lean control group (𝑃< .001). The serum concentration of BDNF in the lean control and obese children are 8.08± 0.53 ng/ml, and 6.38± 0.76 ng/ml, respectively. The obese group also has lower HDL, and higher serum total cholesterol, triglycerides, LDL, insulin, and HOMA-IR values than the lean control group (𝑃<0.001). Serum glucose in the obese group shows no significant difference compared to the lean control group (Table 1).
Table 1: Comparison between obese group and control group as regard to age, anthropometric measures, blood pressure, and laboratory determinations.
| Variables | Obese group at baseline | Control group
|
t -test | P-value |
| Mean ± SD | Mean ± SD | |||
| Age (yrs) | 13.35±0.80 | 12.60±1.22 | 3.257 | 0.2 |
| BMI (kg/m2) | 35.69± 4.51 | 18.93± 2.06 | 21.359 | 0.000* |
| Waist(cm) | 108.7± 7.31 | 58.9± 4.73 | 36.129 | 0.000* |
| Hip (cm) | 122.7± 10.36 | 78.45± 4.93 | 24.375 | 0.000* |
| Waist: hip ratio | .888± 2.67 | .75± 1.92 | 26.520 | 0.000* |
| BMI for age percentile | 99.15±0.58 | 47.70±23.07 | 14.102 | 0.000* |
| BMI for age z- score | 2.37±0.29 | -0.42±0.71 | 22.927 | 0.000* |
| Body fat percentage (%) | 45.46±13.95 | 11.25±5.36 | 14.484 | 0.000* |
| Fat mass ( kg) | 38.47±11.82 | 5.07±3.28 | 17.219 | 0.000* |
| Muscle mass (kg) | 36.37±4.50 | 45.34±16.07 | 3.397 | 0.001* |
| Body adiposity index (%) | 45.75±7.42 | 25.28±1.04 | 17.285 | 0.000* |
| Systolic BP | 127±4.64 | 115±5.06 | 11.049 | 0.000* |
| Diastolic BP | 86±6.71 | 75±5.06 | 8.27 | 0.000* |
| Serum cholesterol (mg/dl) | 159.85±23 .89 | 128.9±6.05 | 8.17 | 0.000* |
| Serum triglycerides (mg/dl) | 85.4± 21.32 | 67.6± 14.67 | 4.34 | 0.000* |
| Serum HDL(mg/dl) | 43.9± 9.56 | 57.3± 4.12 | -8.132 | 0.000* |
| Serum LDL(mg/dl) | 81.7± 22.16 | 54.1± 8.83 | 7.317 | 0.000* |
| Serum glucose(mg/dl) | 86.5± 13.79 | 85.0± 4.68 | 0.651 | 0.517 |
| Serum insulin(mg/dl) | 29.07± 1.13 | 15.48± 0.96 | 13.25 | 0.000* |
| HOMA-IR | 6.56±1.13 | 3.48±0.96 | 13.161 | 0.000* |
| Serum BDNF (ng/ml) | 6.38± 0.76 | 8.08± 0.53 | -11.57 | 0.000* |
*Significant difference at P < 0.05, **highly significant difference at P≤ 0.01
In the obese children, after one-year lifestyle intervention program, the mean body weight, BMI, BMI-percentile and BMI for age z-score, waist, and hip circumferences, and the waist: hip ratio are significantly diminished versus prior intervention. Additionally, after one year of the intervention program, adiposity measures as body fat percentage (%), fat mass (kg), and body adiposity index (%) are significantly diminished in the obese children versus prior intervention. Moreover, systolic and diastolic blood pressures are significantly dropped in obese children after one-year of lifestyle intervention program relative to prior intervention. Serum BDNF concentration (Figure 1), and HDL are significantly up-regulated in the obese group with respect to prior intervention. The serum values of cholesterol, triglycerides, LDL, glucose, insulin, and HOMA-IR are significantly lowered relative to the baseline (Table 2).
Table 2: Comparison between obese children (before and after weight loss) as regard to anthropometric measures, blood pressure and laboratory determinations.
| Variables | Obese group before weight loss | Obese group after weight loss | Paired t-test | P-value |
| Mean ± SD | Mean ± SD | |||
| BMI for age percentile | 99.15±0.58 | 93.75±6.94 | 5.264 | 0.000* |
| BMI for age z-score | 2.37±0.29 | 1.44±0.70 | 7.472 | 0.000** |
| BMI | 36.16±4.89 | 28.25±4.36 | 23.356 | 0.000** |
| Body fat percentage (%) | 45.46±13.95 | 31.65±3.85 | 7.530 | 0.000** |
| Fat mass ( kg) | 38.47±11.82 | 23.39±5.74 | 10.782 | 0.000** |
| Muscle mass (kg) | 45.34±16.07 | 50.38±10.84 | -3.034 | 0.004** |
| Body adiposity index(%) | 45.75±7.42 | 37.22±6.26 | 17.283 | 0.000** |
| Systolic BP percentile | 95.3±3.172 | 80.250±7.217 | 11.951 | 0.000** |
| Diastolic BP percentile | 96.4±2.977 | 81.400±26.101 | 3.944 | 0.000** |
| Serum cholesterol(mg/dl) | 159.85±23 .89 | 152.75±17.31 | 4.983 | 0.000* |
| Serum triglycerides (mg/dl) | 85.4± 21.32 | 83.20±17.05 | 4.047 | 0.000* |
| Serum HDL (mg/dl) | 43.9± 9.56 | 45.40±7.64 | -3.047 | 0.004* |
| Serum LDL (mg/dl) | 81.7± 22.16 | 79.40±19.47 | 3.957 | 0.000* |
| Serum glucose (mg/dl) | 86.5± 13.79 | 83.10±9.22 | 4.525 | 0.000* |
| Serum insulin (mg/dl) | 29.07±4.31 | 24.27±3.65 | 7.6999 | 0.000* |
| HOMA-IR | 6.56±1.13 | 4.44±0.75 | 9.167 | 0.000* |
| Serum BDNF (ng/ml) | 6.30± 0.74 | 7.30±0.34 | -14.142 | 0.000* |
**Highly significant difference at P ≤ 0.01
In obese children at baseline, fasting blood glucose, serum BDNF concentration, and total serum cholesterol are inversely correlated with waist: hip ratio, however, not correlated with BMI, weight, and BMI for age percentile, and z- score. Meanwhile, serum triglycerides are positively correlated with BMI and BMI for age (percentile, and z- score). Serum LDL cholesterol is positively correlated with weight for age, and BMI for age percentile. Serum insulin level is inversely correlated with weight for age percentile, BMI, and BMI for age (percentile, and z-score). Homeostatic model assessment for insulin resistance (HOMA-IR) is inversely correlated with BMI z-score, and waist: hip ratio (Table 3).
Table 3: Correlation between serum BDNF concentration (at baseline) and anthropometric measures in the studied patients.
| Variables | BMI | BMI percentile | BMI z score | Waist: hip ratio | |
| Serum BDNF | Pearson Correlation | -.211 | -.301 | -.033 | -.442(*) |
| Sig. (2-tailed) | .192 | .059 | .839 | .004 | |
| Serum
cholesterol |
Pearson Correlation | .035 | .205 | .249 | -.463(**) |
| Sig. (2-tailed) | .832 | .205 | .122 | .004 | |
| Serum TGS | Pearson Correlation | .487(**) | .591(**) | .675(**) | -.072 |
| Sig. (2-tailed) | .001 | .000 | .000 | .657 | |
| Serum HDL | Pearson Correlation | -.167 | -.291 | -.113 | -.037 |
| Sig. (2-tailed) | .302 | .068 | .488 | .821 | |
| Serum LDL | Pearson Correlation | .093 | .341(*) | .201 | -.049 |
| Sig. (2-tailed) | .566 | .031 | .215 | .763 | |
| Serum glucose | Pearson Correlation | -.005 | .036 | -.049 | -.381(*) |
| Sig. (2-tailed) | .976 | .827 | .764 | .015 | |
| Serum insulin | Pearson Correlation | -.247 | -.388(*) | -.320(*) | -.049 |
| Sig. (2-tailed) | .125 | .013 | .044 | .763 | |
| Insulin resistance | Pearson Correlation | -.115 | -.093 | -.329(*) | -.664(**) |
| Sig. (2-tailed) | .482 | .569 | .038 | .000 | |
*Significant difference at P< 0.05, **highly significant difference at P≤ 0.01
In obese children at baseline, serum BDNF concentration is positively correlated with muscle mass and inversely correlated with body fat percentage, body adiposity index, and diastolic BP. Homoeostatic model assessment for insulin resistance (HOMA-IR) is positively correlated with body fat percentage, body adiposity index, fat mass and diastolic BP and inversely correlated with muscle mass. Fasting blood glucose is positively correlated with body adiposity index and SBP. Triglycerides in serum are positively correlated with SBP, and DBP, while HDL cholesterol in serum is negatively correlated with DBP (Table 4).
Table 4: Correlation between serum BDNF concentration and lipid profiles with body fat percentage, adiposity index, fat mass, muscle mass, and blood pressure in obese children at baseline.
| Variables | Body fat percentage | Fat mass | Muscle mass | Body adiposity index | Systolic BP percentile | Diastolic BP percentile | |
| Serum BDNF (ng/ml) | Pearson correlation | -.327(*) | -.228 | .326(*) | -.424(**) | -.040 | -.347(*) |
| Sig. (2-tailed) | .039 | .158 | .040 | .006 | .808 | .028 | |
| Serum cholesterol (mg/dl) | Pearson correlation | .278 | .200 | -.259 | .223 | -.234 | -.146 |
| Sig. (2-tailed) | .082 | .216 | .106 | .166 | .145 | .369 | |
| Serum TGS (mg/dl) | Pearson correlation | .051 | .305 | .068 | -.180 | .461(**) | .486(**) |
| Sig. (2-tailed) | .754 | .055 | .677 | .266 | .003 | .001 | |
| Serum HDL (mg/dl) | Pearson correlation | -.210 | -.181 | .232 | -.090 | .271 | -.654(**) |
| Sig. (2-tailed) | .193 | .264 | .149 | .580 | .090 | .000 | |
| Serum LDL (mg/dl) | Pearson correlation | .038 | .084 | .067 | .032 | .249 | -.159 |
| Sig. (2-tailed) | .816 | .608 | .680 | .842 | .121 | .327 | |
| Serum glucose (mg/dl) | Pearson correlation | .067 | -.018 | -.129 | .329(*) | .444(**) | -.078 |
| Sig. (2-tailed) | .682 | .915 | .429 | .038 | .004 | .633 | |
| Serum insulin (mg/dl) | Pearson correlation | .162 | .058 | -.263 | .186 | -.006 | .084 |
| Sig. (2-tailed) | .317 | .724 | .101 | .250 | .969 | .607 | |
| (HOMA-IR) | Pearson correlation | .563(**) | .379(*) | -.585(**) | .694(**) | -.255 | .350(*) |
| Sig. (2-tailed) | .000 | .016 | .000 | .000 | .112 | .027 | |
*Significant difference at P< 0.05, **highly significant difference at P≤ 0.01
In obese children at baseline, serum BDNF is positively correlated with HDL (r = 0.418, P < 0.005), and inversely correlated with serum LDL (r = -0.436, P < 0.001), fasting serum glucose (r = – 0.765, P < 0.001), and HOMA-IR (r = -0.688, P < 0.01) (Table 5).
Table 5: Correlation between serum BDNF concentration at baseline and other laboratory variables in the obese group.
| Variables | Serum cholesterol | Serum triglycerides | Serum HDL | Serum LDL | Fasting glucose | Fasting insulin | HOMA-IR | |
| Serum BDNF concentration (ng/ml) | Pearson correlation | -.144 | -.177 | .418(**) | -.436(**) | -.765(**) | -.066 | -0.688(**) |
| Sig. (2-tailed) | .376 | .276 | .008 | .005 | .000 | .685 | 0.000 | |
**Highly significant difference at P≤ 0.01
The linear regression analysis of the data for the obese children at baseline demonstrates that high waist: hip ratio, body adiposity index, and fat percentage, diastolic BP, serum fasting blood glucose, LDL and HOMA-IR are good predictors for low serum BDNF concentration in obese children (Table 6).
Table 6: Linear regression analysis for the predictors of serum BDNF concentration in obese children.
| Variables | Unstandardized Coefficients | Standardized Coefficients | t | Sig. | 95% Confidence Interval | ||
| B | Std. Error | Beta | Lower Bound | Upper Bound | |||
| (Constant) | -11.797 | .239 | -49.434 | .000** | -12.284 | -11.311 | |
| Waist :hip ratio | -21.499 | .277 | -.791 | 77.607 | .000** | -20.934 | -22.064 |
| Body fat percentage | -2.376E-03 | .001 | -.045 | -4.750 | .000** | -.003 | -.001 |
| Body adiposity index | -1.749E-02 | .001 | -.177 | -15.301 | .000** | -.020 | -.015 |
| Diastolic BP | -4.717E-02 | .001 | -.431 | -43.952 | .000** | -.049 | -.045 |
| Serum HDL | 6.376E-02 | .000 | .862 | 141.542 | .000** | .063 | .065 |
| Serum LDL | -7.463E-03 | .000 | -.227 | 32.535 | .000** | -.007 | -.008 |
| Blood glucose | -2.776E-02 | .001 | -.521 | -41.546 | .000** | -.029 | -.026 |
| Insulin resistance | -.462 | .003 | -.709 | 158.891 | .000** | -.456 | -.468 |
**Highly significant difference at P≤ 0.01
In the current approach, only 22 of obese children are diagnosed with MS. The serum BDNF concentration of the obese group with MS is statistically significantly lower than that in the obese ones without MS, and lean control groups (6.04±0.73 ng/ml vs. 6.62±0.62 ng/ml vs8.08± 0.53 ng/ml; P < 0.001) (Table 7).
Table 7: Comparison between obese children group with and without metabolic syndrome (MS) and control group as (ANOVA).
| Variables | Control group
|
Obese children with MS (group Ia) | Obese children without MS (group Ib) | F | P-value |
| Mean ± SD | Mean ± SD | Mean ± SD | |||
| BMI for age percentile | 47.70a±23.07 | 99.27b±0.46 | 99.00c±0.69 | 98.161 | 0.000**ab,ac |
| Body fat percentage (%) | 11.25a±5.36 | 52.38b±11.37 | 37.00c±12.19 | 155.873 | 0.000** ab,ac,bc |
| Fat mass ( kg) | 5.07a±3.28 | 42.74b±11.00 | 33.24c±10.88 | 179.488 | 0.000** ab,ac,bc |
| Adiposity index (%) | 25.28a±1.04 | 48.86b±5.18 | 41.93c±8.07 | 199.151 | 0.000** ab,ac,bc |
| Serum BDNF (ng/ml) | 8.08a±0.53 | 6.04b±0.73 | 6.62c±0.62 | 89.921 | 0.000** ab,ac,bc |
**Highly significant difference at P≤ 0.01
Evaluating the diagnostic performances of serum BDNF as a biomarker for obesity by calculating the area under the ROC curve is shown in Table (8) and Figure (3). This analysis demonstrates that serum BDNF may detect obesity with the AUC of 0.880 (95% confidence interval [CI] 0.809- 0.951, with a sensitivity of 80% and a specificity of 70% at a cutoff value of 7.70 ng/ml.
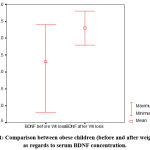 |
Figure 1: Comparison between obese children (before and after weight loss) as regards to serum BDNF concentration. |
Table 8: The area under the ROC curve and the cutoff value of serum BDNF concentration.
| Variable | AUC | 95% CI | P- value | Cutoff value (ng/ml) | Sensitivity | Specificity |
| Serum BDNF concentration | 0.880 | 0.809- 0.951 | 0.000** | 7.70 | 80% | 70% |
**Highly significant difference at P≤ 0.01
Discussion
Childhood obesity may a condition of excess body fat that often accompanied by the onset of cardiovascular disorders, insulin resistance, and diabetes throughout the lifecycle, and its prevalence is increasing at an alarming rate throughout the globe. Also, childhood obesity accounted for chronic inflammatory ailment.27
Brain-derived neurotrophic factor (BDNF) protects neurons from inflammatory events and plays a basic role in the central regulation of food intake and body weight.28 However, little is known about the function of BDNF in children with obesity. No kinds of literature have been published about the link between serum BDNF concentration and accumulation of visceral fat in obese subjects and the alterations in serum BDNF concentration in obese children have remained obscure.
This work was designed to evaluate the burden of obesity on serum BDNF concentration in children. This is a one year longitudinal study in Egypt evaluating the association between serum BDNF concentration and metabolic syndrome components in children with obesity before and after a lifestyle intervention program.
In our study, as expected, obese children showed a significant elevation in BMI, BMI (percentile, and z- score), waist, hip circumferences, and waist: hip ratio. They revealed also a significant enhancement in body fat percentage, fat mass, and body adiposity index paralleled with significant low muscle mass. These findings go hand in hand with those of Labyak et al.,29 and El-Alameey et al.,30
In the current research, the obese group experienced a significant decline in serum HDL- cholesterol, accompanied by a significant elevation in fasting serum cholesterol, triglycerides, LDL- cholesterol, insulin, and HOMA-IR values. These results come in line with those published by Pinhas-Hamiel et al.,31 Elsedfy et al.,32 and Jenny et al.,33
Decreased serum BDNF concentration is associated with hyperphagia and obesity.34 In the present study, obese children displayed a significant reduction in serum BDNF concentration at the baseline. Our results are in compliance with the findings of Araki et al.,36 a Japanese study on obese children with a mean age of 10.3 years. This study demonstrated that plasma BDNF concentrations are significantly lower in morbidly obese children than non-obese children. These data are also consistent with another study involving 27 prepubertal obese children done by El-Gharbawy et al.,14 who recorded lower BDNF circulating concentration in obese than normal weight children. In contrast to our study, Roth et al.,16 registered a significantly higher serum BDNF concentrations in obese vs. normal weight children. Our results are also inconsistent with the study of Jenny et al.,33 who observed that circulating concentrations of BDNF are significantly higher in the obese group compared to the lean group.
Up to our knowledge, no studies till now discuss the relation between serum BDNF concentration and body fat percentage, adiposity index, and fat mass in children. Despite BMI may be a good indicator for overweight. It is an indirect measure of fat mass. In the current study, serum BDNF concentration showed an inverse correlation with waist: hip ratio, body fat percentage, body adiposity index, but it revealed no correlation with weight, BMI for age and BMI for age percentile, and z-score. Our results converge with Corripio et al.,35 who stated that BDNF is not correlated with BMI in obese children. However, Araki et al.,36 recorded a significant inverse correlation between the plasma concentration of BDNF and BMI z-score among obese children. In adult females, a significant positive correlation has been discovered between body weight and the changes in plasma BDNF.37
Turchiano et al.,38 mentioned that BDNF is not correlated with systolic blood pressure (SBP) or diastolic blood pressure (DBP) in obese children. In the present research, serum BDNF concentration displayed an inverse correlation with diastolic blood pressure (DBP), but it exhibited no correlation with systolic blood pressure (SBP). Also, diastolic BP showed a positive correlation with serum insulin resistance, while SBP revealed a positive correlation with fasting blood glucose, and serum triglycerides levels.
In our study, serum BDNF concentration in obese children at baseline is positively correlated with HDL(r = 0.418, P < 0.005), and inversely correlated with serum LDL (r = -0.436, P < 0.001), fasting blood glucose (r = – 0.765, P < 0.001), and HOMA-IR (r = -0.688, P < 0.001). There is no available data till now discuss the relation between serum BDNF concentration, fasting blood glucose, insulin resistance, and lipid profile.
In the current approach, only 22 of obese children are diagnosed with MS. The serum BDNF concentration in the subjects with MS revealed significant reduction as compared to that in subjects without MS, and control group (6.04±0.73 ng/ml vs. 6.62±0.62 ng/ml vs. 8.08± 0.53 ng/ml; P < 0.001). Metabolic syndrome components are good predictors of low serum BDNF concentration in obese subjects. In obese children at baseline, linear regression analysis showed that high waist: hip ratio, body adiposity index, and fat percentage, diastolic BP, serum fasting blood glucose, LDL and HOMA-IR are good predictors to the decreased serum BDNF concentration in obese children. Our results disagree with those of Burns et al.,39 who reported that metabolic syndrome components are not good indicators for serum BDNF concentration in any of the calculated models, and serum BDNF concentrations at baseline do not correlate with any component of metabolic syndrome.
In this study, serum BDNF concentration at baseline showed a positive correlation with HDL, and an inverse correlation with serum fasting LDL, HOMA-IR, and glucose in obese children. These findings are congruent with Krabbe et al.,40 who detected low serum concentration of BDNF in obese subjects, and a negative correlation between fasting blood sugar (not insulin) and plasma BDNF. In distinction to our results, they noticed no significant correlation between serum BDNF concentration and insulin resistance.
In the current study, according to the receiver-operating characteristics (ROC) curve, high serum BDNF concentration is a good predictor for obesity with metabolic complications. The analysis demonstrated that serum BDNF may detect obesity metabolic complications at cut-off values of 7.70 ng/ml.
In this study, the homeostatic model assessment for insulin resistance (HOMA-IR) is inversely correlated with BMI z- score, and waist: hip ratio. These findings are in the agreement with Wahrenberg et al.,41
Weight loss due to exercise may cause a high serum concentration of BDNF. High BDNF may help in maintaining a reduced weight after intervention for obesity and may increase the oxidation of fat.42 In obese children, the unaltered serum BDNF after one year intervention may also propose BDNF resistance in these subjects.43
The strength of this study stems from that it is a longitudinal study designed to seek out a relationship between serum clinical investigations similarly biochemical parameters of obesity and BDNF concentrations in children joining a program for weight reduction program including dietary changes and exercise. After one-year lifestyle intervention program in the form of reduced caloric diet and three hours physical activity per week, the mean body weight, BMI, BMI for age (percentile and z-score), waist, and hip circumferences, and also the waist: hip ratios are significantly depressed in obese children versus prior intervention. Moreover, adiposity measures as body fat percentage (%), fat mass (kg), and body adiposity index (%) are significantly reduced in obese children after one year of intervention program relative to prior intervention.
The main findings in the current study showing that serum BDNF concentration, and HDL cholesterol levels are significantly elevated in obese children after the intervention. The fasting serum levels of cholesterol, triglycerides, LDL, glucose, insulin, and HOMA-IR were significantly decreased after the intervention. These data are in harmony with the previous study of Suwa et al.,42 who mentioned that BDNF concentration increases in obese prepubertal diabetic children who control nutritional intake, and their weight through sports. A study in adults reported by Araya et al.,44 showed a rise in serum BDNF concentration after 3-month of a reduced-calorie diet and also the weight loss, as well as reduced adiposity are associated with the reduction of cholesterol, triglycerides, LDL, insulin, and insulin resistance. Han et al.,34 found in obese children higher BDNF serum concentrations compared to lean ones.
Conclusively, BDNF displayed lower concentration in obese children as compared to the corresponding lean control children suggesting an association between fat mass and serum BDNF. These findings supported that BDNF represents a link between insulin resistance and obesity. Obese children in our study showed a high HOMA-IR index at baseline which revealed reduction after one year of the lifestyle intervention program. Also, the drop in the HOMA-IR index after the intervention is paralleled by the elevation of serum BDNF concentration in obese children. The outcomes of this study suggested that BDNF may play an important role in the pathogenesis of childhood obesity, and acts as a useful predictor for cardiovascular and metabolic risks in obese children. Therefore, quantifying BDNF concentration is considered as a useful tool in the early detection of obesity complications, and early treatment of childhood obesity.
Competing Interests
The authors have declared that no existence of competing interests.
References
- Zhao J, & Grant SF: Genetics of childhood obesity. J Obes. 2011; 2011:845148.10.1155/2011/845148 [PubMed: 21773009]
- Allcock DM, Gardner MJ, Sowers JR. Relation between childhood obesity and adult cardiovascular risk. Int J Pediatr Endocrinol. 2009:108187.10.1155/2009/108187 [PubMed: 19956748]
- Weiss R, Dziura J, Burgert TS, Tamborlane WV, Taksali SE, Yeckel CW, Allen K, Lopes M, Savoye M, Morrison J, Sherwin RS, Caprio S: Obesity and the metabolic syndrome in children and adolescents. N Engl J Med 2004, 350:2362-2374.
- Hannon TS, Rao G, Arslanian SA: Childhood obesity and type 2 diabetes mellitus. Pediatrics 2005, 116:473- 480.
- Hasssan NE, Elmasry SA, Fouad WA, Sherif L, Elwakkad A, Anwar M and Zaki ST: Prevalence of metabolic syndrome among obese egyptian school students. Pediatric Research 2011;70:378–378.
- Tapia-Arancibia L, Rage F, Givalois L, Arancibia S: Physiology of BDNF: focus on hypothalamic function. Front Neuroendocrinol 2004; 25:77—107.
- 7.Rasmussen P, Brassard P, Adser H, et al: Evidence for a release of brain-derived neurotrophic factor from the brain during exercise. Exp Physiol 2009; 94: 1062–9.
- Sartorius A, Hellweg R, Litzke JV, et al: Correlations and discrepancies between serum and brain tissue levels of neurotrophins after electroconvulsive treatment in rats. Pharmacopsychiatry 2009; 42:270–6.
- Klein AB, Williamson R, Santini MA, Clemmensen C, et al: Blood BDNF concentrations reflect brain-tissue BDNF levels across species. Int J Neuropsychopharmacol 2011; 14: 347–53.
- Noble EE, Billington CJ, Kotz CM, Wang C: The lighter side of BDNF. Am J Physiol Regul Integr Comp Physiol 2011; 300: 1053-069.
- Pedersen BK, Pedersen M, Krabbe KS, et al: Role of exercise induced brain-derived neurotrophic factor production in the regulation of energy homeostasis in mammals. Exp Physiol 2009; 94:1153–60.
- Cho HC, Kim J, Kim S, et al: The concentrations of serum, plasma and platelet BDNF are all increased by treadmill Vo (2max) performance in healthy college men. Neurosci Lett 2012;519:78–83.
- Hristova M, Aloe L: Metabolic syndrome- neurotrophic hypothesis. Med Hypotheses 2006; 66: 545—9.
- El-Gharbawy AH, Adler-Wailes DC, Mirch MC, Theim KR, Ranzenhofer L, Tanofsky-Kraff M, et al. Serum brain derived neurotrophic factor concentrations in lean and overweight children and adolescents. J Clin Endocrinol Metab 2006; 91:3548—52.
- Bullo M, Peeraully MR, Trayhurn P, Folch J, Salas-Salvado J. Circulating nerve growth factor levels in relation to obesity and the metabolic syndrome in women. Eur J Endocrinol 2007;157:303—10.
- Roth CL, Clinton Elfers, Ursel Gebhardt, Hermann L. Müller, Thomas Reinehr : Brain-derived neurotrophic factor and its relation to leptin in obese children before and after weight loss. Metabolism 2013; 62, (2): 226-234. https://doi.org/10.1016/j.metabol.2012.08.001
- Magge SN, Goodman E, Armstrong SC: Committee on nutrition, section on endocrinology, section on obesity. The Metabolic Syndrome in Children and Adolescents: Shifting the Focus to Cardiometabolic Risk Factor Clustering. Pediatrics. 2017; 140(2):e20171603
- Centers for Disease Control and Prevention. Weight, height, and BMI growth charts. Available from: http://www.cdc.gov/growthcharts/ (cited 18 January 2009).
- Willett W & Stampfer M: Total energy intake: implications for epidemiologic analyses. American Journal of Epidemiology (1986) 124, 17–27.
- Williams CL, Hayman LL, Daniels SR, et al: Cardiovascular health in childhood: a statement for health professionals from the Committee on Atherosclerosis, Hypertension, and Obesity in the Young (AHOY) of the Council on Cardiovascular Disease in the Young, American Heart Association. Circulation. 2002; 106:143–160. [PubMed: 12093785].
- McCrindle BW: Assessment and management of hypertension in children and adolescents. Nat Rev Cardiol. 2010; 7:155– 163
- Marshall W & Tanner J: Variations in pattern of pubertal changes in girls. Archives of Disease in Childhood ,1969; 44, 291–303.
- Marshall W & Tanner, J: Variations in the pattern of pubertal changes in boys. Archives of Disease in childhood, 1970; 45, 13–23.
- Panoulas VF, Ahmad N, Fazal AA, et al: The inter-operator variability in measuring waist circumference and its potential impact on the diagnosis of the metabolic syndrome. Postgrad Med J. 2008; 84 (993):344-7.
- Matthews D, Hosker J, Rudenski, A. et al: Homeostasis model assessment: insulin resistance and beta-cell function from fasting plasma glucose and insulin concentrations in man. Diabetologia (1985); 28, 412–419.
- Keskin M, Kurtoglu S, Kendirci M, Atabek ME, and Yazici C: Homeostasis model assessment is more reliable than the fasting glucose/insulin ratio and quantitative insulin sensitivity check index for assessing insulin resistance among obese children and adolescents, Pediatrics, 2005; 115, ( 4), 500–503.
- Vachharajani V& Granger DN :Adipose tissue: a motor for the inflammation associated with obesity, IUBMB Life, 2009; 61, ( 4), 424–430.
- Tabakman R, S. Lecht, S. Sephanova, H. Arien-Zakay, and P. Lazarovici, “Interactions between the cells of the immune and nervous system: neurotrophins as neuroprotection mediators in CNS injury, Progress in Brain Research, 2004; 146, 387–401.
- Labyak C A, David M. Janicke, Crystal S. Lim, James Colee, Anne E. Mathews: Anthropometrics to Identify Overweight Children at Most Risk for the Development of Cardiometabolic Disease. Infant Child Adolesc Nutr. December 2013 ; 5(6): 341–346. doi:10.1177/1941406413501379.
- Inas R. El-Alameey, Nevein N. Fadl, Enas R. Abdel Hameed, Lobna S. Sherif, Hanaa H. Ahmed: Clinical Relevance of Transforming Growth Factor-β1, Interleukin-6 and Haptoglobin for Prediction of Obesity Complications in Prepubertal Egyptian Children. Macedonian Journal of Medical Sciences. Mar. 2015 15; 3 (1): 105- 110.
- 31.Pinhas-Hamiel O, Lerner-Geva L, Copperman NM, Jacobson MS: Lipid and insulin levels in obese children: changes with age and puberty. Obesity (Silver Spring). Nov 2007;15(11):2825-31.
- 32.Elsedfy H, Amr N, Omar H, El Kholy M: Insulin resistance in obese pre-pubertal children: Relation to body composition. Egyptian Journal of Medical Human Genetics. July 2014, 15, (3), 249-255. https://doi.org/10.1016/j.ejmhg.2014.03.002
- Jenny Ha, Jessica I. Cohen, Aziz Tirsi, and Antonio Convit: Association of Obesity-Mediated Insulin Resistance and Hypothalamic Volumes: Possible Sex Differences. Hindawi Publishing Corporation Disease Markers. (2013), 35 (4) 249–259. http://dx.doi.org/10.1155/2013/531736
- Han JC, Liu QR, Jones M, et al: Brain-derived neurotrophic factor and obesity in the wager syndrome. N Engl J Med. 2008; 359: 918–27.
- Corripio R, Jose M, Jacobo P, Silvia N G , Joan V , Assumpta C: Plasma brain-derived neurotrophic factor in prepubertal obese children: results from a 2-year life style intervention programme. Clinical Endocrinology (2012) 77, 715–720
- Araki S, Yamamoto Y, Kazushige D, Kohtaro A, Koichi K: Decreased plasma levels of brain-derived neurotrophic factor and its relationship with obesity and birth weight in obese Japanese children. Obesity Research & Clinical Practice (2014) 8, 63—69.
- Pillai A, Bruno D, Sarreal AS, et al: Plasma BDNF levels vary in relation to body weight in females. PLoS One 2012;7 : e39358.
- Turchiano M, Sweat V, Fierman A, Convit A: Obesity, metabolic syndrome, and insulin resistance in urban high school students of minority race/ethnicity,” Archives of Pediatrics and Adolescent Medicine, 2012; 166, (11), 1030–1036.
- Burns B, Schmidt K., Williams SR et al: Haploinsufficiency causes reduced BDNF expression resulting in hyperphagia, obesity and altered fat distribution in mice and humans with no evidence of metabolic syndrome. Human Molecular Genetics. (2010), 19, 4026–4042.
- Krabbe KS, Nielsen AR, Krogh-Madsen R, et al: Brain-derived neurotrophic factor (BDNF) and type 2 diabetes. Diabetologia 2007; 50 :431–8.
- 41.Wahrenberg H, Hertel K, Leijonhufvud B, Persson L, Toft E, and Arner P: Use of waist circumference to predict insulin resistance: retrospective study, The British Medical Journal, 2005 330 (7504) 1363–1364.
- Tang SW, Chu E, Hui T, Helmeste D, Law C: Influence of exercise on serum brain-derived neurotrophic factor concentrations in healthy human subjects. Neurosci Lett 2008;431: 62–5.
- Suwa, M., Kishimoto, H., Nofuji, Y. et al: Serum brain derived neurotrophic factor level is increased and associated with obesity in newly diagnosed female patients with type 2 diabetes mellitus. Metabolism 2006; 55, 852–857.
- Araya AV, Orellana X, Espinoza J: Evaluation of the effect of caloric restriction on serum BDNF in overweight and obese subjects: preliminary evidences. Endocrine 2008; 33: 300–4.

