
Manuscript accepted on :18-June-2019
Published online on: 18-07-2019
Plagiarism Check: Yes
Reviewed by: Hendry Irawan
Second Review by: Vijay Rekulapally
Final Approval by: Prof. Juei-Tang Cheng
Nivedita Daimiwal and Revati Shriram
Cummins College of Engineering for Women, Pune, India.
Corresponding Author E-mail: nivedita.daimiwal@gmail.com
DOI : https://dx.doi.org/10.13005/bpj/1748
Abstract
Functional Magnetic Resonance Imaging (fMRI) is a non invasive modality to detect structure and function of the brain. Brain functions for various activities like motor, sensory, speech and memory process are detected using fMRI modality. This paper deals with the analysis of power spectrum of pixel time series for different motor activities. The analysis is to relate the power magnitude of the spike in the power spectrum of the fMRI time series with the activity performed. The fMRI data set consists of a sequence of images with respect to time, when the subject performs a definite task in a given block paradigm. The data set consists of four slices each of size 64×64 pixels. The power spectrum is acquired by taking the Fourier transform of the time series. The shape of the power spectrum is often referred to as 1/f or the inverse frequency function. Low frequency noise is removed by applying discrete cosine transform on time series. Data was originally, collected from General Electric Signa 1.5 T MRI system for 5 male subjects; 3 subjects: Performed lower limb movement (LL) and 2 subjects: Performed upper limb movement (UL). The power magnitude of the spike is recorded for lower limb and upper limb movement. The spike in the power spectrum at f Hz corresponds to the frequency at which the task is performed. The power magnitude amplitude for lower limb activity is around 14.31 dB and upper limb is around 4.0 dB. Power spectral density (PSD) of the time series is used for the detection of activities occurring in the brain.
Keywords
Discrete Cosine Transform; fMRI; Power Spectrum; Time Series
Download this article as:| Copy the following to cite this article: Daimiwal N, Shriram R. Power Spectral Density Analysis of Time Series of Pixel of Functional Magnetic Resonance Image for Different Motor Activity. Biomed Pharmacol J 2019;12(3). |
| Copy the following to cite this URL: Daimiwal N, Shriram R. Power Spectral Density Analysis of Time Series of Pixel of Functional Magnetic Resonance Image for Different Motor Activity. Biomed Pharmacol J 2019;12(3). Available from: https://bit.ly/2XPZCuC |
Introduction
Neurologists use fMRI, a powerful tool to study the function of the brain. fMRI is a diagnostic method used to study the working of a normal, diseased or injured brain. Risk after neuro surgery or invasive treatment is detected using fMRI. It is an important tool which maps the spatially distributed and temporally dynamic neural activity with high resolution in the space and time domains. The spatio temporal mapping of the brain activity is essential for the investigation of the brain, in terms of functional segregation and coordination.1 Normal anatomical imaging can provide structural information of the brain. In neurological disorders, the assessment of only structural information of the abnormalities present is not sufficient. In such cases, investigating the functional organization of the brain is required.2-8 The brain coordinates all the different body functions required to perform all life events dynamically. Bodily functions and areas of the brain responsible for particular functions like sensory, motor, speech and memory processes are investigated through fMRI studies. An important function of the brain is related to memory which processes and controls past and present information. Human memory processes are divided into three types: Encoding, retention and recalling. Brain regions activated during these memory processes could be investigated through fMRI studies.9-10 The fMRI technique is used to capture blood oxygenation level dependent (BOLD) contrast. The BOLD signal arises from the interplay of blood flow, blood volume and blood oxygenation in response to changes in neuronal activity. Under an active state the local concentration of oxygenated hemoglobin increases which increases homogeneity of magnetic susceptibility, resulting in an increase in T2* weighted MRI signal.11,12
The most obvious characteristic of noise in BOLD fMRI data is the presence of low frequency drift. This drift is observed in the time domain and fourier domain. The shape of the power spectrum is often referred to as the 1/f or inverse frequency function.13 The noise appears due to the subject movement or cardiac and respiratory effects will remain after motion correction.14 Since low frequency noise is always present in fMRI data, it is important that the frequency of the task does not fall in the range of (0- 0.015 Hz), where the low frequency noise is found.15 This low frequency noise is removed by using high pass filtering.
Materials and Method
fMRI Data was originally, collected from General Electric Signa 1.5 T MR system (New MRI Center, India). The subjects were made to perform lower limb and upper limb movements. While recording the data set, during ON state the subject was performed limb movements and no activity during OFF state. The period of the stimulus used is 20. The data set was in a DICOM (Digital Image Communication in Medicine) format.
In this fMRI experiment the data set consisted of a sequence of images recorded with respect to time. Echo planar images (EPI) were recorded while the subject is performed a paticular motor activity.16 The data set consists of four slices each of size 64×64 pixels, cutting through the motor cortex with a repetition time (TR) of 3000 msec echo time of 60 msec. EPI images belonging to slice 1, 2, 3, 4 in sequence that were recorded with respect to time are shown in figure 1.17,22 For each motor activity 512 images were recorded.
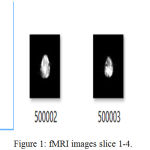 |
Figure 1: fMRI images slice 1-4.
|
Time Series
The single image does not give any functional information. In fact the variation of the image intensities are recorded with respect to time. In fMRI, a number of images of the brain are recorded consecutively with respect to time in a single fMRI experiment. Each of the pixels in the image is represented by coordinates (k1,k2). The pixel time series corresponds to pixel (k1,k2) by TS (k1,k2,l), where k1,k2 are integers, l being the time index. The noise arises from physical sources (sometimes referred to as scanner drift), from physiological sources, or from residual movement effects. When the subject is performing a task, signal components are added to this noise.17,18 Figure 2 shows the pixel time series.
The time series of fMRI is represented by
TS (k,l) = π (TS(k,l), PT) + ∑i (TS(k,l), Ppi ) + n(l) (1)
Where T is the stimulus period, π (TS(k,l), PT) is the projection of time series (TS) onto the T periodic basis elements and Ppi is the periodicity subspaces.
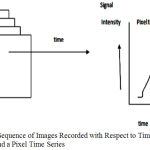 |
Figure 2: Sequence of Images Recorded with Respect to Time in fMRI and a Pixel Time Series.
|
Power Spectrum
The Fourier transform reflects the strength (or power) of the signal at each frequency. When the power is plotted across all frequencies, this plot is referred to as a power spectrum. Power spectra are commonly used in fMRI data analysis. They can be useful for characterizing the time course of signals that are estimated using independent components analysis. The power spectrum is acquired by taking the fourier transform of the time series. The X axis of the plot refers to different frequencies whereas the Y axis refers to the power or strength of this frequency. The most obvious characteristic of noise in BOLD fMRI data is the presence of low frequency drift. This low frequency drift in an fMRI time series can be observed in the time domain as well as in the power spectrum in the Fourier domain.19-20
High Pass Filtering
The noise components that arise due to previously mentioned sources namely physical physiological and residual movement effects as well as their interaction with the static magnetic field are low frquency noise components. When the subject is performing a task, signal components are added to this noise. Filters are used for removal of noise. The filters used in imaging are designed to pass particular portions (or bands) of the frequency spectrum while removing others. Removing low frequency trends means, to apply a high pass filter. The high pass filtering on time serie is done by using discrete cosine transform ( DCT).11
Mathematically
For time points t = 1,…., N
The discrete cosine set functions are given below
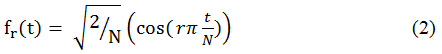
The integer index r ranges from 1 to user specified maximum R.
Figure 3 shows the signal processing steps for fMRI data processing the code is implemeted in MATLAB. The analysis is restricted to the intra cranial region only. The intra cranial pixels are separated from the remaining pixels by using a mask. The following steps are incorporated while processing the fMRI data for various subjects.
Select the pixel time series within the intra cranial region.
Apply DCT on original time series.
Detect the PSD of DCT time series.
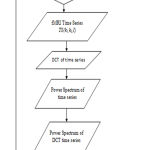 |
Figure 3: Flow chart of signal processing.
|
Results
Analysis of fMRI images is implemented for lower limb (LL) and upper limb (UL) movements. Figure 4 shows the original time series as well as low frequency drift. Figure 5 shows the power spectrum of DCT time series. Figure 6 shows the power spectrum for UL movement. Figure 7 shows the power spectrum for LL movement. The spike observed in the power spectrum at f Hz corresponds to the frequency of the task in this experiment. Power amplitude is observed to be different for different activities performed by the subject. Table 1 shows the result of frequency and power for different motor activities performed.
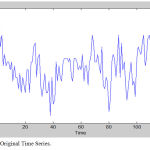 |
Figure 4: Original Time Series.
|
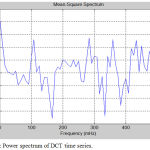 |
Figure 5: Power spectrum of DCT time series.
|
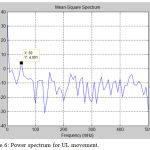 |
Figure 6: Power spectrum for UL movement.
|
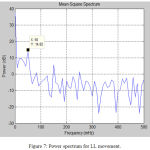 |
Figure 7: Power spectrum for LL movement.
|
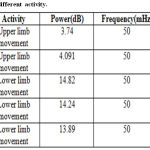 |
Table 1: PSD for different activity.
|
Conclusion
Original time series as well as HP filter fit (DCT) time series is similar. The power spectrum of the original time series exhibited low frequency noise which is removed by using a high pass filter. The power magnitude of the spike is recorded for lower limb as well as upper limb movement. The spike in the power spectrum at f Hz corresponds to the frequency of the task. In this experiment the frequency of the task f is 50 mHz (once every 20 seconds). The power amplitude for lower limb activity is around 14.31 dB and upper limb is 4.0 dB. The PSD of time series is be used for the detection of activity in the brain. They can be useful for characterizing the time course of signals that are estimated using independent components analysis. Also the detection of activity in brain from fMRI images can be done by applying novel methods like periodicity. Furthermore, brain mapping can be done based on statistical parameters of the fMRI time series for different activities.
References
- He B, Yang L, Wilke C. Electrophysiological Imaging of Brain Activity and Connectivity-Challenges and Opportunities. IEEE Transactions on Biomedical Engineering. 2011; 58: 1918-1931.
- Tumer A, Erdogan S. Translating fMRI to fNIRS. In:IEEE 2013, 6th annual International IEEE EMBS conference on Neural Engineering; 6-8 November 2013; San Diego, California, USA: IEEE. pp. 493-496.
- Liu J, Caprihana A. Extracting principle components for discriminant analysis of fMRI images. In: IEEE 2008, International Conferenece on Acoust Speech Signal Processing; 31 March- 4 April 2008; Las Vegas, NV, USA: IEEE. pp. 449-452.
- Zhang J, Chen H, Fang F. Convolution Power Spectrum for fMRI Data Based on Prior Image Signal. IEEE Transactions on Biomedical Imaging. 2010; 57: 343-352.
- Sanches J, Afonso D, Bartnykas K. Comparison of two different approaches for brain activity detection in fMRI. In: IEEE 2008, International symposium on Biomedical Imaging; 13-17 May.2008; Paris, France: IEEE. pp. 596-599.
- Mantini D, Cugini S, Romani G. Fusion of EEG and fMRI for the investigation of functional connectivity during a visual oddball task. In: IEEE 2007, 6th International symposium on Noninvasive functional source international conference of functional biomedical imaging; 12-14 Oct. 2007; Hangzhou, China. IEEE. pp. 373-376.
- Daimiwal N, Sundharajan M, Shriram R. Application of fMRI for Brain Mapping. (IJCIS) International Journal of computer science and information Security 2012; 10: 23-27.
- Moritz CH, Rogers BP, Meyerand M. Power spectrum ranked independent component analysis of a periodic fMRI complex motor paradigm. Human Brain Mapping 2003; 18: 111-122.
- Kashou NH, Xu R, Roberts CJ, Leguire LE. Using FMRI and FNIRS for localization and monitoring of visual cortex activities. In: IEEE 2007, Proceedings of the 29th Annual International Conference of the IEEE EMBS; 23-26 August 2007; Lyon France: IEEE. pp. 2634-2638.
- Amin H, Malik A, Badruddin N. Brain Activation During Cognitive Tasks. In: IEEE 2012, EMBS International Conference on Biomedical Engineering and Sciences; 17-19 December 2012; Langkawi Malaysia: IEEE. pp. 950-953.
- Poldrack RA, Mumford JA, Nichols TE. Handbook of FUNCTIONAL MRI Data Analysis. USA: Cambridge University press, 2011.
- Friston KJ, Ashburner J, Kiebel SJ. Statistical Parametric Mapping the analysis of functional brain images. San Diego, CA, USA: Academic Press, 2007.
- Zarahn E, Aguirre GK, D’Esposito M. Empirical analyses of BOLD fMRI statistics .I. Spatially unsmoothed data collected under null hypothesis conditions. Neuroimage 1997; 5: 179-97.
- Smith AM, Lewis BK. Investigation of low frequency drifts in fMRI signal. Neuroimage 1999; 9: 526-33.
- Detre JA, Wang J. Technical aspects and utility of fMRI using BOLD and ASL. Neurophysiology 2002; 113: 621-34.
- Stehling MK, Turner R. Echo-planar Imaging: Magnetic Resonance imaging in a fraction of a second 2004; 254: 44-49.
- Deshmukh A, Shivhare V. Functional MRI activation signal detection using the periodicity transform. In: IEEE 2004, International Conference on Signal and Communication (SPCOM); 11-14 Dec. 2004; Bangalor, India: IEEE. 121-125.
- Friston KJ, Jezzard P, Turner R. Analysis of Functional MRI time- series. Human Brain Mapping 1994; 2: 69-78.
- Matthews PM, Honey GD, Bullmore ET. Applications of fMRI in translational Medicine and Clinical Practice. Neuroscience 2006; 7: 732-744.
- Deshmukh A, Shivhare V, Parihar R, Gadre V. Periodicity Analysis of fMRI data in the Wavelet Domain. In: 2005 National Communications Conference; 28-30 January 2005; IIT, Kharagpur, India: pp. 460-464.

