
Manuscript accepted on :18-June-2019
Published online on: 13-07-2019
Plagiarism Check: Yes
Reviewed by: Dr. Neetu Faujdar
Second Review by: Md. Sarwar Hossain
Final Approval by: Dr. Ricardo Lagoa
Susmitha Shankar and S. Thangam*
Department of Computer Science and Engineering, Amrita School of Engineering, Bengaluru, Amrita Vishwa Vidyapeetham, India.
Corresponding Author E-mail: s_thangam@blr.amrita.edu
DOI : https://dx.doi.org/10.13005/bpj/1736
Abstract
With the advent of new technologies, a large amount of biological data is easily generated in comparatively cheaper cost. Prior to this data integration was done by simple means of database addition, with less complexity due to lesser data generated in a standardized format. Understanding a complete biological phenomenon, such as disease, need a comprehensive understanding of many dimensions associated with it. This information cannot be captured in a single data type format. Mandating the use of a single data type study would leave us with incomplete answers to various biological questions. Thus the development of an effective integration technique with effective visualization platform is the need of the hour. One such framework requires the identification of relevant data from the input system, storing and transforming data into the intermediary level and then mapping these data into an appropriate position in the output systems. This intermediate level helps in reducing the number of connection and repeated specification creation. Integration of drug dataset would not only reduce the propagation of incorrect and not-updated medicinal information among doctors, but it would also help build better treatment strategies. Integration of drug data and visualization technique would be a novel approach to study drugs and effect on one platform. In this work, we tried to integrate the Adverse Effects, Drug Enforcement and Drug Label data from openFDA. This integrated database is coupled with a visualization platform IDEALS, an abbreviation for Integrated Drug Events, Adverse Effect and Label System.
Keywords
Data Integration; Drug System; Visualization Platform
Download this article as:| Copy the following to cite this article: Shankar S, Thangam S. Integrated System for Easier and Effective Access to Drug Information. Biomed Pharmacol J 2019;12(3). |
| Copy the following to cite this URL: Shankar S, Thangam S. Integrated System for Easier and Effective Access to Drug Information. Biomed Pharmacol J 2019;12(3). Available from: https://bit.ly/2GcWzSF |
Introduction
With the advent of recent technology, the rise of data generated in the biomedical domain is exponential1,2 . With a large amount of information flowing in due to technological and algorithmic advances in biological sciences, data integration has become a must to ensure high quality and strong confidence dataset. Integration of data sets would help in compensation of missing values or unreliable data of single source data, thereby reducing the probability of getting a false positive. Apart from all these, the integration of biomedical data set is important since it helps in the efficient understanding of a complete model. In order to possess a complete understanding of a particular phenomenon, such as disease or effect of a drug, using only one dimension of data would be insufficient. Thus, the unification of data in an appropriate manner is important3.
Analysis of a phenomenon, like a disease, requires understanding and knowledge of various subtopics, drugs being one of them. With improved drug database model and its detailed knowledge, analysis of complete biological model would be much easier helping in creating a better biological outcome. The information on drugs and its various types is spread across disparate databases. Creation of an integration platform for drugs, unifying all types of drugs-whether in clinical trials or FDA approved or vet-approved, would be a helpful choice to comprehensive decision making for researchers and practitioners. Detailed understanding of drugs of various types could provide meticulous details about the treatment of a particular disease. However, this task becomes tedious and time-consuming because of the absence of integrated drug database platforms. The unified database of drug and related information, would not only help the researcher to create the drug-disease relationship but also help practitioners to take a better decision on which drug would be best suitable to treat a patient with a given disease. The proposed work aims to integrate drugs, their adverse effect, related recall information and product label to enhance the quality of study on drug analysis. The work involves the creation of the unified platform coupled with the visualization platform, for ease of use by researchers and practitioners.
State of Art
Integration is one of the major tasks being dealt with various industry and research organizations. Integration is an quintessential task when the data is closely related, multi-features and sparse at the same time, as in the case of use of machine learning algorithm4 or working with big data5. One of the major research area, with an immense requirement for integration of varied and multi-dimensional systems, is biological data. Biological research is highly data-centric, dealing with interrelated yet different data altogether6,78,9. To establish a complete understanding of a particular phenomenon, with available information, it is needed that the datasets from different dimensions are brought together. With the increase in data due to upcoming technology, data retrieval and consistency is to be kept at constant check. This is why the integration of biological dataset is the need of the hour. It is the method to combine, manipulate and re-analyze the data. The main challenges occur since the sources of these data may differ in standards, annotation, and formats for the data, which creates confusion. The main issue of data heterogeneity in the biological dataset could be resolved by standardizing the data structures and achieving uniformity to an extent possible10
With various techniques and highly advanced algorithm, specific to domain and result of integration, it now has become inexorable to understand methods of biological integration in as depth as possible before taking on a decision on which methodology to choose. Figure 1 diagrammatically illustrates the various techniques that can be used for the integration of biological datasets.
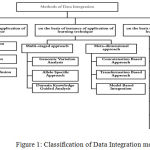 |
Figure 1: Classification of Data Integration methods.
|
Nobel in the book “Kernel Methods in Computational Biology” describes the integration on the basis of learning techniques as early fusion, late fusion, and intermediate fusion. Early fusion deals with the concatenation of features from different data before application of supervised or unsupervised learning, while in late fusion technique, separate models are first learned for features and then their outcomes are used to determine the final model. In intermediate fusion, data integration happens in the learning stage11. Ritchie et al.12 describe the integration approach by classifying into two techniques namely multi-staged and meta-dimensional approach. Multi-staged approach divides the entire process into multiple stages to find the association between different data-types and then, between the data-type and phenotype of interest. The approach uses both linear and non-linear analytical mathematics. Based on the study, few examples of this approach are Genomic variation analysis in which association between SNPs and Phenotype are created, this set of phenotypes is then reduced based on the filtering with the help of threshold value. The subset is then inputted to another set of operation based on the omics data. The operation may be to associate SNP with the gene expression level to form expression quantitative trait loci(eQTL) or methyl quantitative trait loci(mQTL) or metabolite QTL. Omics data subset is then correlated with the phenotype of interest. The methods for analysis include regression and causal inference association. Another method to solve the problem on analysis using genomic variation is causal inference method13,14. Few other examples are Allele Specific approach 15 and Domain Knowledge guided approach. The multi staged approach shows good result only when the analysis is to be conducted in a stepwise manner, and not in a simultaneous analysis of variables of the data-set. In meta dimensional approach all scales of data are combined to identify multiple variables from the different data type. An example is concatenation based approach, which concatenates multiple data matrices for each sample on a large matrix using variable selection- not a stepwise approach as in multi-staged approach. It is useful when considering the interaction between different types of data. Few other examples are transformation-based approach, model-based integration16. Machine learning techniques could also be coupled into the integration process.based on different machine learning techniques used. Some approaches used in this approach are feature concatenation17,18 , Bayesian model19,20, Ensemble tree learning using bagging and boosting21, Kernel Learning22, Network-Based, Feature Extraction, Matrix Factorization, and Deep Learning Neural Networks.
The drug discovery could either be done in-vivo through experimental-setups or be done computationally. In-vivo identification of drug can be performed in two ways, firstly by taking samples, using Affymetrix or other such platforms to compute gene signature upon induction from a perturbagen or secondly, testing on an organism as a whole, i.e. taking human or non-human species as a source of experiment and studies. Depending on the study and the targets, design for the sample is prepared and the experiment is conducted. The targets may be under constant observation (as in the case of observational study) or may be under treatment (investigational study). The results must be closely examined and all factors that may be involved must be studied carefully. Although important, in-vivo studies are highly complex, prone to experimental errors and cost-consuming. Computational approaches, on the other hand, are based on causal relationship derived from several experimental results, the creation of simulations for analysis based on biomolecular and biochemical models, analysis of structural variants when the drug binds with targets, analysis of gene-expression upon the action of a product and many other methods. They involve testing a smaller number of reaction on drugs and predict the effect of the same on a larger scale. This method helps in faster target identification, screening of targets, and the characterization and prediction of drug effects in a cost-effective manner23.
One of the main applications of integrating the drugs from various sources is to study the effect of drugs on patients and the association of the drugs with adverse events in patients. Adverse Event is defined as the reaction of drugs on the patient, leading to dissatisfactory results like disability, hospitalization or even death. The integrated platform can be then used in the development of the predictive model for the drug-target association and drug repurposing. Associating drugs to the effect helps in inferring which drugs are safe to be used on patients24,25. The unified drug database and a common platform for sharing and associating the information of various effects and reaction have helped society in many aspects. The integrated dataset could help in easier drug discovery, target drug-association, reduced number of attrition as well as prediction of the effect on an organism. This could help in developing a better framework for personalized medical care. Also, the integrated platform helps in the creation of stable pharmacological as well as pharmacodynamic mode26.
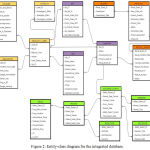 |
Figure 2: Entity-class diagram for the integrated database.
|
Method
The proposed work aims to integrate drugs, their adverse effect, related recall information and product label to enhance the quality of study on drug analysis. The work also involves the creation of the unified platform, for ease of use by researchers and practitioners.
Data Sources
The list of open source drug data was retrieved from drugs@FDA. drugs@FDA provides a list of drugs pronounced “approved” for consumption by the Food and Drugs Authority 27. Apart from the list of approved drugs, other data used in the work include data on adverse events, product label information as provided by structured product label format(SPL) and associated recall information (if any) from openFDA28. The recall information from FDA contains a set of all event information as reported in FDA Regulatory Product manual and can be extracted from Recall Enterprise System (RES). Data since 2004 was collected for the integration and study of various recall events. The hazard caused by recalled products is classified into 3 level- class 1, class 2 and class 3.
Adverse events are the events that cause discomfort in the patient undergoing treatment of a medical product. The discomfort could be allergies, hospitalization, disability or even death. These data are reported in FAERS (FDA Adverse Event reporting system). Information related to treatment, drugs involved and the patient reaction can be collected from FAERS. FDA provides the documentation related to their products in a documented way, published as Structured Product label (SPL). The SPL provides detail about which product the use of a product, indication, etc.
Database Design
The integrated result is stored in an object-relational database, which was implemented using SQL . Figure 2 shows the class-entity relational model for the integrated database. Once the data was inserted into the database, normalization steps were followed that helped us get rid of unwanted and redundant information. The model designed is based on meta-dimensional integration strategy, involving concatenation and transformation based integration technique. The model is flexible to updates and can be easily maintained.
Integration
The data were extracted one by one from the data repository in raw format. The first step involved the analysis of the data and the interpretation of different features associated. The statistical analysis of the dataset was conducted using R. These data were then segregated into different classes based on their interpretation and significance of the class, programmatically using C# in .Net Core environment. Since the data separated into logical chunk involved a large number of data operations, the code was run in an asynchronous parallel fashion. This data was normalized to 3NF. Once the classes were conducted and the data was divided, an SQL connection was established with SQL Server, where the tables reside using Microsoft Azure Data Studio. Data was imported to SQL. Further to integration, final check on the validation of the dataset was done. Figure 3 produces the implementation flowchart of the work. The first step for implementation was the extraction of the data from the open source database-openFDA. The total data extracted is around 230GB. Table 1 shows the statistics for the amount of data in each type. Once extracted, the raw data is then analyzed.
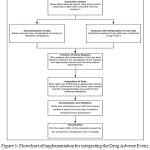 |
Figure 3: Flowchart of implementation for integrating the Drug Adverse Event, Drug Enforcement and Product label for the drugs.
|
Table 1: Statistics of amount of data retrieved.
| Data retrieved (in GB,approx) | |
| Adverse Events | 178 |
| Product Label | 40 |
| Recall Enforcement | 11 |
The analysis is done using R. Once the data is clearly understood, the data is then purified to extract relevant information. The algorithm for the execution is presented in Figure 4. The data from various sources were thus concatenated with appropriate labels because of similar feature names across various data sources. Then, concatenation based integration approaches were used along with mediator-wrapper algorithm. Code for extraction and splitting of data is done using the .Net platform and coded in C# language. The database design is done as discussed in former section and the relational table is created using SQL. Once the database is created, this data set is connected to the visualization platform created using VueJS. The unified platform is together termed as Integrated Drug, Enforcement and Label System, abbreviated as IDEALS.
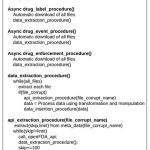 |
Figure 4: Algorithm for the execution.
|
Results and Discussion
The data integrated into IDEALS amounts to around 230 GB. The major gap listed in literature survey is the absence of an analysis platform with visualization features that could help to provide detailed drug description in one platform. Challenges for the creation of this platform include:
Larger data to be stored in any internal memory during processing.
Most use of tightly coupled database specific construction of a database.
Due to these challenges, a high amount of data to be stored in RAM during the preprocessing of data causes a problem. This challenge is solved using the algorithm by treating one file at a time and preprocessing it, and feeding into tables. Once over, this table is deleted from RAM before starting the next program. The computational time is reduced in this process by creating asynchronous threads and running the codes parallelly. Thus, the approach optimizes the data storage during preprocessing and manages the computational time efficiently. The use of the tightly coupled program is reduced considerably by extensive use of wrappers to go from one data source to another and also from one platform to another. For making this highly effective, the code is modularized. Thus, the addition of any new database would deal with writing extracting feature just for that database and feeding to the program using a similar module. Thus, this approach built is highly feasible for easier integration with new databases. The openFDA data was segregated to 15 tables with the number of records as provided in Figure 5. The use of the wrapper based algorithm helped in the reduction of the space required for the preprocessing by almost 50%. The algorithm compiles strongly with the ACID property of databases. The use of concatenation- based approach and the use of technologies such as SQL Server, dotnet core and creation of multiple threads running parallelly in asynchronous fashion has reduced the computational process time drastically. Once the data is completely entered in the unified database, a visualization tool to analyze various information provided by the integrated database at one platform is created and the database is connected to it. Figure 6 shows the view in IDEALS pertaining to IODIUM, a terminated OTC drug. The view gives information related to the amount of dosage and the administration route.
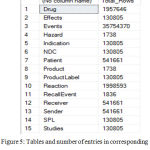 |
Figure 5: Tables and number of entries in corresponding table in the integrated databases.
|
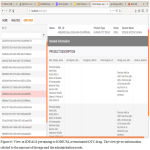 |
Figure 6: View in IDEALS pertaining to IODIUM, a terminated OTC drug. The view gives information related to the amount of dosage and the administration route.
|
Conclusion
Integration of biological databases is a route to gain a complete understanding of the disease and best possible panacea for the same. The integration of such databases could be made useful for predictive analysis on disease-drug-target studies, drug-drug similarity studies, and development of precise and personal medical care. This could bring a breakthrough in the pharmacogenomics industry. Also, the in-vivo tests for all use-cases would require infeasible and extravagant expense. This suggests the creation and development of strong computational models in the field of biomedical care. For the doctors and biologists, with lesser computer science experience, the easiest way to understand the computationally acquired result is the use of feasible and less complex Graphical User Interface. However, due to practical issues, such as standardization of the dataset, checking on the confidence of the data set, large memory requirements and high computational time for preprocessing, it is a challenging affair. Also, since the focus is generally on few datasets, the algorithm generally coded are tightly coupled. This work involves the creation of an integrated drug database system coupled with a graphical user interface, by trying to solve the aforementioned challenges. The algorithm uses wrappers to automatically download files from the three data sources, namely Adverse Events, Drug Enforcement, and Drug Label. The algorithm is coded in a loosely coupled manner. The use of modern technique leads to the reduction in the utilization of memory for processing by 50%. Also, the computational time for dataset manipulation operation is also reduced.
The integrated database is coupled with the visualization tool, built using Vue and kendoUI. The visualization tool is named as IDEALS, an abbreviation for Integrated Drug Enforcement, Adverse events, and Labels System. The integrated database platform can be used to multiple utilities such as the use of drugs for predictive analysis, check on the upcoming curated drugs and analysis of bioactivity. Such an integrated database is required to lower the attrition rate by a clear and complete analysis of the presence of the active drug. Although integration is just the first step towards the detailed understanding of the drug product, implementation of the user interface and utility of an algorithm that could dynamically integrate other sources is a requirement of the day. Stronger predictive analysis can be built upon by the use of these larger databases. Although the code is optimally developed to a trade-off between memory requirement and computational time, the overall system can be still modified for better using the big data and cloud technologies
Acknowledgements
The work is not supported by any funding.
Funding Source
There are no funding sources.
Conflict of Interest
There is no conflict of interest.
Reference
- Greene, C. S., Tan, J., Ung, M., Moore, J. H. & Cheng, C. Big Data Bioinformatics. Journal of Cellular Physiology 229, 1896–1900 (2014).
- Bourne, P. E. Big data in biomedicine — An NIH perspective. 2015 IEEE International Conference on Bioinformatics and Biomedicine (BIBM) (2015). doi:10.1109/bibm.2015.7359644
- Merelli, I., Pérez-Sánchez, H., Gesing, S. & D’Agostino, D. Managing, analysing, and integrating big data in medical bioinformatics: open problems and future perspectives. Biomed Res. Int. 2014, 134023 (2014).
- Kavikuil, K. & Amudha, J. Leveraging Deep Learning for Anomaly Detection in Video Surveillance. Advances in Intelligent Systems and Computing 239–247 (2019). doi:10.1007/978-981-13-1580-0_23
- Viswanath, V. K., Madhuri, C. G. V., Raviteja, C., Saravanan, S. & Venugopalan, M. Hadoop and Natural Language Processing Based Analysis on Kisan Call Center (KCC) Data. 2018 International Conference on Advances in Computing, Communications and Informatics (ICACCI) (2018). doi:10.1109/icacci.2018.8554531
- Fox, G. et al. Biomedical Case Studies in Data Intensive Computing. Lecture Notes in Computer Science 2–18 (2009). doi:10.1007/978-3-642-10665-1_2
- Slavik, M., Zhu, X., Mahgoub, I., Khoshgoftaar, T. & Narayanan, R. Data Intensive Computing: A Biomedical Case Study in Gene Selection and Filtering. Handbook of Data Intensive Computing 563–580 (2011). doi:10.1007/978-1-4614-1415-5_22
- Fox, G. et al. Biomedical Case Studies in Data Intensive Computing. in Lecture Notes in Computer Science 2–18 (2009).
- Slavik, M., Zhu, X., Mahgoub, I., Khoshgoftaar, T. & Narayanan, R. Data Intensive Computing: A Biomedical Case Study in Gene Selection and Filtering. in Handbook of Data Intensive Computing 563–580 (2011).
- Lapatas, V., Stefanidakis, M., Jimenez, R. C., Via, A. & Schneider, M. V. Data integration in biological research: an overview. Journal of Biological Research-Thessaloniki 22, (2015).
- Istrail, S. & Pevzner, P. A. Kernel Methods in Computational Biology. (MIT Press, 2004).
- Ritchie, M. D., Holzinger, E. R., Li, R., Pendergrass, S. A. & Kim, D. Methods of integrating data to uncover genotype-phenotype interactions. Nat. Rev. Genet. 16, 85–97 (2015).
- Liu, Y. et al. Epigenome-wide association data implicate DNA methylation as an intermediary of genetic risk in rheumatoid arthritis. Nat. Biotechnol. 31, 142–147 (2013).
- Schadt, E. E. et al. An integrative genomics approach to infer causal associations between gene expression and disease. Nat. Genet. 37, 710–717 (2005).
- Maynard, N. D., Chen, J., Stuart, R. K., Fan, J.-B. & Ren, B. Genome-wide mapping of allele-specific protein-DNA interactions in human cells. Nat. Methods 5, 307–309 (2008).
- Lin, E. & Lane, H.-Y. Machine learning and systems genomics approaches for multi-omics data. Biomark Res 5, 2 (2017).
- Chickering, D. M. Learning Bayesian Networks is NP-Complete. Learning from Data 121–130 (1996). doi:10.1007/978-1-4612-2404-4_12
- Croft, J. & Smith, J. Q. Discrete mixtures in Bayesian networks with hidden variables: a latent time budget example. Computational Statistics & Data Analysis 41, 539–547 (2003).
- Pearl, J. BAYESIAN INFERENCE. Probabilistic Reasoning in Intelligent Systems 29–75 (1988). doi:10.1016/b978-0-08-051489-5.50008-4
- Pearl, J. MARKOV AND BAYESIAN NETWORKS. Probabilistic Reasoning in Intelligent Systems 77–141 (1988). doi:10.1016/b978-0-08-051489-5.50009-6
- Breiman, L. Bagging predictors. Machine Learning 24, 123–140 (1996).
- Li, Y., Caron, R. J. & Ngom, A. A decomposition method for large-scale sparse coding in representation learning. 2014 International Joint Conference on Neural Networks (IJCNN) (2014). doi:10.1109/ijcnn.2014.6889394
- Xia, X. Bioinformatics and Drug Discovery. Curr. Top. Med. Chem. 17, 1709–1726 (2017).
- Lee, W.-P., Huang, J.-Y., Chang, H.-H., Lee, K.-T. & Lai, C.-T. Predicting Drug Side Effects Using Data Analytics and the Integration of Multiple Data Sources. IEEE Access 5, 20449–20462 (2017).
- Bresso, E. et al. Integrative relational machine-learning for understanding drug side-effect profiles. BMC Bioinformatics 14, 207 (2013).
- Gleeson, M. P. et al. The challenges involved in modeling toxicity data in silico: a review. Curr. Pharm. Des. 18, 1266–1291 (2012).
- Drugs@FDA: FDA Approved Drug Products.
- openFDA. Available at: https://open.fda.gov/. (Accessed: 2nd March 2019).

