
Manuscript accepted on :4 Oct 2017
Published online on: 30-09-2019
Plagiarism Check: Yes
O. Jeba Shiney1*, J. Amar Pratap Singh2 and Priestly Shan B3
1Department of Nanotechnology, Noorul Islam University, Kumarakoil.
2Director Administration, Noorul Islam University, Kumarakoil.
3Eranad Knowledge City Technical Campus, Manjeri, Malappuram.
Corresponding Author’s Email: jebashiney@gmail.com
DOI : https://dx.doi.org/10.13005/bpj/1741
Abstract
Segmentation of ultrasound images has been found to be a tedious task due to the presence of speckle and other artifacts. The random nature of the multiplicative speckle noise and lack of demarcation of information in ultrasound images makes the segmentation a highly complex one. In this paper a modified watershed based method has been proposed for segmentation of features from Ultrasound images towards efficient diagnosis of Down Syndrome in first and second trimester. The pixels are grouped based on the pixel differences and the co- occurrence matrix is formed based on the energy and contrast. If global scheme is adopted for segmentation the high frequency edges may appear as artifacts. Hence to overcome this the wavelet transform of co-occurrence matrix is obtained and each decomposed band is subjected to an averaging filter. The process bands are thresholded using Otsu’s method and a binary image is obtained. The isolated pixels are removed by using suitable morphological operations. Then inverse wavelet transform is performed to obtain the image skeleton. The resultant image is subjected to watershed segmentation using gradients. Using the above mentioned approach we can see that the regions of interest are clearly segmented and is producing reproducible results.
Keywords
Segmentation; Ultrasound Image; Wavelet
Download this article as:| Copy the following to cite this article: Shiney O. J, Singh J. A. P, Shan B. P. Extraction of Fetal Features from B Mode Ultrasonograms for Efficient Diagnosis of Down Syndrome in First and Second Trimester. Biomed Pharmacol J 2019;12(3). |
| Copy the following to cite this URL: Shiney O. J, Singh J. A. P, Shan B. P. Extraction of Fetal Features from B Mode Ultrasonograms for Efficient Diagnosis of Down Syndrome in First and Second Trimester. Biomed Pharmacol J 2019;12(3). Available from: https://bit.ly/2nanzMj |
Introduction
Partitioning or dividing an image into connected regions which shares some common features based on grey level, texture or statistics is referred to as segmentation. Estimation of features which represents the tissue characteristics for diagnosis in a suitable way using ultrasound is still a serious problem and affects the diagnostic accuracy. Normally two adjacent regions having different properties is expected to exhibit high variations (which we refer to as high frequency region) along their common borders. But practically especially in the case of ultrasounds this thumb rule cannot be used as such. This is because of the fact that in ultrasounds at most times what we see or measure is not always what we want. The weak shape constraints (smoothness), Shape space constraints and geometrical constraints along with appearance and motion constraints makes the ultrasound segmentation a challenging task.
Approaches to segmentation of ultrasounds can be classified as pixel based approach, continuity approach, edge based approach and statistical models. Pixel based methods can be easily implemented but their output is influenced by noise. Continuity based and edge based algorithms achieve segmentation by searching for similarities or differences. Statistical methods classify pixels to a region based on their correlation with a cost function.
In this paper the segmentation of ultrasound image is achieved by computing the co-occurrence matrix using mean and variance derived from the wavelet coefficients. The resultant images are smoothened, morphologically treated and subjected to watershed transform in order to obtain the segmented image. The remainder of the paper is organized as follows: Section II details the generation of co-occurrence matrix and the various steps used. In section III we present the results and discussion and conclusion in section IV.
Proposed Segmentation Scheme
The detailed process flow diagram of the proposed scheme is shown in figure 1. The image is decomposed by using haar transform. The 1D algorithm for transforming a two element vector [x(1), x(2)]T into [y(1), y(2)]T by using the relation [1]
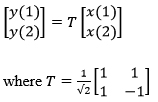
In two dimension x and y becomes 2X2 matrices
![]()
The above operations in y correspond to 2D low pass filter-LL [a+b+c+d], horizontal high pass and vertical low pass filter- HL [a-b+c-d], horizontal low pass and vertical high pass fiter – LH [a+b-c-d] and 2D high pass filter- HH [a-b-c+d]. Inorder to apply the transform we group the pixels in the image into 2X2 blocks and the haar transformation equation is applied. It can be noted that majority of the energy is contained in the LL region and least energy is in the HH region. The HL and LH regions depict the boundaries of various objects in the image.
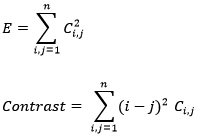
The decomposed image using DWT is subjected to statistical processing for the computation of co-occurrence matrix. In this case the co-occurrence matrix is constructed and the energy and contrast features are computed. The equation for energy and contrast is given by [1]
But researches over the years have found out that the presence of speckle can be best modeled by a Rayleigh distribution and hence in this work the co-occurrence matrix has been formed using MeanRL and VarianceRL which can be given by [2]
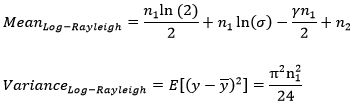
Where γ=0.5772 is Euler constant, n1 is image dynamic range, and n2 is gain setting (ratio of minimum to maximum signal). It can be concluded that the mean depends on three factors: initial Rayleigh variance, n1 and n2, while the variance depends only on the dynamic range n1.
The co-occurrence matrix is formed by estimating the variance using the above equations. The edges in ultrasound image can be formed by groups.3 1. Edge between two objects of interest and 2.The edge between speckle region and speckle scattered regions. It can be found in literature that even though the histogram of two regions of interest under diagnosis remains similar the statistical values could be different. Therefore it can be concluded that the histogram in region of interaction between the organs of diagnostic importance and specular scatter will have a long range compared to the region of interaction between two specular regions of diagnostic importance. By this we can identify the edges and segment the regions of diagnostic importance by defining suitable cost functions with Local Histogram Range Image (LHRI). Using the above features, mean and variance the co-occurrence matrix is generated. A new matrix from the co-occurrence matrix is formed by estimating the differences in the co-occurrence matrix in both horizontal and vertical directions.
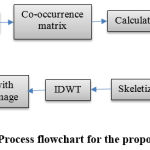 |
Figure 1: Process flowchart for the proposed scheme |
Due to the spurious nature of ultrasound within the region of interest where high differences of features appeared it is possible that spots and noise may be formed. These were removed by applying an averaging filter at each band. The resultant coefficients are thresholded using global threshold by applying the otsu’s method which results in a binary image with thick boundaries (black and white). Skeletonization is achieved by suitable morphological operations to remove the isolated pixels and to remove the unwanted pixels at the boundaries making up the image skeleton. Applying inverse wavelet transforms in the above coefficient matrices will give us the segmented output.
Results and Discussion
The algorithm was applied on fetal images to evaluate the results. Figure 2 shows the results obtained at various stages. The algorithms are implemented and tested in 1.86 GHz processor using matlab 13. The resuts of the proposed scheme are shown in figure 2.
Quantitative evaluation of segmentation schemes
The similarity measures which have been applied for the evaluation of the performance of the segmentation scheme are Dice Similarity Coefficient, Tanimoto Index and Overlap index.
Dice Similarity Coefficient
The measure of similarity/dissimilarity and reproducibility of the segmented region is given by the Dice similarity coefficient (DSC). If the DSC value is zero it means the segments doesn’t overlap at all. A DSC value of 1 shows that the segments are completely overlapped. A value between zero and one represents partialy segmented results. A diagramatic representation of the above conditions showing overlap and reproducibility is given in figure 3.
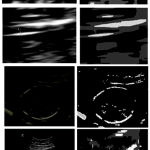 |
Figure 2: Original B Mode Diagnostic Ultrasound Image (Left) and the segmented image (Right) |
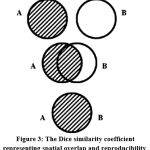 |
Figure 3: The Dice similarity coefficient representing spatial overlap and reproducibility. |
DSC is a similarity measure related to the Jaccard index. The similarity measure S is given by,
![]()
where X and Y are the strings obtained using Bigrams. The Jaccard index for DSC is given by
![]()
where A and B are the image under processing and obtained segmented image to be compared for validation respectively.
Tanimoto Index
It is given by the ratio of total number of pixels in the region where A is the input image and B is the corresponding region in the segmented image of the original image A and the corresponding region in the segmented image B to the number of pixels in the region . The mathematical representation is given below
![]()
Overlap Index
It is given by the ratio of total number of pixels in the region where A is the input image and B is the corresponding region in the segmented image of the original image A and the corresponding region in the segmented image B to the total number of pixels in both the regions. The index can be mathematically expressed as
![]()
A quantitative comparison of these algorithms is presented in Table 1. It is observed from table 1 that the proposed segmentation scheme has better performance. As it is reported elsewhere, higher the value of evaluation parameters, better the segmentation. The dice similarity coefficient improves the stability.
Table 1: Segmentation Evaluation Parameters
| Dice Similarity Coefficient | Tanimoto Index | Overlap Index |
| 0.61241 | 0.25024 | 0.39742 |
Conclusion
In this paper a simple algorithm for ultrasound image segmentation has been proposed. The algorithm makes use of local histogram processing approach in the wavelet bands thereby increasing the computation speed. The use of statistical measures for generating the co-occurrence matrix has increased the stability of the algorithm with higher values of DSC, TI and Overlap index. This algorithm can be effectively used for segmentation of diagnostically significant features. Also the use of local histogram based approach has considerably reduced the computation load thereby increasing the processing speed.
References
- Andrea Gavlasova ́, Aleˇs Procha ́zka, and Martina Mudrova ́, Wavelet Based Image Segmentation, http://uprt.vscht.cz/prochazka/ps/06tc.pdf
- Ali Kermani, Ahmad Ayatollahi, Ahmad Mirzaei, Mohammad Barekatain, “Medical ultrasound image segmentation by modified local histogram range image method”, Biomedical Science and Engineering, 2010, 3, 1078-1084
- Priestly Shan and M.Madheswaran, “Nonlinear Cost optimization scheme for feature segmentation in second trimester fetal images” Proceedings of the 7th ACS/IEEE International Conference on Computer Systems and Applications, Rabat, Morocco, 2009, 456 – 463.
- Won Y Yang, Cao, Morris, “Applied Numerical Methods Using MATLAB” John Wiley and sons, Singapore, 2005, 321 – 357.
- Kelly H Zou, “Statistical Validation of Image Segmentation Quality Based on a Spatial Overlap Index”, Acad Radiology, 2004, 11(2): 178–189.
- Larrabide, Feijoo, et.al, “An Image segmentation Method based on a Discrete version of the Topological derivative” 6th World Congress on Structural and Multidisciplinary Optimization, Rio de Janerio, 30 May – 03 June, 2005.
- Gonzalez C.R., Woods R.E., Digital Image Processing – Second Edition, Prentice Hall, 2001.

