
Manuscript accepted on :17-Sep-2019
Published online on: 17-09-2019
Plagiarism Check: Yes
Reviewed by: Md.Sarwar Hossain
Second Review by: Muhammad Shahzad Aslam
Final Approval by: Dr Ayush Dogra
Department of Electronics and Communication Engineering, National Institute of Technology Silchar, Assam, India 788010
Corresponding Author Email: murugan.rmn@gmail.com
DOI : https://dx.doi.org/10.13005/bpj/1772
Abstract
Programmed retinal picture investigation is a significant screening device for simple identification of eye infections like diabetic retinopathy, glaucoma. Hemorrhage (HE) identification is one of the significant strides in programmed extraction in Diabetic Retinopathy (DR) ailment. The manual strategy evaluated by clinicians is a tedious and asset concentrated procedure. Programmed retinal picture examination gives a prompt recognition and portrayal of retinal highlights preceding a pro investigation. Current HE detection techniques suffer from impractically-high computation time. In this research work, presented a technique to automatically detect HE. This paper proposes an efficient motion pattern generation algorithm to detect HE. The novelty of this method is to reduce the dimensional space based on image resolutions thus, enhances to speedup of the HE detection. The proposed strategy was executed in MATLAB and assessed both ordinary and unusual retinal pictures utilizing openly accessible MESSIDOR dataset. The proposed strategy accomplished better execution estimates when contrast with other cutting edge strategies. This automated method helps ophthalmologists in the screening process of DR.
Keywords
Automatic Detection; Diabetic Retinopathy; Human Retina; Hemorrhage; Motion Pattern Generation
Download this article as:| Copy the following to cite this article: Murugan R. An Automatic Detection of Hemorrhages in Retinal Fundus Images by Motion Pattern Generation. Biomed Pharmacol J 2019;12(3). |
| Copy the following to cite this URL: Murugan R. An Automatic Detection of Hemorrhages in Retinal Fundus Images by Motion Pattern Generation. Biomed Pharmacol J 2019;12(3). Available from: http://biomedpharmajournal.org/?p=28708 |
Introduction
The World Health Organization (WHO) evaluates that there are right now 347 million individuals experiencing diabetes and activities that this ailment will be the seventh driving reason for death worldwide in 2030 [1]. Throughout the years, patients with diabetes will in general show variations from the norm in the retina, building up a difficulty called Diabetic Retinopathy (DR). The significant indications of DR within the sight of Microaneurysms (MAs), hemorrhages (HEs) and Exudates [2]. In Figure 1 demonstrates a fundus picture caught in a noninvasive manner, containing MA and HEs. From 2005 to 2008, 28.5% and 4.4% diabetic patients over the age of 40 years were determined to have diabetic retinopathy (DR) and progressed DR, Which can prompt vision misfortune [3]. DR is a dynamic sickness, which can progress from mellow stage to the proliferative stage. It, for the most part, influences about 80% of patients experiencing diabetics for a long time or more [4]. By and large, DR is characterized into two primary stages, to be specific non-proliferative diabetes retinopathy (NPDR) and Proliferative Diabetic Retinopathy (PDR). NPDR is additionally grouped to mellow, moderate or serious stages (Shown in figure 2). This condition prompts, debilitating the dividers of the veins in the retina and minor lumps jut, a store of cholesterol, releasing or overflowing liquid and blood into the retina. The extreme phase of NPDR is the propelled phase of DR, where delicate fresh recruits vessels show up on the outside of the retina and anomalous veins can develop in the retina [5]. On account of the fluctuation in the presence of these sores, various strategies have been intended to recognize each sort of these injuries independently in DR location frameworks [6]. Retinal hemorrhages are red in shading, huge in size and sporadic fit as a fiddle. They are characterized into pre-retinal, sub-retinal, spot and blotch HEs. Instances of various types of HEs are exhibited in Figure 3.
In this work, an endeavor has made to section a wide range of HEs in retinal picture for early finding of DR utilizing movement design age. This paper is sorted out as pursues, in segment II different programmed HE discovery techniques are looked into. The system has displayed in segment III. At that point the dialog HE discovery techniques and end are introduced in segment IV and V separately.
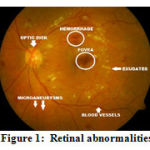 |
Figure 1: Retinal abnormalities |
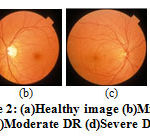 |
Figure 2: (a)Healthy image (b)Mild DR (c)Moderate DR (d)Severe DR |
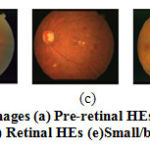 |
Figure 3: Types of hemorrhages (a) Pre-retinal HEs (b) Sub retinal HEs (c) dot HEs (d) Retinal HEs (e)Small/blot HEs |
Related works
A state of the art was done on HE detection in this section. Most of the methods are comes under the any one of the following categories, 1.Pixel-based approach-Concentrating on HE location on the retina, 2.Lesion based approach-Used morphological operators to locate HE, 3.Image based approach-To detect HE on the retina. The image based approach is most efficient methods when compare to others because it is the direct approach, the computational time less. The proposed approach is comes under image based approach. The recent automatic detection methods of hemorrhages are presenting Table 1.
Table 1: Review of HA detection methods
| Author name | Highlights/limitations | Year Database |
| Godlin Atlas et al[7] | Susceptible to bright Lesion/ Tested on healthy images only | 2018 MESSIDOR |
| Karkuzhali et al[1] | Susceptible to Lesion with bright with similar HA size/ method is not fully automatic | 2018 STARE |
| Manjaramkar et al[2] | Susceptible to low contrast and absence of the HA | 2017 DIARETDB1
MESSIDOR |
| Junior et al[8] | Susceptible to quality of images/ Robust in HA incomplete appearance and change | 2013 DIARETDB1 |
| Prasad et al [9]
Sharma et al[10]
Tang et al[11]
Hatanaka et al.[12]
Grisan et al.[13]
Zhang etal.[14] |
Susceptible to The poor quality of images. -Susceptible to lesion with bright and size similar to HA.
Susceptible to incomplete HA appearance/Susceptible to bright lesion Susceptible to lesion with bright and size similar to HA Susceptible to the lack of sizable vessels Robust in HA appearance change/Susceptible to incomplete construction of the vascular structure Robust in lesion with bright and size similar to HA Robust in lesion with bright and size similar to OD |
2015 Not reported
2014 DIARETDB1
2013 MESSIDOR
2008 Local
2007 Local
2005 Local |
The Motivation for the research is in the existing literature many authors focusing on detection of retinal hemorrhage from fundus images. From that studies some of the techniques are time-dependent, consuming more energy and expensive. Still the problem are existing while detection of HE, the challenges are facing while detecting HE in the retinal image as follows, 1. The huge number of fundamentally the same as pixel tests, 2.Large HA happen rarely, 3. Irregular shape without indication of DR. This examination street numbers these issues utilizing film age.
Materials and Methodology
The MESSIDOR database has been set up to streamline thinks about on PC helped judgments of diabetic retinopathy. The 1200 eye fundus shading numerical pictures of the back shaft for the MESSIDOR database were created by 3 ophthalmologic divisions utilizing a shading video 3CCD camera on a Topcon TRC NW6 non-mydriatic retinograph with a 45-degree field of view. The pictures were caught utilizing 8 bits for each shading plane at 1440×960, 2240×1488 and 2304×1536 pixels. Around 800 pictures were obtained with student widening and 400 without expansion [15].
The HE appears like lots of magnificent, high unpredictability bruises and is common especially confined. The macula is a dull structure for the most part at the point of convergence of the retina. With no HE (i.e., a customary retina), there is a cruel rotational symmetry about the macula in the indirect region of by and large twofold the width of the optic plate. This perception is utilized to decide huge highlights to delineate customary and strange cases. The given retinal pictures, a round ROI is first evacuated and widely appealing depiction generally called the development case of the ROI is made. Appropriate highlights are then derived for movement example to amass the given picture as the run of the mill or abnormal (containing HE).
Region of Interest Extraction
The DR seriousness stick is resolved depends on the area of HE groups in respect to the macula, the pictures gained for HA recognition as a rule center on the macular locale. The best fit hover inside the fundus cover [16] with macula at the middle, for a given picture. The district inside this circle is the ideal ROI meant as (see Fig. 4 and Fig.6.c. for a model). The green channel shapes the contribution of all consequent preparing. The focal point of the macula is consequently identified utilizing [17] and limiting the hunt to a local district of the given picture since the obtained pictures for HE recognition are macula-driven. Since the OD shares a brilliance trademark like HE, it is likewise consequently identified and veiled utilizing [18]. The aftereffect of the macula and optic circle recognition can be found in Fig. 4, where the macula has appeared as a roundabout fix and the OD has appeared as a rectangular fix
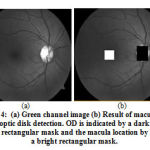 |
Figure 4: (a) Green channel image (b) Result of macula and optic disk detection. OD is indicated by a dark rectangular mask and the macula location by a bright rectangular mask. |
Generation of motion pattern
The production of a movement example is propelled by the impact of movement on the natural/PC visual framework. These frameworks speak to a scene as a lot of spatially inspected (by the sensors/identifiers) forces or a picture. This examining is uniform in cameras while it is logged polar in human eyes. At the point when an item in a scene moves at a rapid, it, for the most part, leaves a spreading design in the caught picture. For the most part, the spatiotemporal changes recorded by the sensor are normal for the moving item [19]. In PC vision, the estimation and evacuation of the smear design, additionally prevalently known as movement obscure in pictures, has been a functioning zone of research [20]. We contend that there is much data about the scene in the smear example and propose to utilize it to speak to a picture. By recreating this activity in a solitary picture by instigating movement. Signal conglomeration at sensor areas in human eyes [21] and camera, offer to ascend to the spreading impact. So as to reproduce this impact, the movement has acquainted in a given picture with produce a grouping of pictures. These are consolidated by applying a capacity to mix the forces at every sensor area to offer ascent to a movement design. Let the given ROI be denoted as I(r). A motion pattern IMP for is derived as follows.
IMP(r) = f(GN(I(r))) (1)
Where r indicates a pixel area, is a change speaking to the actuated movement which is thought to be inflexible. Basically, GN creates changed pictures which are joined utilizing f to blend the examined forces at every pixel area (1). Here, GN(I) is communicated as pursues:
GN(I) = {R(I)} (2)
where R is a pivot lattice. The turn point θn=n θo with n=0,1,… N: θ0 means the revolution step. Whenever n=0, we have no turn and henceforth R0(I)=I. Thus GN is a lot of pivoted variants of the given me and the complete number of turned pictures N=(2π)/( θo). The testing rate θo of the finder decides the number of pictures created in the set GN. In the current issue, since HE shows up as splendid limited injuries against the retinal foundation, they should shape a brilliant smear design in IMP where-as the finished foundation will be smoothed out. This portrayal can along these lines spatially upgrade the qualities of HE and help improve their perceptibility. In the meantime, this ought to likewise serve to limit the impact of the inconstancy saw crosswise over pictures by smoothing them out.
Since the seriousness of the DR malady is legitimately identified with the outspread separation of HE in the round ROI, rotational movement is initiated to create the ideal IMP. The change work GN is connected to produce a succession of pictures which are pivoted forms of I. The spatial degree of spreading of powers relies upon the most extreme revolution through the testing rate at every area is legitimately identified with the measure of every turn step. The age of movement examples has appeared in Fig. 5. Consider a plate with a solitary hover close to the outskirts displaying an injury (first design). At the point when a turn is connected to this example in ventures of θ0, a lot of examples are created. The rest of the examples in this figure are the consequence of the association of examples produced with diminishing advance size. It very well may be seen that a diminishing in the progression size outcomes in a few duplicates of the sore in the final result. In this model, the movement design IMP is acquired by utilizing the association acts as the mixing capacity. By and by, any combining capacity f can be utilized. The quality of the sign at IMP(r) won’t just rely upon the decision of, yet in addition on the examining rate θ0.
In the current issue, the decision of ought to in a perfect world 1) improve the HE by expanding the degree of the smear brought about by it in the movement example and 2) increment the homogeneity of retinal foundation. In like manner, two capacities in particular Mean and Maximum were considered in this work. These are characterized as pursues.
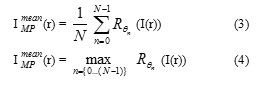
While the blending capacity Mean (Equation 3) endeavors to accomplish the averaging impact observed in movement obscure, Maximum (Equation 4) attempts to misuse the way that HE generally seem more splendid than some other structures out of sight at a similar spiral separation. It very well may be seen that the movement examples are obviously particular for these two classes. The created movement example has appeared in Fig.5.
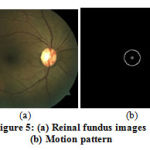 |
Figure 5: (a) Reinal fundus images (b) Motion pattern |
Feature selection
The movement design IMP created by actuating movement on I results in the spreading of sores when present, along the movement way (as in Fig. 5). To successfully depict this movement design, we propose to utilize a descriptor got from the Radon space. The Radon change of f(x,y) is the essence of f(x,y) along a line situated at and remove from the birthplace. Given f(x,y), its rakish projection pα is figured as
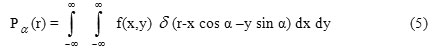
α is the angle between the line and axis.
In our concern, the picture IMP is anticipated to get a vector reaction for each edge and the ideal component vector at that point is determined by connecting the reactions pα for various directions. The spatial degree of any HE that might be available is enhanced in the movement design IMP and is thusly reflected quickly in the projection based component vector. In this way, the element vector for an unusual retina will have a few crests in its profile because of powers relating to HE. Then again, the element vectors for a typical retina will have generally uniform qualities bringing about a conservative ordinary subspace. These component vectors are utilized for learning the subspace comparing to ordinary pictures. The detected HE is shown in Fig.6.
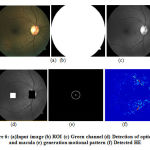 |
Figure 6: (a)Input image (b) ROI (c) Green channel (d) Detection of optic disc and macula (e) generation motional pattern (f) Detected HE |
Results and Discussion
The proposed technique was executed in MATLAB (R2018b) where runs required by and large 1.5min for each picture on a workstation (Pentium(R) Dual-Core2 CPU and T4300@ 2.10GHz, 3.00 GB RAM 64-bit OS).The proposed method was evaluated by retinal images using the subset of MESSIDOR (Fig.6), and the success percentage was found to be 99%. Though using motion pattern generation algorithm the HE detection involves more success percentage than other state of art methods.
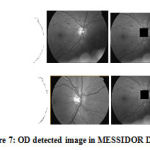 |
Figure 7: OD detected image in MESSIDOR Dataset |
The HE detection results has quantify using sensitivity and specificity measures. These measures were chosen based on the literature review; it is defined as Equation 6 and 7 respectively.
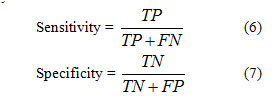
Where TP is True Positive When the detection result is positive, the HE is present in the image, which is called “True Positive” (TP).FP is False Positive the HE is not present in the image, which is known as “False Positive” (FP).TN is True Negative when the detection result is negative, HA is does not found in the image, which is known as “True Negative” (TN).FN is False Negative when the detection result is negative, HA is does not able to found in the image, which is known as “False Negative” (FN).
The exhibition of the proposed technique was assessed by MESSIDOR dataset. The bookkeeping of the pixels in TP, FN, FP, and TN was performed for each subsequent picture of the strategy. Table 2 demonstrates the examination hemorrhages recognition methods with best in class strategies. The proposed technique accomplished acceptable outcomes when contrasted with other condition of the strategies.
Table 2: Comparison of HA detection methods with state of the art methods
| Algorithm | Database | Sensitivity | Specificity |
| Modified Region Growing | MESSIDOR | 85 | 99 |
| Hybrid approach | STARE | 97 | 92 |
| Maximally Stable Extremal Regions | DIARETDB1 | 96 | 97 |
| Mathematical morphology | MESSIDOR | 87 | 92 |
| Gaussian filter | DIARETDB1 | 95 | 90 |
| Dynamic thresholding | DIARETDB1 | 75 | 93 |
| splat features classification | MESSIDOR | 100 | 60 |
| Brightness correction | Local | 80 | 80 |
| Local thresholding, | Local | 87 | 95 |
| Principal Component Analysis | Local | 94 | 87 |
| Proposed method | MESSIDOR | 97 | 98 |
The proposed methodology is approved on the MESSIDOR dataset and accomplished the affectability and explicitness. The discharge locator could be coordinated into far-reaching screening frameworks helping ophthalmologists in the identification of diabetic retinopathy. Figure 8 demonstrates the approval of the proposed work with MESSIDOR dataset.
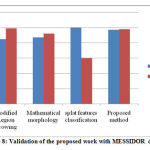 |
Figure 8: Validation of the proposed work with MESSIDOR dataset |
Conclusion and future work
This paper displayed a procedure for HE identification utilizing movement design age. The exhibited technique accomplished better execution estimates when contrasted with another best in class strategies. The obtained performance measure is sensitivity and specificity like 97% and 98% respectively. The validation was done from the publicly available dataset MESSIDOR.This detection method will help in DR and other eye disease screening process. In future the deep learning is going to apply for the grading of DR by the detection of HE.
Conflict of interest
The author declare no conflict of interest.
Funding Source
There is no funding agency supported for this wok.
References
- Karkuzhali, S, Manimegalai D. Detection of Hemorrhages in Retinal Images using Hybrid Approach for Diagnosis of Diabetic Retinopathy, International Journal of Pure and Applied Mathematics, 2018; 118(18): 2841-2846.
- Manjaramkar A, Manesh K. Connected Component Clustering Based Hemorrhage Detection in Color Fundus Images, International Journal of Intelligent Engineering and Systems, 2018; 11(2): 143-151.
- Laxmi R, Nisha. Automated System for Detection of High Risk Diabetic Macular Edema in Color Retinal Images, International Journal of Computer Applications, 2017; 178(2): 15-21
- Hamid S, Sare S, Ali H. M, Hamid A. Early detection of diabetic retinopathy, Survey of Ophthalmology, 2018; 63(5): 601-6085.
- Biyani R.S, Patre B.M, Algorithms for red lesion detection in Diabetic Retinopathy: A review, Biomedicine & Pharmacotherapy,2018; 107: 681-688.
- Ankita G, Rita C. Diabetic Retinopathy: Present and Past, Procedia Computer Science, 2018; 132; 1432-1440.
- Godlin A.L, Kumar P. Detection of retinal hemorrhage from fundus images using ANFIS classifier and MRG segmentation, Biomedical Research, 2018; 29 (7);1489-1497.
- Sérgio B. J, Daniel W. Automatic detection of microaneurysms and hemorr hages in color eye fundus images, International Journal of Computer Science & Information Technology, 2013; 5(5); 21-37.
- Preniya P. Retinal Hemorrhage Detection Using Feature Classification, International Journal Of Engineering And Computer Science, 2015; 4( 3); 10960-10963..
- Sharma A, Dutta M. K, Singh A, Parthasarathi M. Travieso C. M. Dynamic thre sholding technique for detection of hemorrhages in retinal images, Seventh International Conference on Contemporary Computing, 2014;113-116.
- Tang L, Niemeijer M, Reinhardt J. M. Garvin M. K, Abramoff M. D. Splat Feature Classification with Application to Retinal Hemorrhage Detection in Fundus Images, in IEEE Transactions on Medical Imaging, 2013; 32(2): 364-375.
- Hatanaka Y, Nakagawa T, Hayashi Y, Hara T, Fujita H. Improvement of Automated Detection Method of Hemorrhages in Fundus Images, Proceedings: 30th Annual International IEEE EMBS Conference, 2008; 5429 – 5432.
- Grisan E. Ruggeri A. Segmentation of candidate dark lesions in fundus images based on local thresholding and pixel density, 29th Annual International Conference of the IEEE Engineering in Medicine and Biology Society, 2007:6735-6738.
- Zhang X, Chutatape O. A SVM approach for detection of hemorrhages in background diabetic retinopathy, Proceedings OF IEEE International Joint Conference on Neural Networks,2005; 4. 2435 – 2440.
- Decencière. Feedback on a publicly distributed database: the Messidor database.
Image Analysis & Stereology, 2014; 33(3): 231-234. - Ram K, Sivaswamy J. Multi-space clustering for segmentation of exudates in retinal color photographs, Proc. Annu. Int. Conf. IEEE Eng. Med. Biol. Soc., 2009;1437–1440.
- Singh J, Joshi G. D, Sivaswamy J. Appearance-based object detection in colour retinal images, Proc. Int. Conf. Image Process.,2008; 1432–1435.
- Joshi G. D, Sivaswamy J, Karan K, Krishnadas S. R, “Optic disk and cup boundary detection using regional information, Proc. Int.Conf. Image Process., 2010; 948–951.
- Stone J. V,Object recognition using spatiotemporal signatures, Vision Research, 1998; 38(7):947–951.
- Cho S, Matsushita Y, Lee S. Removing non-uniform motion blur from images, Proc. IEEE 11th Int. Conf. Comput. Vis., 2007;1–8.
- Nishida S, Watanabe J, Kuriki I, Tokimoto T. Human visual system integrates color signals along a motion trajectory, Current Biol., 2007; 17(4); 366–372.

