
Manuscript accepted on :12-June-2019
Published online on: 27-06-2019
Plagiarism Check: Yes
Reviewed by: Pietro Scicchitano
Second Review by: Jerwin Prabu
T. Athira*1  and P. Shaniba Asmi2
Department of Electronics and Communication Engineering, MES College of Engineering, Kuttippuram, India.
Corresponding Author E-mail: athiraamritham@gmail.com
DOI : https://dx.doi.org/10.13005/bpj/1729
Abstract
Proper evaluation and detection of uterine contraction is an important treat during gestation period. Uterine contraction happens by the generation of electrical activity from a given myometrial cell to the adjacent cell. There are various methods for monitoring uterine contraction but they lack to distinguish true labour contractions (efficient) from contractions that will not cause delivery (inefficient). One of the most accurate non-invasive technique for monitoring uterine contraction is the uterine electromyogram or Electrohysterogram (EHG). The main aim of this paper is to check whether it is possible to discriminate labour and pregnancy contraction by using 16 electrode database. And also to check bipolar signals give better classification rate than monopolar signals. Result shows that bipolar signal have better performance than monopolar signals.
Keywords
Bipolar Signal; Electrohysterogram; Feature Extraction; Foetal Monitoring; Icelandic 16-Electrode Electrohysterogram; Uterine Contraction
Download this article as:| Copy the following to cite this article: Athira T, Asmi P. S. Analysis of Unipolar and Bipolar 4x4 EHG Signal for Classifying Uterine Contraction. Biomed Pharmacol J 2019;12(2). |
| Copy the following to cite this URL: Athira T, Asmi P. S. Analysis of Unipolar and Bipolar 4x4 EHG Signal for Classifying Uterine Contraction. Biomed Pharmacol J 2019;12(2). Available from: https://bit.ly/2ZP4rB5 |
Introduction
Child birth occurs by efficient and regular contraction of uterus. Proper monitoring during gestation period not only reduces risk in delivery but also avoid unwanted hospitalization. One of the major disaster during gestation period is preterm birth or premature labour which increases neonatal mortality and morbidity. According to World Health Organization (WHO) preterm labour can be defined as birth occurs before completing 37 weeks of gestation period whereas term birth implies birth happens between 37 and 42 weeks of gestation.1 Studies have shown that EHG is the most promising method for distinguishing labour and pregnancy contraction2 by placing electrodes on the abdomen wall of the pregnant women.
Several studies have shown that EHG features are dynamic and change throughout pregnancy. Uterine contraction is weak and poorly coordinated during pregnancy, and strong and synchronized during labour. EMG parameters can specify myometrial properties that can distinguish between pregnancy contraction and labour contraction. The study of EHG signals is non-invasive, does not require any special facilities or equipment and is relatively low-cost.3 Studies have shown that unipolar EHG signals are very noisy and have low SNR (Signal to noise ratio). Signals may contain noises due to electronic and electromagnetic field and also by respiratory movements, and electrocardiogram from both the mother and the foetus.4 This will affect to extract the informative features and also leads to lower performance. For this reason, bipolar signals will help to avoid common noises and artifacts.
This paper aims to discriminate pregnancy and labour contraction and also to compare the performance of the system by using unipolar and bipolar signals. In Section 2, the EHG dataset used in this work and pre-processing as well as feature extracted are described in detail. The obtained results are presented in Section 3. Finally, conclusions of the proposed system and future work are given in Section 4.
Materials and Method
The block diagram of EHG data processing is shown in fig.1.
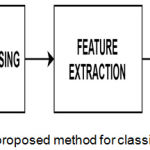 |
Figure 1: Block diagram of the proposed method for classifying uterine EMG signals.
|
Database Description
The EHG records used in this study were downloaded from Icelandic 16-electrode Electrohysterogram Database of PhysioNet made on 45 pregnant women.5,6 The database consists of 122 recordings. From that 112 recordings, were performed in the third trimester of pregnancy and 10 recordings, during labour. Embla A10 is the device used for data acquisition. The sampling rate of the record is 200 Hz. The electrodes were numbered from 1 to 16 and form a 4 by 4 matrix (fig.2). The third line of electrodes i.e., 9 to 12 is positioned on the median vertical axis of the uterus and the 10th – 11th pair of electrodes is placed between the uterine fundus and pubic symphysis. And a ground electrode and a reference electrode are attached on the iliac crest of both sides.
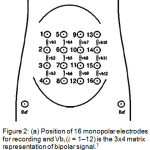 |
Figure 2: (a) Position of 16 monopolar electrodes for recording and Vbi (𝑖 = 1–12) is the 3×4 matrix representation of bipolar signal.7
|
Pre-Processing
EHG signal is a non-stationary signal which contains interferences or artifacts such as maternal ECG, maternal respiration, foetal movements etc. So that the raw signals cannot be used directly for feature extraction without doing pre-processing. This study is used to check the classification accuracy of unipolar and bipolar signals. Therefore bipolar signals (Vbi, i = 1 to 12) are calculated by subtracting adjacent monopolar electrodes along vertical axis as shown in fig 1. The signals are then filtered by using fourth band pass filter with a frequency range 0.3-3 Hz. Then signals were scaled into 480 sec with 90000 samples per each signal to make all signals to equal length. To extract the contraction burst and to reduce complexity in performance the signals are then segmented manually. After segmentation we got 150 labour and 150 pregnancy EHG bursts with 6000 samples. per each signal that we used for the further analysis.
Feature Extraction
After pre-processing next step is feature extraction as shown in fig 1. By feature extraction the relevant features of signal can be extracted and later can be used for classification. In this research time domain8 and frequency domain7 features were extracted in-order to study unipolar and bipolar signal and also for discrimination.
Time Domain Features
For time domain features the features are extracted based on amplitude of the signal that varies with time. In this study three time domain features are extracted, they are root mean square (RMS), variance and standard deviation.
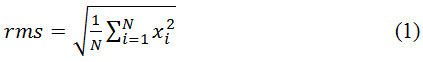
Root Mean Square (RMS)
The RMS is defined as the square root of the mean square of the EMG signal over a given period of time.
Variance
Variance measures the mean of the squared deviation of EMG signal from its mean. It is the common statistical method for time domain extraction.
![]()
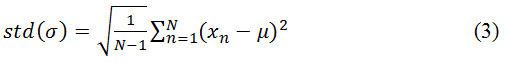
Standard Deviation
Standard deviation measures the amount of variation or dispersion of a set of data values.
Frequency Domain Features
Frequency domain features or spectral-domain features are extracted from power spectral density (PSD). The power density spectrum is the function of frequency and represents the relative contribution of each frequency to the signal. In our work, the PSD of each segment was obtained by using periodogram method. All features are then calculated from the power spectral density.
Mean Frequency
Mean frequency or mean power frequency or mean spectral frequency is an average frequency which is calculated as the sum of product of power spectrum intensity and the frequency divided by the total.
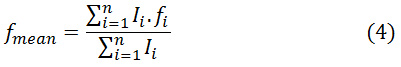
Where n denotes the number of frequency components in the power spectrum, fi the value of the frequency and Ii the intensity of the power spectrum corresponding to the frequency fi.
Median Frequency
Median frequency is another frequency domain feature which is also known as half of the total power. It is defined as the frequency at which the power spectrum is divided into two regions with equal amplitude or as the frequency just above where the sums of the parts above and below in the frequency-power spectrum, P, are the same. The median frequency is calculated as follows:
Classification
After proper feature extraction the extracted features are then classified using suitable classifier as shown in fig.2. The classification stage is used to discriminate between the two classes, pregnancy and labour state. A classifier has a very important role to accurately separate the data into the two classes. For this work Linear Discriminant Analysis (LDA) is used for classification purposes. LDA is the most simple and robust classifier which reduce the dimensionality of the feature matrix. In our study 70% of data is used for training and 30% for testing.
Classification performance of LDA is evaluated by using accuracy which can define as2:
In equation (6) TP is the total number of labour EHG samples correctly identified; FP is the total number of labour EHG samples incorrectly identified; TN is the total number of pregnancy EHG samples correctly identified; FN is the total number of pregnancy EHG samples incorrectly identified.2
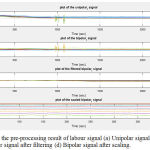 |
Figure 3: Shows the pre-processing result of labour signal (a) Unipolar signal (b) Bipolar signal (c) Bipolar signal after filtering (d) Bipolar signal after scaling.
|
Table 1: Classification accuracy of unipolar and bipolar signals in time domain.
| Time domain Parameters | LDA classification accuracy | |
| Unipolar | Bipolar | |
| RMS | 46.7% | 66.7% |
| Variance | 37% | 68.9% |
| Standard deviation | 36.7% | 58% |
Table 2: Classification accuracy of unipolar and bipolar signals in frequency domain.
| Frequency domain Parameters | LDA classification accuracy | |
| Unipolar | Bipolar | |
| Mean Frequency | 60% | 62.2% |
| Median Frequency | 37.8% | 53.3% |
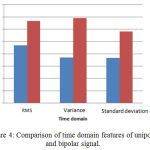 |
Figure 4: Comparison of time domain features of unipolar and bipolar signal.
|
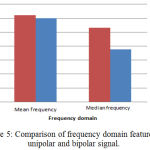 |
Figure 5: Comparison of frequency domain features of unipolar and bipolar signal.
|
Result and Discussion
The data set selected for this work contain 10 labour and 10 pregnancy recordings from Icelandic 16-electrode Electrohysterogram Database. Then each recording was filtered using Butterworth band pass filter, scaled and segmented to get 150 pregnancy and 150 labour signals. We also calculated bipolar signals to check the performance with unipolar signals. Fig.3a shows an example for selected unipolar labour signal. Fig.3b, 3c, 3d shows the result of calculated bipolar labour signal of corresponding unipolar signal, after filtering and scaling respectively.
After pre-processing next step is feature extraction. For that time domain features such as RMS, variance, standard deviation and frequency domain features such as mean and median frequency are calculated. After that by using LDA classifier the features are classified. The result shows that both time domain and frequency domain features can be used to discriminate between pregnancy contraction and labour contraction. Table 1 shows the classification accuracy of unipolar and bipolar signals in time domain. Among three time domain features RMS shows better classification accuracy of 46.7% for unipolar signals whereas for bipolar signals variance shows better accuracy of 68.9% (fig.4). In the case of frequency domain of unipolar and bipolar signal mean frequency shows best performance as in fig.5. And also we can conclude that bipolar signals shows better performance than unipolar signals.
Conclusion
In this paper the classification accuracy of unipolar and bipolar 4×4 EHG (Electrohysterogram) is compared. Common statistical features like RMS, variance, standard deviation and frequency domain features such as mean and median frequency are studied to discriminate into two classes. From this study we conclude that bipolar signals have better classification accuracy. And also comparing with frequency domain features time domain features shows the better result. In-order to improve classification accuracy other features such as higher order statistics, fractal dimension, Wavelet can also be selected for future work. In future neural network can also be included to increase the speed and performance.
Acknowledgements
We would thank Icelandic 16-electrode Electrohysterogram Database of PhysioNet for their database. We would like to thank our MES college of Engineering for providing all help and support for our contribution.
Conflict of Interest
There is no conflict of interest.
Funding Source
There is no funding source.
References
- Alamedine, M. Khalil, and C.Marque, “ Comparison of Different EHG Feature Selection Methods for the Detection of Preterm Labor”, Computational and Mathematical Methods in Medicine , pp. 1-9, Article ID 485684, 2013.
- Lili Chen and Yaru Hao, “Feature Extraction and Classification of EHG between Pregnancy and Labour Group Using Hilbert-Huang Transform and Extreme Learning Machine”, Computational and Mathematical Methods in Medicine, pp. 1-9, Article ID 7949507, 2017.
- Garcia-Casado.,Y.Ye-Lin et al., “Electrohysterography in the diagnosis of preterm birth: a review”, in Institute of Physics and Engineering in Medicine b(IPEM)., February 2018.
- Malunoud Hassan.,Jeremy Terrien and Charles Muszynski et al., “Better Pregnancy Monitoring Using Nonlinear Correlation Analysis of External Uterine Electromyograpy”, IEEE transactions on biomedical engineering, vol. 60, no. 4, April 2013.
- L. Goldberger, L. A. N Amaral, L. Glass et al., “PhysioNet, PhysioBank, and PhysioToolkit: components of a new research resource for complex physiologic signals,” Circulation, vol. 101, no. 23, pp. E215–E220, 2000.
- Alexandersson A., Steingrimsdottir T., Terrien J., Marque C., Karlsson B., “The Icelandic 16-electrode electrohysterogram database”, Scientific Data, vol. 2, Article ID150017, 2015.
- Moslem B., Karlsson B., Diab M.O., Khalil M. and Marque C. “Classification Performance of the Frequency-Related Parameters Derived From Uterine EMG Signals”,33rd Annual International Conference of the IEEE EMBS, pp.3371-3374, Sep 3, 2011.
- Cemin Altin. and Orhan Er., “Comparison of Different Time and Frequency Domain Feature Extraction Methods on Elbow Gesture’s EMG”, European Journal of Interdisciplinary Studies., vol.2, pp.35-44, Issue 3, August 2016.

