
Manuscript accepted on :16-May-2019
Published online on: 15-06-2019
Plagiarism Check: Yes
Reviewed by: Revathi Shenoy
Second Review by: Utkarsh Mangal
Banda Srinivas Raja1 and Tummala Ranga Babu2
1Department of Electronics and Communication Engineering, Acharya Nagarjuna University, Guntur, India.
2Department of Electronics and Communication Engineering, RVR and JC College of Engineering, Acharya Nagarjuna University, Andhrapradesh, India.
Corresponding Author E-mail: aruninvlsime@gmail.com
DOI : https://dx.doi.org/10.13005/bpj/1712
Abstract
In the current era, research on automated knowledge extraction from Chronic Obstructive Pulmonary Disease (COPD) images is growing rapidly. COPD becomes a highly prevalent disease that impacts both patients and healthcare system. In various medical applications, image classification algorithms are used to predict the disease severity that can help in early diagnosis and decision-making process. Also, for large scale and complex medical images, machine learning techniques are more efficient,accuracy and reliable. Traditional image classification models such as Naïve Bayesian, Neural Networks, SVM, Regression models. etc are used to classify the image using the annotated ROI and image texture features. These models are used as a diagnostic tool in analyzing the COPD and disease prediction. These models are not applicable to classify the COPD using the disease severity level. Also, the accuracy and false positive rate of existing classification models is still far from satisfactory, due to lack of feature extraction and noise handling methods. Therefore, developing an effective classification model for predicting the severity of the COPD using features derived from CT images is a challenge task.In this paper, an ensemble feature selection based classification model was developed, using images features extracted from COPD patients’ CT scan images, to classify disease into “Severity level ” and “Normal level” categories, representing their riskof suffering a COPD disease. We applied five different classifier methods and three state-of-the-art ensemble classifiers to the COPD dataset and validated their performance in terms of F-measure and false positive rate. We found that proposed feature selection based ensemble classifier (F-measure 0.957) had the highest average accuracy for COPD classification.
Keywords
Copd Disease; Classification Models; Image Classification; Machine Learning
Download this article as:| Copy the following to cite this article: Raja B. S, Babu T. R. A Novel Feature Selection Based Ensemble Decision Tree Classification Model for Predicting Severity Level of COPD Disease. Biomed Pharmacol J 2019;12(2). |
| Copy the following to cite this URL: Raja B. S, Babu T. R. A Novel Feature selection based Ensemble Decision tree classification model for predicting severity level of COPD disease. Biomed Pharmacol J 2019;12(2). Available from: https://bit.ly/2KTsjPU |
Introduction
Now-a-days Medical Images play a vital role in diagnostic, disease prediction and treatment for health care professionals and researchers. Different imaging modalities and classification models are implemented in the past 10 years. Image classification contains two phases- training phase and classification phase. In training phase, classifier is built by classification algorithm with training set of tuples. Then the model is used for classification and its performance is analyzed by testing set of tuples in the next phase.
A large number of machine learning models have been developed in the literature to analyze the risk patterns for diseases like Rheumatoid Arthritis and Tuberculosis. The interrelationship between bronchitis and emphysema makes it harder to detect a single factor that is contributing towards the disease prediction. Emphysema causes the destruction of the lung tissue that is necessary to balance the physical functionality of the lungs. It destroys the lung tissue which leads to dyspnea. Also, the deficiency of antitrypsin,alpha is a significant genetic factor that causes COPD. Some of the comorbidities associated with COPD are heart diseases, diabetes,skeletal muscle dysfunction and lung cancerChronic obstructive pulmonary disease: Estimated prevalence by current industry, U.S working adults, current smokers aged 18 and over, 2004-2011.1
| All Workers | |||
| Industry | Estimated Population | Prevalence (%) | 95% Confidence Interval |
| Agriculture, Forestry, Fishing, and Hunting | 387, 708 | 3.1 a | 1.2–5.0 |
| Crop production | 159, 854 | 5.2 a | 1.6–8.9 |
| Mining | 187, 014 | 5.1 a | 0.7–9.5 |
| Utilities | 260, 977 | 10.2 a | 3.4–17.1 |
| Nonmetallic mineral product manufacturing | 129, 769 | 10.4 a | 4.2–16.6 |
| Fabricated metal product manufacturing | 355, 688 | 5.1 | 2.5–7.6 |
a Estimation of relative standard-error rate: Generally, 30%<=standard-error-rate<=50%
b No non-smokers in this occupation from 2004 – 2011.
Global Initiative Chronic Obstructive Lung Disease, [2016] 85 million people are diagnosed with a moderate to severe COPD worldwide and from 5-10% of adults suffer from it in Europe. Mortality increased more than 50-60% over the last 20 years and it is estimated that in the next 10 years deaths caused by COPD will go up more than 30-35%. An estimation shows that in 2030 COPD will be the third cause of death worldwide [World Health Organization, 2011 report].
The lungs are one of the main parts of the respiratory systemtogether with the airways, blood vessels and the muscles.The lungs are located in the thorax which is composed of the vertebral column, ribs, sternum and intercostal muscles and it is separated from the abdomen by the diaphragm.
![Figure 1: Emphysematous lung showing the weakened and collapsed air sacs with excess mucus.[a.d.a.m. medical encyclopedia 2016].2](https://biomedpharmajournal.org/wp-content/uploads/2019/06/Vol12No2_Nov_Ban_fig1-150x150.jpg) |
Figure 1: Emphysematous lung showing the weakened and collapsed air sacs with excess mucus.[a.d.a.m. medical encyclopedia 2016].2
|
Emphysema
The chronic airflow obstruction that patients with COPD suffer is caused by a combination of small airways disease, chronic bronchitis, parenchymal destruction and emphysema.3 Emphysema is defined as a lung condition characterized by the destruction of the alveolar walls leading to a loss of elastic tissue and an increase in compliance, as seen in Figure 1.4 When the air spaces are greater than 1cm they are called bullae.
According to GOLD-COPD report 2016, patients with FEV1/FVC < 0.70:
GOLD 1: Mild FEV1 ≥ 80% Predicted.
GOLD 2: Moderate 50% ≤ FEV1 < 80% Predicted.
GOLD 3: Severe 30% ≤ FEV1 < 50% Predicted.
GOLD 4: Very Severe FEV1 < 30% Predicted.
Traditional machine leanring models have two phases to perform COPD predition on medial images. In the first phase,COPD images ares egmented for ROI annotations. The various stages involved in the feature selection process were, enhancing the image, extracting various features, selecting the features and then classifying the images. Extracting the features from the medical images is considered as the most important stage for determining the accuracy of the classifier. Thus, feature extraction is the process used to analyze the objects and images. And further extracting the most prominent features corresponding to various classes of objects is a challenging task. Figure 2 represents the response time of the COPD data,when the number of image features ‘n’ increasing from 2 to 10.
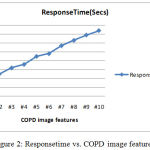 |
Figure 2: Responsetime vs. COPD image features.
|
Medical Image Classification Models
Different types of popular Machine learning based image classification models are discussed below:-
Naive Bayes Model
For research on medical data, the Naive Bayes (NB) classification model has been widely used. As compared to Logistic Regression, Nearest Neighbour, Decision Tree, Neural Network, NB model is more efficient classification model. Naive Bayes classifier is simple, efficient and requires small dataset for training.
K-Nearest Neighbour Mode((KNN)
KNN is a kind of instance-based model of machine learning. In this model, function is locally approximated and all computations is iterated until classification. If the data set is large, then a special method is needed to work on part of data. KNN can also be used for density estimation. KNN classification is necessary in case of unknown parametric estimates of probability densities.
Hidden Markov Model(HMM)
HMM is one of the efficient statistical prediction model. In this model, system is considered to be a Markov process consisting of hidden states which can be represented as a connected Bayesian Network. Though this model is well suited for medical images, but it ignores structure of “states” inside each of the “feature states”.
Support Vector Machine Model
Vapnik in the year 1996 developed a universal constructive learning procedure and named it as SVM. It was based on the statistical predicting theory, which has large number of applications in pattern recognition. SVM uses hyperplanes for defining decision boundaries, which separates data points of different classes. The feature space simplifies the classification problem. Some applications of SVM in different areas:- Area of finance,2,3 industries4,5 and bio-medical domain.6
Random Forests
As random forest algorithm classifies the large amount of data with high accuracy, it is one of the best classification model inmachine learning. It is an ensemble learning model.
Swarm Intelligence
Complex real-world problems are solved using Swarm intelligence (SI). It is a computational intelligence technique. SI involves collective behaviour of individuals in a population interacting with one another and with their environment. In the absence of centralized control system, certain degree random interactions between the agents lead to an “intelligent” global behavior. But, SI models are time-consuming, high false positive rate and high computational cost.
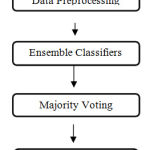 |
Figure 3: Traditional ensemble disease prediction process.
|
A feature subset selection extracts a subset of features from the large set of features using selection measures as shown in fig 3. In the medical image processing, some of them are highly relevant features with the ROI or Texture but others have less intensity. Ensemble classification is defined as the training of multiple base classifiers to detect the disease severity in the test data. The imbalanced property is a primary issue accounting for the poor performance of the traditional ensemble classification models, especially on the minority class attribute. Class imbalance and data uncertainty are the growing research direction in the COPD severity prediction that aims to discover better classification rate.
The main contribution of this paper can be summarized as (i) Feature selection technique is proposed to extract the COPD relevant features for ensemble classification. (i), A novel ensemble feature selection based classification model for COPD classification among different severity classes. (iii) Proposed ensemble classifier combines multiple weak classifiers for COPD severity classification. To the best of our knowledge this kind of ensemble classification based on severity classes was not previously implemented for COPD prediction.
This paper is organized as follows: Related work on the image classification models are presented in section 2. Section 3 describes a novel ensemble image classification model. Section 4 describes the experimental results and discussions. The last section presents our conclusion and future scope.
Related Works
Bai Xing-li et al.,4,5 presented fuzzy support vector machines(FSVM), which is another variant of SVM for image classification for medical field. In this model, a degree of membership is identified for every data feature. By using this, unclassified areas in image were classified contrary to simple SVM. They used the images obtained from mammography having multiple noise levels. Balathasan Giritharan et al.,6 proposed a new incremental model for Support Vector Machines (SVM), as an improvement for the class irregularity problem of abnormality in medical imaging. SVMs give a concise illustration of the dissemination of the training samples. They used bootstrap Gaussian density function to distinguish possible support vectors for each iteration. The generalized guassian density function is used for each feature as follows.
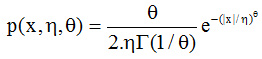
where Γ (.) is the Gamma function, and are generalized Gaussian density factors.
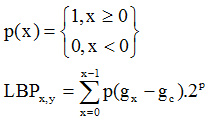
Seong-Hoon Kim et al.,7 presented a new method to improve the classification accuracy and true positive rate. Random Forests and local binary pattern classifier are used to classify the medical image data. Local Binary Pattern is computed as.8
D. Selvathi et al.,8 proposed a image classification system on thyroid images and classify the thyroid features based on ensemble learning model(ELM) with SVM. The measures used to evaluate the thyroid features are mean, Histogram features, variance, NMSID, Coefficient of Local Variation, and Similarity. Two sets of thyroid image databases are used to evaluate SVM and ELM.ELM outperformed SVM in terms of accuracy and precision.
Aleksej Avramovi´c, et al.,9 implemented texture descriptors using SVM to predict the un-classified part in the image. Texture descriptor’s performance was evaluated, to check whether descriptor can isolate outliers in particular class or not. The results are evaluated and found that it can separate images with class-less situation. They used SIFT function to find dispersion and calculating ROI as:
C. V. Subbulakshmi et al., implemented “Single hidden Layer Feed forward Neural networks” (SLFNs) also known as “Extreme Learning Machine”. This technique was applied for heart state data to solve the traditional classification issue. ELM select hidden points(nodes) on random basis to find the resultant weights of “Single hidden Layer Feed Forward Neural networks”.10 M. M. Abdulrazzaq et al.,11 implemented two classification techniques named as KNN and SVM. They used a standard database named as “Image CLEF med 2005” for classification of images. Moreover, statistical factor analysis is applied for feature reduction on image database. The accuracy was enhanced compared to other approaches on same data sets. In their work, SVM automatically classifies brain CT images into two class labels, normal or anomoly. The anomoly brain image determines the prediction of brain tumour. Based upon the symmetry texture in coronal and axial images, normal or anomaly brain image were determined. SVM classify the images by feature vector computed from CT images. The percentage of accuracy of proposed SVM determines, whether the CT image has possibility of anomaly (tumour) or not. N. K. Alham et al.,12 tried to reduce the classification errors of SVM and presented MRESVM.8 MRESVM is a distributed SVM ensemble model for automatic image annotation and ROI. They implemented sequent minimal optimization (SMO) technique to improve the prediction rate. Bagging is the base of MRESVM algorithm, which trains parallel SVMs on medical datasets as shown in Fig 4. The resulting outputs are combined in an appropriate manner. The mapping function trains the SVMs in parallel. They used two-layered hierarchical structure to combine first layer SVMs using the second layer. Though they have achieved 94% accuracy in their proposed work, but there is no better feature selection schemes to improve true positive rate on high dimensional data.
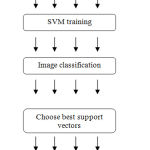 |
Figure 4: Parallel ensemble SVM classifier.
|
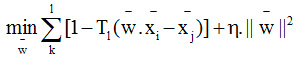
M. Nachtegael et al., increased classification accuracy by using multiple kernel-based classifications.13 The main objective of this model is to combine multiple, heterogeneous data in an efficient way using multiple non-linear kernel learning. They achieved 88.47% accuracy in their demonstration. In their experiment, the feature weighting improves the classification rate in case of eight predefined classes but, the accuracy decreases in four other classes which have very few train and imbalanced test data.Here, the SVM model is generalized to solve only two class problems.The non-linear kernel function used in SVM is as follows:
B. Giritharan, X. et al., considered class imbalance problem in classifications of medical images and presented an incremental SVM as a solution.14 For future iterations, they used bootstrapping for identification of potential candidate support vectors. The resulted sensitivity and specificity were nearly equal to SVM using all samples available at a given incremental step. Incremental SVM shows significant result in training sets of larger size with limited availability of learning power L. Zhang et al., proposed a Polarimetric SAR (PolSAR) image classification through GA-based selective ensemble algorithm in their work.15 In their research work, they classified PolSAR images based upon SVMs, Neural Networks andgenetic algorithm (GA). GA is an evolutionary, heuristic, searching algorithm used for solving optimization problems. This approach select’s best classifier with better performance from multiple classifiers to get optimized result.
W. yu et al., introduced an optimized classification algorithm for medical CTimages of premature brain injury.16 They developed a new algorithm basing on the short comings of the classical ID3 algorithm. Iterative Dichotomiser version 3 (ID3) is a greedy algorithm. Continuous attributes are divided into partitions to classify the image feature. The first phase builds a decision tree by using training sets. In the second phase, input data set is classified based on the generated decision tree. The main limitation of this approach is classification need more computational time with limited training images.
Proposed Model
The present work introduces an automatic feature extraction and COPD severity classification for COPD CT images in the repository.2 The overall workflow can be classified into two phases as shown in Figure 5.
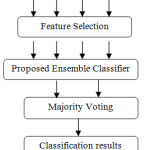 |
Figure 5: Proposed Framework.
|
The ensemble classifier is usually considered to be more efficient and accurate than individual classifier. The simple majority voting is widely used method for voting best classifier among multiple base classifiers. We combine the weak classifiers by using the proposed feature selection and random forest methods instead of the class label.
Feature selection technique is proposed to extract the COPD relevant features for ensemble classification.
A novel ensemble feature selection based classification model for COPD classification among different severity classes.
Proposed ensemble classifier combines multiple weak classifiers for COPD severity classification.
This work have the following advantages:- Gives better performance of classification accuracy, solves class imbalanced problem, best ensemble model in multi-level classification.It works better than other multiple classifier schemes which suffer from the problem of ensemble selection.
Preprocessing
Preprocessing of medical images is the primary step in disease classification process, to minimize noise and to optimize the image quality. Traditional adaptive median filter is used to enhance the image quality as well as remove the poison noise from the images. In the median filter, a window moves along the image and the computed median value of the window pixels becomes the output. It preserves the edges and reduces the noise in the image. Each pixel is replaced with the median value of the neighborhood of the input pixels. In our preprocessing model, we extended the traditional adaptive median filter to remove the noise in the training and test medical images. Local features are extracted by partitioning of each image to multiple blocks.The histogram gradients descriptor was used to discover the COPD severity features.
Proposed Image Preprocessing Algorithm
Input : Training and Test Images
Initialization: Let image I is the original image, Mc is the central pixel of NxN block,Mi is the neighborhood pixel value of the block.| Mi | is the number of the neighbors in each block k is the total blocks in the image.
get Minimum (Histogram(I)): Function returns Minimum values of the given histogram.
get Maximum (Histogram(I)): Function returns Maximum value of the given histogram
Step 1: Build the histogram of image using blocks B(i=1,2,…k-blocks).
Let T1 and T2 are the first and second peak of the computed histogram.
T1=First Peak (Histogram(B));
T1=get Maxium (Histogram (B), int [][] {{0, Histogram(B). length}});
//Move left until an histogram inflection is reached for second peak point.
left minval= get Minimum(Histogram(B), int [] { T1, 0});
right minval = get Minimum (Histogram(B), new int [] { T1, Histogram (B). length});
T2=Second Peak(Histogram(B));
T2=get Maximum (Histogram(B), int [][] {{0, left minval – 1}, { right minval + 1, Histogram(B).length}});
if (T2> T1).
then
new LMin = get Minimum(Histogram(B), int[] { T2, rightminval + 1});
new RMin = get Minimum(Histogram(B), int[] { T2, Histogram(B),});
else
new LMin = get Minimum(Histogram(B), int[] { T2, 0});
newRMin = get Minimum(Histogram(B), int[] { T2, newLMin – 1});
end if
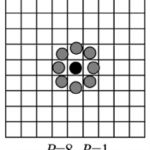
Step 3: Apply Adaptive Local binary patterns operator on Image I.
LBP partitioned image into feature segments. Given an image I, the LBP computes the local patterns of the image texture, which is computed at each pixel value by evaluating the differences between it and its neighbor pixels.
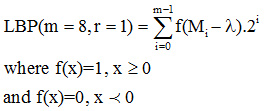
We improved the traditional LBP model with two scheme adaptive LBP model.
The two scheme LBP model with threshold process is given as:
First threshold LBP scheme as:
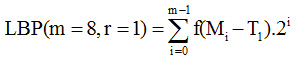
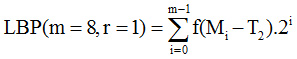
Second threshold LBP scheme as
 |
Scheme 1
|
Step 4: BLH(i=1,2,…k) are the LBP generated feature histograms.
Once the LBP feature histograms are ready, the next key step is to filter the feature histograms using normalized controlled similarity measure.
For each block BLH (i=1,2,…r) in r blocks
Determine block similarity as
Let Bi and Bj are the blocks in the BLH (i=1,2…r); where i!=j
NCSim (Bi, Bj) = ∑ CL (min Bi, Bj), T1,T2) / (T1 + T2)
Where NCSim is the normalized controlled similarity, CL is the control limit of limits and is the minimum intensity values of .
Step 5: Add image features and its similarity values as the training dataset.
Step 6: Repeat steps 1 – 4 to all input images.
Proposed Ensemble Disease Classification Model:Prior to COPD image classification, image features are extracted into database for training severity level susing the proposed ensemble classifier.These features are used to classify COPD into two classes, normal and emphysema disease severity. We implemented a novel ensemble image classifier using Naïve bayes, SVM, Adaboost and enchanced random forest tree as base classifiers on the training data.
Input : Featured Training data Tr, Unlabeled test Data Te
Output: Test image class prediction.
Procedure:
Initialize Tr and Te
For each feature F(i=1,,n) in Tr and Te
Do
If(F[i] is numeric)
Then INormalize (F[i] = (F[i] – μF[i] ) / (Max (F[i]) – Min (F[i]))
End if
If(F[i] is categorical)
Then
INormalize (F[i] = ∑ Prob(F[i] /Cm)) / (Max (W(F[i])) – Min (W(F[i])))
Where Cm represents the m -classes
End if
Done
Apply NaiveBayes, SVM, Adaboost and Enhanced Naïve Bayesian Decision Tree model on the normalized data.
Traditional Random Forest Tree Model
Decision trees are models based on a recursive partition method, aims to divide the training data using attribute in each level. The basic traditional random forest tree has following problems:
Attribute Selection criteria of the random forest is based on traditional measures which are unfit to COPD features.
Doesn’t handle numerical attributes with missing values.
The branch of the decision tree is stopped when the uncertainty or imbalance measure is not correctly pruned.
Split criterion depends on the data distribution of the most probable class within the sample.
Enhanced Naïve Random Forest Tree Algorithm:
This algorithm will overcome the problems in the existing random forest tree. The basic steps involved in the proposed naïve random forest tree are:
Choose k random trees as initial tree growing.
for each tree in the random trees
Randomly select n features from the I Normalized dataset.
For each feature A
Compute conditional probability to each attribute C.
Where probi = prob(i) // prob (Di) // = 1..m(classes)
Class predicted gain measure to each attribute is given as:
![]()
End for
Create a node with the highest CPGain measure.
End for
Select the majority voting as class prediction from the base classifiers and proposed ensemble learning.
Calculate misclassified error rate and statistical true positive rate;
Experimental Resuls
To evaluate the novel ensemble COPD feature performanceon emphysema diasgonis, we used the online emphysema dataset from.17 The database consists of 115 HRCT images of size 512 x 512 and these images belong to a group of 39 categories including smokers and non-smokers with COPD. Each image is labeled using the ROI pattern and severity by an experience pulmonologist and radiologist.The serverity patterns are classified as normal tissue(NT), paraseptal- emphysema(PSE),centrilobular- emphysema (CLE) and panlobular- emphysema (PLE). Also, the severity levels labeled for each slice is classified as no emphysema(0), minimal (1), mild (2),moderate (3),severe (4) and very severe (5). To evaluate the COPDseveritylevel, we used different statistical metrics such as : Recall, Precision, false positive and True positive rates.
Sample COPD Feature Extraction Data in arff format :
@relation COPD
@attribute histogram real
@attribute LBP real
@attribute Similarity real
@attribute class {0,1,2,3,4,5}
@data
2.34375,90.03257751464844,7.437084032141644,0
1.953125,87.79067993164062,7.483955051587976,1
1.953125,87.33673095703125,8.126940046037946,0
2.734375,85.11886596679688,7.673354375930059,2
2.34375,84.82437133789062,7.727759225027902,0
2.734375,90.98129272460938,7.9947153727213545,0
2.34375,91.86859130859375,8.585700988769531,4
2.34375,91.84074401855469,8.160073416573661,0
2.34375,87.11166381835938,8.343639373779297,0
2.34375,86.01722717285156,8.483238220214844,5
1.953125,86.78131103515625,8.840520758377878,0
2.34375,93.05763244628906,8.116295224144345,0
2.34375,93.365478515625,7.547295611837636,3
1.953125,93.91098022460938,8.293260846819196,1
2.34375,88.34190368652344,8.179912567138672,0
2.34375,89.64805603027344,9.309344821506077,0
2.34375,90.06805419921875,7.86041986374628,1
2.34375,90.77301025390625,7.66626440960428,0
1.953125,90.70358276367188,8.528609502883185,0
2.34375,91.50962829589844,8.940238952636719,0
2.34375,87.98904418945312,7.33770287555197,3
1.953125,86.3433837890625,8.022798810686384,4
Table 1: Performance analysis of proposed classification model to the traditional models on No emphysema (0) and Minimal emphysema (1).
| Algorithm | True Positive | False Positive | F-measure | Accuracy |
| Adaboost | 0.612 | 0.365 | 0.618 | 0.632 |
| SVM | 0.577 | 0.418 | 0.599 | 0.651 |
| FSVM | 0.643 | 0.397 | 0.673 | 0.671 |
| Naïve Bayes | 0.641 | 0.362 | 0.661 | 0.701 |
| DT+LBP | 0.678 | 0.307 | 0.71 | 0.734 |
| Ensemble Model | 0.856 | 0.206 | 0.853 | 0.861 |
Table 1, describes the statistical comparison of proposed model with the traditional classification models on COPD data(No emphysema(0) and Minimal emphysema (1)). From the table,it is observed that the true positive, false postitive, F-measure and accuracy improve on an average of 15-20% when preprocessed with the proposed feature selection model and ensemble classification model.
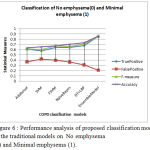 |
Figure 6: Performance analysis of proposed classification model to the traditional models on No emphysema (0) and Minimal emphysema (1).
|
Figure 6, describes the statistical comparison of proposed model with the traditional classification models on COPD data(No emphysema(0) and Minimal emphysema (1)). From the figure,it is observed that the true positive, false postitive, F-measure and accuracy improve on an average of 15-20% when preprocessed with the proposed feature selection model and ensemble classification model.
Table 2: Performance analysis of proposed model to the traditional models on No emphysema(0) and Mild emphysema (2).
| Algorithm | True Positive | False Positive | F-measure | Accuracy |
| Adaboost | 0.631 | 0.351 | 0.642 | 0.672 |
| SVM | 0.519 | 0.398 | 0.642 | 0.548 |
| FSVM | 0.629 | 0.377 | 0.682 | 0.636 |
| NaïveBayes | 0.692 | 0.332 | 0.639 | 0.728 |
| DT+LBP | 0.658 | 0.347 | 0.734 | 0.726 |
| Ensemble Model | 0.931 | 0.156 | 0.926 | 0.936 |
Table 2, describes the statistical comparison of proposed model with the traditional classification models on COPD data (No emphysema (0) and Mild emphysema (2)). From the table,it is observed that the true positive, false postitive, F-measure and accuracy improve on an average of 20-25% when preprocessed with the proposed feature selection model and ensemble classification model.
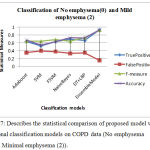 |
Figure 7: Describes the statistical comparison of proposed model with the traditional classification models on COPD data (No emphysema (0) and Minimal emphysema (2)).
|
From the figure, it is observed that the true positive, false postitive, F-measure and accuracy improve on an average of 20-25% when preprocessed with the proposed feature selection model and ensemble classification model.
Table 3: Performance analysis of proposed model to the traditional models No emphysema (0) and very severe emphysema (5).
| Algorithm | True Positive | False Positive | Accuracy |
| Adaboost | 0.624 | 0.275 | 0.663 |
| SVM | 0.639 | 0.276 | 0.652 |
| FSVM | 0.714 | 0.249 | 0.728 |
| Naïve Bayes | 0.725 | 0.238 | 0.731 |
| DT+LBP | 0.782 | 0.213 | 0.795 |
| Ensemble Model | 0.958 | 0.093 | 0.951 |
Table 3, describes the statistical comparison of proposed model with the traditional classification models on COPD data (No emphysema (0) and very severe emphysema (5)). From the table,it is observed that the true positive,false postitive, F-measure and accuracy improve on an average of 20-23% when preprocessed with the proposed feature selection model and ensemble classification model.
 |
Figure 8: Performance analysis of proposed model to the traditional models No emphysema (0) and Mild emphysema (5).
|
Figure 8, describes the statistical comparison of proposed model with the traditional classification models on COPD data (No emphysema (0) and very severe emphysema (5). From the figure, it is observed that the true positive, false postitive, F-measure and accuracy improve on an average of 20-25% when preprocessed with the proposed feature selection model and ensemble classification model.
References
- NIOSH 2014. Work-Related Lung Disease Surveillance System (eWoRLD). 2014-680 U.S. Department of Health and Human Services, Centers for Disease Control and Prevention, National Institute for Occupational Safety and Health, Respiratory Health Division, Morgantown, WV. Available at: https://wwwn.cdc.gov/eworld/Data/680 November 1, 2016.
- https://medlineplus.gov/ency/imagepages/19376.htm.
- who.int/respiratory/copd/GOLD_WR_06.pdf.
- Widmaier, E., Hershel, R. and Strang, K. T. [2011], Human physiology, McGraw – Hill.
- Bai, X. L., & Qian, X. (2008, October). Medical image classification based on fuzzy support vector machines. In Intelligent Computation Technology and Automation (ICICTA), 2008 International Conference on (Vol. 2, pp. 145-149). IEEE.
- Giritharan, B., Yuan, X., & Liu, J. (2009, February). Incremental classification learning for anomaly detection in medical images. In SPIE Medical Imaging (pp. 72603W-72603W). International Society for Optics and Photonics.
- Kim, S. H., Lee, J. H., Ko, B., & Nam, J. Y. (2010, July). X-ray image classification using random forests with local binary patterns. In 2010 International Conference on Machine Learning and Cybernetics (Vol. 6, pp. 3190-3194). IEEE.
- Selvathi, D., & Sharnitha, V. S. (2011, July). Thyroid classification and segmentation in ultrasound images using machine learning algorithms. In Signal Processing, Communication, Computing and Networking Technologies (ICSCCN), 2011 International Conference on (pp. 836-841). IEEE.
- Avramović, A., & Marović, B. (2012, September). Performance of texture descriptors in classification of medical images with outsiders in database. In Neural Network Applications in Electrical Engineering (NEUREL), 2012 11th Symposium on (pp. 209-212). IEEE.
- Subbulakshmi, C. V., Deepa, S. N., & Malathi, N. (2012, August). Extreme learning machine for two category data classification. In Advanced Communication Control and Computing Technologies (ICACCCT), 2012 IEEE International Conference on (pp. 458-461). IEEE.
- Arulmary, M., Victor, S.P. “Block based probability intensity feature extraction for automatic glaucoma detection”, (2018) International Journal of Pharmaceutical Research, 10(2), 87-93.
- K. Alham, M. Li, Y. Liu, M. Ponraj and M. Qi, “A Distributed SVM Ensemble for Image Classification and Annotation”, 9th International Conference on Fuzzy Systems and Knowledge Discovery (FSKD), IEEE, pp 1581–1584, 2012.
- G´al, E. Kerre and M. Nachtegael, “Multiple Kernel Learning Based Modality Classification for Medical Images”, IEEE Computer Society Conference on Computer Vision and Pattern Recognition Workshops, 2012.
- Giritharan, X. Yuan, J. Liu, “Incremental Classification Learning for Anomaly Detection in Medical Images”, SPIE Medical Imaging. International Society for Optics and Photonics, 2009.
- Zhang, X. Wang and W. M. Moon, “PolSAR Images Classification Through GA-Based Selective Ensemble Learning”, “International Geoscience and Remote Sensing Symposium (IGARSS), IEEE”, 2015.
- yu and Y. Xiaowei, “Application of Decision Tree for MRI Images of Premature Brain Injury Classification”, Computer Science & Education (ICCSE), 2016 11th International Conference on. IEEE, 2016.
- Sørensen, S. B. Shaker, and M. de Bruijne, Quantitative Analysis of Pulmonary Emphysema using Local Binary Patterns, IEEE Transactions on Medical Imaging 29(2): 559-569, 2010.[http://image.diku.dk/emphysema_database/].

