
Manuscript accepted on :02-Feb-19
Published online on: 05-03-2019
Plagiarism Check: Yes
Reviewed by: Alexander Berezin
Second Review by: Nihad Ali
Final Approval by: Dr. Ayush Dogra
Breetha Subramani and Bhuvaneswari Krishnamurthy
Department of Pharmacology PSG Institute of Medical Sciences and Research Peelamedu, Coimbatore – 641004, Tamilnadu, India.
Corresponding Author E-mail: breetha.sabari@gmail.com
DOI : https://dx.doi.org/10.13005/bpj/1642
Abstract
To understand the biological basis of the effect of Momordica charantia and also it’s effectiveness as a mono-therapy for metabolic syndrome. Thirty‑four adult male Sprague-Dawley rats weighing were divided into Groups I, II, III and IV having 10, 10, 8 and 6 animals respectively. Pellets with 66% fructose were fed to 28 animals [Groups I, II, III] while 6 normal control animals [Group IV] were fed with standard rat chow diet for 6 weeks. Later, for next 6 weeks, animals in Groups I, II and III were treated with M.charantia 300 mg/kg/day, and 600mg/kg/day and Standard treatment respectively. Serial measurements of body weight, BMI, fasting blood sugar, noninvasive blood pressure, serum lipid profile, LDA, SOD and serum NF-κB were assessed at the base line, at the end of 6 weeks of fructose diet and following treatment (12 weeks). Following induction, there was statistically significant increase in body weight, BMI, FBS, serum triglycerides, total cholesterol, LDL, lipid derived aldehydes and serum NF-κB while there was reduction in HDL cholesterol and SOD compared to baseline values. Following treatment Group II and III shown reversal of the parameters to the level of normalization. M. charantia 600 mg/kg/day had exclusively matched the therapeutic efficacy of the standard therapy given in combination. The biological basis of the effects of M.charantia was by inhibiting the inflammatory pathway in metabolic syndrome both at the levels of ROS generation and transcription of pro-inflammatory marker NF-κB.
Keywords
Lipid Derived Aldehydes; Metabolic Syndrome; Momordica Charantia; Serum NF-κB
Download this article as:| Copy the following to cite this article: Subramani B, Krishnamurthy B. Effects of Momordica Charantia (Bitter gourd) on Oxidative Stress and Pro-Inflammatory Marker in Metabolic Syndrome Using a High-Ffructose Diet Induced Rat Model. Biomed Pharmacol J 2019;12(1). |
| Copy the following to cite this URL: Subramani B, Krishnamurthy B. Effects of Momordica Charantia (Bitter gourd) on Oxidative Stress and Pro-Inflammatory Marker in Metabolic Syndrome Using a High-Ffructose Diet Induced Rat Model. Biomed Pharmacol J 2019;12(1). Available from: https://bit.ly/2VAzNcs |
Introduction
‘Metabolic syndrome,1 is a constellation of metabolic derangements such as, abdominal obesity, hypertension, insulin resistance, hyperinsulinemia, impaired glucose tolerance, dyslipidemia, proinflammatory and prothrombotic states as well. It is the disorder reaching epidemic proportions worldwide in recent times.2 The recently anticipated global prevalence of metabolic syndrome is approximately 16%.3 It was also found that prevalence as 23.7%4 in United States heeding to third National Health and Nutrition Examination Survey (NHANES III). The overall prevalence of cardio-metabolic syndrome in India is estimated to be ranging from 11% to 41%.5
The annual direct healthcare cost for diabetes and its associated diseases worldwide of age 20 to 79 years is estimated to be around 286 billion dollars or even more. And it is predicted that this figure would rise to 396 billion dollars by 2025 accounting 13% – 40% of global health care budget due to perpetual inflation of prevalence.6
There is no well clear cut-off point in treating metabolic syndrome, as of now, individual components are treated in addition to the risk factors of the patients and moreover, no single drug is available to treat all the individual components of the syndrome altogether. On the other hand, Momordica charantia (bitter gourd) tends to possess anti-diabetic, anti-hypertensive, hypolipidemic and anti-inflammatory properties individually as a sole agent.
With this background, our study aimed to study the effectiveness of Momordica charantia, as a mono-therapy for metabolic syndrome. In addition our study also aimed at understanding the biological basis of the effect of Momordica charantia in the treatment of metabolic syndrome.
Materials and Methods
Institutional Animal Ethics Committee (IAEC) approval was obtained, and 34 adult, male Sprague-Dawley rats weighing 150-200g aged 3 months were included in our study.
Animals were randomly allocated into 4 groups;
Group I: Treatment group 1 (M.charantia extract-300 mg/kg/day) -(10)
Group II: Treatment group 2 (M.charantia extract-600 mg/kg/day)-(10)
Group III: Standard treatment group (Metformin-180mg/kg/day + Telmisartan-2.5mg/kg/day + Rosuvastatin -2.5mg/kg/day)-(8)
Group IV: Normal control-(6).
The animals were group housed, 4 rats per cage at a constant ambient temperature on a 12 – h light, 12 – h dark cycle. Pellet diet containing 66% fructose177 made from D- fructose [purchased from Loba chemie laboratories] was given to 28 animals and standard rat chow diet to 6 controls and water were provided ad libitum out of 34 for 6 weeks. Then serial measurements of body weight, BMI, fasting blood sugar were done at the baseline and every week thereafter, whereas noninvasive blood pressure, serum lipid profile, LDA, SOD and serum NF-κB were assessed at the base line and at the end of 6 weeks (i.e., following induction). Then at the end of induction, 28 animals of 3 groups, which were fed with fructose were provided M.charantia extract-300 mg/kg/day, M.charantia extract- 600 mg/kg/day and standard treatment respectively. And those animals were provided with standard chow and water ad libitum all through the 6 weeks of treatment. Then serial measurements of all the parameters were assessed at the end of 6 weeks (i.e., following treatment). Finally, at the end of the study 2 rats from each of the groups were sacrificed for histopathological examination of liver and heart to seek for pathological changes developed during induction and magnitude of the reversal of changes following treatment [Figure 1].
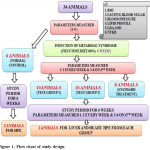 |
Figure 1: Flow chart of study design.
|
Tail cut bleeding (tail snip method)7 was the method of blood collection used in our study, BMI8 was determined from body weight and body length (nose-to-anus length) using the formula; BMI (Body mass index) = body weight (g) / length2 (cm2). We followed the method of blood glucose estimation with glucometer, according to the Institutional animal care and use committee (IACUC)9 standard procedure for glucose monitoring of blood in rats and mice. LE 5002, non-invasive blood pressure meter (Panlab-Harvard apparatus) was used for measuring the blood pressure in rats. The lipid parameters estimated using GenX lipid parameters estimation kit, manufactured by Proton Biologicals India Pvt. Ltd (Bangalore) were serum total cholesterol, triglycerides and HDL (high density lipoprotein) cholesterol. LDL cholesterol was estimated using Friedewald’s formula;10 LDL = TC – HDL – [TG/5]2. The principle behind the superoxide dismutase estimation done by us was inhibition of pyrogallol’s auto-oxidation by superoxide dismutase. Then, the superoxide dismutase levels are analyzed from the 2 absorbance values (A,B) measured at two minutes interval using spectrometric method,
Estimated malondialdehyde from the supernatant of the centrifuged samples by colorimeter,

Rat nuclear factor-kappa-B (NF-κB) assay was a quantitative sandwich enzyme immunoassay technique done by ELISA kit [Cusabio,China]. The microplate provided was pre-coated with NF-κB specific antibody. NF-κB present on the standards and samples when pipetted into the wells would bind to antibody that was immobile. After removal of the substance that were not bound, a biotin-conjugated antibody specific for NF-κB would be pipetted into the wells. Subsequently, wells were washed and addition of Horseradish Peroxidase (HRP) done. An addition of substrate solution to the wells would lead on to color development that would be in proportion to bound NF-κB, and the color intensity was measured.
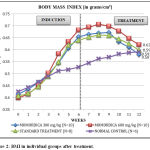 |
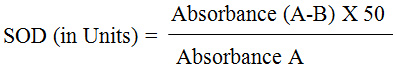
Figure 2: BMI in individual groups after treatment.
|
The animals to be sacrificed for histopathological examination were anaesthetized with ether before the procedure. Once the level of anaesthesia is certain, the rats were dissected and the organs liver and heart were collected separately in a promptly labeled sterile container with formalin. Those specimens were immediately sent for histopathological examination.
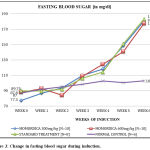 |
Figure 3: Change in fasting blood sugar during induction.
|
Paraffin blocks were made and 4m thick sections were made from the chosen blocks for routine haematoxylin and eosin staining. Reagents required for this staining were Harris haematoxylin and eosin. The analysis done was Paired-t-test for analyzing the paired data i.e., parameters before and after induction and also for comparing data at the end of treatment with that following induction. One-way ANOVA and post hoc LSD were done to analyze the difference between groups.
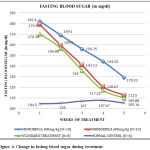 |
Figure 4: Change in fasting blood sugar during treatment.
|
Results
Body Mass Index [BMI]
An increase in BMI was evidenced after a period of 6 weeks in animals [N=28] on 66% fructose diet in comparison to the normal control animals with a mean difference of 0.132 g/cm2.
Following treatment for a period of 6 weeks, when compared with induced animals, Group I rats on M.charantia 300 mg/kg/day, Group II rats on M.charantia 600 mg/kg/day and Group III rats on Standard treatment showed a statistically significant reduction [P =0.021,P =0.001 and P=0.020 respectively] in BMI (Table 1). In contrast to all the treatment groups, the untreated normal control animals showed a statistically significant increase in BMI [P <0.001]. ANOVA (Analysis of variance) assessed at baseline there was no statistical significant difference in BMI between groups. Following induction with 66% fructose all the three groups showed a statistically significant increase in body mass index compared to normal control [P <0.001]. Further, following treatment, though all the three groups showed reduction in body mass index, there was no statistically significant difference when compared to control [P=0.441,0.064,0.651 respectively] indicating normalization of BMI.
Fasting Blood Sugar
Change in Fasting Blood Sugar in Individual Groups on Induction
All the 3 groups showed a statistically significant increase in fasting blood sugar [P <0.001] from the baseline on induction of the disease been illustrated in the chart.
The difference in fasting blood sugar between groups was analyzed using ANOVA showed that a statistically significant increase [P <0.001] in all the 3 groups when compared to normal control on induction. Following treatment, Group II and III had reduced fasting blood sugar to a level similar to normal control [P=0.250,0.457 respectively], while reduction of the fasting blood sugar by M.charantia low dose (Group I) was not to the extent of that of normal control.
While following treatment of the animals for a period of 6 weeks all the three groups [Groups I,II and III] a paired t test detected a statistically significant reduction in fasting blood sugar [P <0.001], while the normal control group did not show significant change in blood sugar [P =0.610] (Table 1).
Table 1: Illustration of body weight, body mass index, fasting blood sugar and mean arterial pressure in three different groups.
| Parameters | Groups | Pairs | Mean | SD | P |
| Body Weight | I | Baseline-Induction | -134.8 | 33.31 | <0.001 |
| Induction-Treatment | 5.81 | 16.26 | 0.288 | ||
| II | Baseline-Induction | -147.9 | 23.53 | <0.001 | |
| Induction-Treatment | 11.1 | 10.91 | 0.011 | ||
| III | Baseline-Induction | -125.8 | 11.44 | <0.001 | |
| Induction-Treatment | 0.5 | 12.14 | 0.899 | ||
| BMI | I | Baseline-Induction | -0.24 | 0.97 | <0.001 |
| Induction-Treatment | 0.07 | 0.08 | 0.021 | ||
| II | Baseline-Induction | -0.28 | 0.59 | <0.001 | |
| Induction-Treatment | 0.06 | 0.03 | <0.001 | ||
| III | Baseline-Induction | -0.23 | 0.39 | <0.001 | |
| Induction-Treatment | 0.04 | 0.05 | 0.02 | ||
| FBS | I | Baseline-Induction | -95.3 | 16.93 | <0.001 |
| Induction-Treatment | 51.37 | 18.23 | <0.001 | ||
| II | Baseline-Induction | -89.6 | 23.09 | <0.001 | |
| Induction-Treatment | 73.12 | 25.19 | <0.001 | ||
| III | Baseline-Induction | -93.25 | 18.2 | <0.001 | |
| Induction-Treatment | 73.12 | 25.19 | <0.001 | ||
| MAP | I | Baseline-Induction | -34.63 | 51.93 | 0.101 |
| Induction-Treatment | -8.41 | 60.85 | 0.707 | ||
| II | Baseline-Induction | -14.25 | 38.16 | 0.326 | |
| Induction-Treatment | 28.71 | 53.59 | 0.173 | ||
| III | Baseline-Induction | -57.5 | 41.31 | 0.006 | |
| Induction-Treatment | 49.83 | 64.57 | 0.065 |
BMI=Body mass index, FBS=Fasting blood sugar, MAP=Mean arterial pressure.
SD= Standard deviation.
The difference in fasting blood sugar between groups was analyzed using ANOVA showed that a statistically significant increase [P <0.001] in all the 3 groups when compared to normal control on induction. Following treatment, Group II and III had reduced fasting blood sugar to a level similar to normal control [P=0.250,0.457 respectively], while reduction of the fasting blood sugar by M.charantia low dose (Group I) was not to the extent of that of normal control.
Mean Arterial Pressure [MAP]
Change in MAP in Individual Groups on Treatment Following Induction
Though all the 3 groups of animals fed on 66% fructose diet showed an increase in Mean arterial pressure (MAP) from the baseline within6 weeks, the induction was not homogeneous among all the groups with maximum rise in standard treatment group [Figure-5].
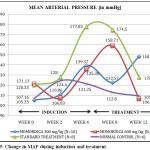 |
Figure 5: Change in MAP during induction and treatment.
|
A paired-t-test showed a statistically significant increase [P=0.006] only in the animals assigned to standard treatment group in comparison to baseline values. A paired-t-test was done to compare the difference in MAP following treatment found that the reduction though evident, was statistically significant in none of the groups [P =0.707, 0.173, 0.065] from the period of induction (Table 1).
The difference in MAP between groups was analyzed using ANOVA, at baseline and there was no statistical significant difference between groups indicating homogeneity of the animals while on induction, only Group III animals showed a statistically significant increase [P=0.002] compared to normal control. Further, on treatment, all the 3 groups of animals had demonstrated a reduction of MAP to reach the level of normal control rats.
Serum Triglycerides
Serum Triglycerides on Induction and Treatment of Metabolic Syndrome
As shown in Table 2, all the 3 groups showed a statistically significant increase in triglycerides [P <0.001] from the baseline following induction of metabolic syndrome with 66% fructose diet for a period of 6 weeks [Figure-6].
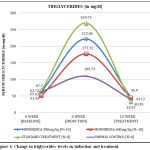 |
Figure 6: Change in triglycerides levels on induction and treatment.
|
Following treatment period for 6 weeks, all the 3 groups showed a statistically significant reduction in triglycerides [P <0.001] from the period of induction when a paired t test was used to test significance.
ANOVA (Analysis of variance) was done to assess the significant change in triglycerides levels between the 4 groups of animals. At baseline there was no statistically significant difference in triglycerides between groups indicating homogeneity of the animals. Following induction, all the three groups [Group I,II and III] showed a statistically significant increase in triglycerides compared to normal control [P =0.001,0.33,0.000 respectively]. Further, following treatment, all the three groups showed reduction in triglycerides, not statistically significant from that of control, [P=0.177,0.355,0.123 respectively] indicative of normalization of triglycerides levels.
Total Cholesterol Levels
Similar to triglycerides, total cholesterol of all the 3 groups showed a statistically significant increase [P <0.001] from the baseline following induction [Figure-7]. Compared to the normal control, Groups II and III on treatment showed a statistically significant [P=0.001] reduction in total cholesterol, while the reduction in Group I rats on M.charantia 300 mg/kg/day (low dose) failed to demonstrate statistical significance [P=0.085] (Table 2).
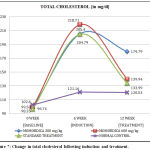 |
Figure 7: Change in total cholesterol following induction and treatment.
|
ANOVA done to evaluate the significant change in total cholesterol between groups showed a significant increase in total cholesterol [P <0.001] compared to normal control following induction and after treatment, all the 3 treatment groups showed reduction in total cholesterol, in addition to which the mean total cholesterol in Groups II and III were not statistically significant compared to normal control rats indicating normalization of cholesterol level in these groups at the end of treatment.[P=0.126, 0.282].
LDL Cholesterol Levels
Following Induction and Treatment of Metabolic Syndrome
As shown in Table 2, all the 3 groups showed a statistically significant increase in LDL [P <0.001] from the baseline following induction of metabolic syndrome with 66% fructose diet for a period of 6 weeks [Figure-8]. Following treatment period of 6 weeks, Group II and III showed a statistically significant reduction in LDL [P <0.001] from the period of induction while Group I animals did not show significant reduction in LDL [P=0.366].
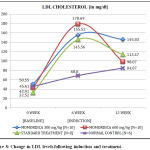 |
Figure 8: Change in LDL levels following induction and treatment.
|
ANOVA (Analysis of variance) was done to assess the significant change in LDL levels between the 4 groups of animals at three time zones namely baseline, following induction and following treatment. At baseline, there was no statistical significant difference in LDL levels between groups. Following induction all the three groups [Group I,II and III] showed a statistically significant increase in LDL levels compared to normal control [P < 0.001].
Further, following treatment, Group II and III, when compared to control showed a statistically significant reduction in LDL [P=0.476,0.130 respectively] indicative of normalization of LDL levels while Group I animals on M.charantia low dose did not show significant reduction in LDL to the level of normal control.
HDL Cholesterol Levels
Following Induction and Treatment of Metabolic Syndrome
Comparison of serum HDL levels done among all the 3 groups showed a statistically significant reduction [P <0.001] at the time of disease induction to baseline level.
A paired-t-test showed a statistically significant increase in mean HDL levels [P =0.001, 0.001, and 0.003 respectively (Table 2)] at the end of treatment when compared to the mean following the period of induction, while normal control did not show statistically significant change in HDL levels [P=0.161].
Table 2: Illustration of triglyceride, total cholesterol, low density lipoprotein and high density lipoprotein in three different groups.
| Parameters | Groups | Pairs | Mean | SD | P |
| TGL | I | Baseline-Induction | -158.35 | 89.83 | 0.002 |
| Induction-Treatment | 176.16 | 95.14 | 0.001 | ||
| II | Baseline-Induction | -125.68 | 35.45 | <0.001 | |
| Induction-Treatment | 132.99 | 29.69 | <0.001 | ||
| III | Baseline-Induction | -202.05 | 73.85 | <0.001 | |
| Induction-Treatment | 235.78 | 77.08 | <0.001 | ||
| TC | I | Baseline-Induction | -107.05 | 42.89 | 0.001 |
| Induction-Treatment | 25.61 | 32.87 | 0.085 | ||
| II | Baseline-Induction | -119.13 | 24.45 | <0.001 | |
| Induction-Treatment | 78.77 | 35.81 | 0.001 | ||
| III | Baseline-Induction | -108.05 | 10.13 | <0.001 | |
| Induction-Treatment | 70.8 | 28.12 | 0.001 | ||
| LDL | I | Baseline-Induction | -104.97 | 26.43 | <0.001 |
| Induction-Treatment | 28.98 | 78.38 | 0.366 | ||
| II | Baseline-Induction | -135.78 | 20.11 | <0.001 | |
| Induction-Treatment | 80.62 | 29.74 | <0.001 | ||
| III | Baseline-Induction | -113.04 | 13.82 | <0.001 | |
| Induction-Treatment | 32.09 | 9.38 | <0.001 | ||
| HDL | I | Baseline-Induction | 32.03 | 9.87 | <0.001 |
| Induction-Treatment | -10.84 | 3.25 | <0.001 | ||
| II | Baseline-Induction | 41.46 | 1.83 | <0.001 | |
| Induction-Treatment | -23.56 | 10.09 | <0.001 | ||
| III | Baseline-Induction | 45.85 | 4.31 | <0.001 | |
| Induction-Treatment | -2.29 | 1.8 | 0.003 |
TGL=Triglyceride, TC=Total cholesterol, LDL=Low density lipoprotein,
HDL=high density lipoprotein, SD= Standard deviation.
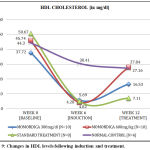 |
Figure 9: Changes in HDL levels following induction and treatment.
|
ANOVA done to evaluate the significant change in HDL levels between groups showed a significant reduction in HDL levels [P <0.001] compared to normal control following induction and after treatment, there was an increase in HDL levels all the 3 treatment groups, despite this increase the mean HDL cholesterol in Groups II was not statistically significant compared to normal control rats indicating normalization of HDL level in this group at the end of treatment [P=0.808].
Thio-Barbituric Acid Reactive Substance Levels
As shown in Table 3, a paired-t-test had shown a statistically significant increase in Thio-barbituric acid reactive substance, Malondialdehyde (MDA) in all the 3 groups [P=0.007,0.001,0.003] [Table-3] from the baseline following induction of metabolic syndrome with 66% fructose diet over a 6 weeks period [Figure-10].
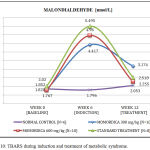 |
Figure 10: TBARS during induction and treatment of metabolic syndrome.
|
Following treatment period of 6 weeks, a paired t test was done to detect the difference between groups found that though all the three groups had reduced the TBARS levels, it was only II and III showed a statistically significant reduction of malondialdehyde levels [P=0.024, 0.001] respectively.While the group I animals on low dose M.charantia did not show significant reduction [P=0.066] in malondialdehyde in comparison to the other groups.
ANOVA done to assess the significant change in MDA levels between groups revealed a statistically significant rise in the levels of MDA [P =0.002,<0.001, <0.001 respectively] compared to normal control following induction. Following treatment, the MDA levels in all the 3 treatment groups, was not statistically significant different from that of normal controls indicating normalization of MDA level all the groups at the end of treatment [P=0.078,0.743,0.454 respectively].
Superoxide Dismutase [SOD]
SOD Following Induction and Treatment of Metabolic Syndrome
All the 3 groups showed a statistically significant reduction in SOD levels [P=0.001, 0.005, 0.000 respectively] from the baseline following induction of metabolic syndrome with 66% fructose diet [Figure-11] for a period of 6 weeks when tested using paired-t-test.
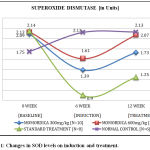 |
Figure 11: Changes in SOD levels on induction and treatment.
|
Following treatment period for 6 weeks, all the 3 groups though showed a increase in SOD levels from the period of induction, but was not of statistical significance when a paired t test was used to test the significance [P=0.087,0.107,0.214 respectively (Table 3)].
Table 3: Illustration of thio-barbituric acid reactive substance levels, super oxide dismutase and nuclear factor kappa-B in three different groups.
| Parameters | Groups | Pairs | Mean | Sd | P |
| TBARS | I | Baseline-Induction | -2.59 | 1.95 | 0.007 |
| Induction-Treatment | 1.24 | 1.62 | 0.066 | ||
| II | Baseline-Induction | -3.19 | 1.75 | 0.001 | |
| Induction-Treatment | 2.71 | 2.67 | 0.024 | ||
| III | Baseline-Induction | -3.47 | 2.14 | 0.003 | |
| Induction-Treatment | 2.98 | 1.49 | 0.001 | ||
| SOD | I | Baseline-Induction | 0.7 | 0.39 | 0.001 |
| Induction-Treatment | -0.34 | 0.48 | 0.087 | ||
| II | Baseline-Induction | 0.52 | 0.37 | 0.005 | |
| Induction-Treatment | -0.46 | 0.7 | 0.107 | ||
| III | Baseline-Induction | 1.24 | 0.45 | <0.001 | |
| Induction-Treatment | -0.35 | 0.73 | 0.214 | ||
| NFκB | I | Baseline-Induction | -8.22 | 19.3 | 0.303 |
| Induction-Treatment | 16.12 | 16.7 | 0.043 | ||
| II | Baseline-Induction | -6.95 | 15.13 | 0.27 | |
| Induction-Treatment | 22.15 | 8.76 | 0.001 | ||
| III | Baseline-Induction | -3.53 | 8.76 | 0.327 | |
| Induction-Treatment | 14.35 | 13.02 | 0.027 |
TBARS=Thio-barbituric acid reactive substance levels, SOD=Super oxide dismutase.
NFκB= Nuclear factor kappa-B, SD= Standard deviation.
When ANOVA was done to evaluate the significant change in SOD levels between groups following induction, a statistically significant reduction in SOD levels [P=0.020, 0.001, 0.000 respectively] was detected compared to that of normal control. After treatment, there was an increase in SOD levels in all the 3 treatment groups, with the increase in the mean SOD cholesterol in Groups I and II not being statistically significant compared to normal control rats indicating normalization of SOD level in this group at the end of treatment.
Nuclear Factor Kappa-B [NF-κB]
NF-κB Following Induction and Treatment of Metabolic Syndrome
The mean serum NF-κB levels of the normal control animals in our study at baseline was established as 22.033±5.657 pg/ml [Figure-12].All the 3 groups showed a increase in NF-κB levels, but not of statistical significance [P=0.303, 0.270 and 0.327 respectively] from the baseline following induction when a paired-t-test was used (Table 3).
![Figure 12: Normal serum NF-κB levels [in pg/ml] observed in our study.](https://biomedpharmajournal.org/wp-content/uploads/2019/03/Vol12No1_Eff_Bre_fig12-150x150.jpg) |
Figure 12: Normal serum NF-κB levels [in pg/ml] observed in our study.
|
In comparison to the normal control values in their individual groups, all the 3 groups showed a statistically significant reduction in serum NF-κB levels [P=0.043, 0.001 and 0.027 respectively].
ANOVA done to analyze the difference between groups had found that there was a reduced serum NF-κB levels, which is not statistically significant when compared to normal control rats indicating normalization of serum NF-κB levels in groups I and III at the end of treatment, while group III animals showed a statistically significant difference with that of normal control indicating non-achievement on normalization.
Histopathological Examination
Histopathological Changes In Liver
On comparing the liver of treated animals with that of normal control, all the 3 groups showed fatty infiltration [micro & macrovesicular steatosis]. Group II and III animals showed fatty changes of grade 2+ while the fatty liver was graded as 3+ in Group I animals treated with low dose M.charantia (Figure 13).
![Figure 13: Histopathological examination of Liver [H&E, 40X].](https://biomedpharmajournal.org/wp-content/uploads/2019/03/Vol12No1_Eff_Bre_fig13-150x150.jpg) |
Figure 13: Histopathological examination of Liver [H&E, 40X].
|
Histopathological Changes In Heart
On comparing the histopathology of heart of the treatment groups with that of normal control, it was evident that all the 3 groups showed hypertrophy of heart due to fructose diet. The grade of hypertrophy was found to be homogenous in Groups I, II and III and did not any show any changes related to reversal of the hypertrophied heart. But the fatty change that is observed in the disease control is not seen in sections of Groups I, II and III heart (Figure 14).
![Figure 14: Histopathological examination of Heart [H&E, 40X].](https://biomedpharmajournal.org/wp-content/uploads/2019/03/Vol12No1_Eff_Bre_fig14-150x150.jpg) |
Figure 14: Histopathological examination of Heart [H&E, 40X].
|
Discussion
The aim of our work was to study the biological basis of effects of Momordica charantia in metabolic syndrome by measuring serum NF-κB, lipid derived aldehydes and superoxide dismutase levels. And we also focused to identify the therapeutic advantage, of M.charantia as a sole agent in the treatment of all the entities of metabolic syndrome with respect to available standard treatment, by ascertaining the changes in body mass index, fasting blood sugar, lipid profile and blood pressure.
Body mass index showed a statistically significant [P <0.001] increase in all the groups of animals after an induction period and also in the control animals compared to baseline values. The increase in BMI noted in normal control can be explained as due to the linear growth that is normally observed.11 Following treatment, all the treated groups of animals showed a statistically significant reduction. Inspite of not achieving statistical significance in body weight reduction in the Groups I and III, BMI showed a significant reduction and this disparity can be accounted by the fact that the length and the thoracic circumference would become static at around 4-5 months and thus, signifying the advantage of BMI over body weight, as diet induced obesity could be easily estimated from the BMI in rats in addition to being a predictor of dyslipidemia and oxidative stress.12
Fasting blood sugar was estimated every week for a period of 12 weeks showed a statistically significant increase in all the groups [P <0.001] from the baseline to induction. It is well established that the enzyme fructokinase, would phosphorylate the surplus fructose absorbed from the intestine. And also, the metabolism pertaining to fructose is not similar to that of glucose, the difference being fructose-1-phosphate that is formed from fructose would be converted to several 3-carbon molecules, like glyceraldehyde, glyceraldehyde-3-phosphate and dihydroxyacetone phosphate and they are considered as the potential source for gluconeogenesis, and thereby raise blood glucose levels.13
Following treatment all the three groups [Groups I,II and III] showed a statistically significant reduction in fasting blood sugar. A study which was done earlier to analyze the anti-diabetic effect of M.charantia with reference to glibenclamide found that all the doses used in the study from lower to higher doses [250 mg/kg, 500 mg/kg, 750 mg/kg] showed a statistical significant reduction in blood sugar similar to that resulted from our study.14
On comparison of the mean of treated groups to normal age control at the end of treatment, it was evident that, though M.charantia low dose had reduced the blood sugar significantly but not to the extent of normalization. The probable reason for this could be due to shorter duration of treatment. There are numerous studies demonstrating hypoglycemic activity of M.charantia, apart from the observation that the active component being structurally similar to insulin. Accordingly, it is also shown to exhibit insulin secretagogue action with additional activity of inhibiting two key gluconeogenic enzymes fructose 1, 6-diphosphatase and glucose-6-phosphatase.15,16
Our study animals though have demonstrated an increase in Mean arterial pressure in response to high fructose diet, the rise was not identical in all the groups of animals and there was inter and intra group variation with statistically significant [P=0.006] rise in animals grouped for standard therapy (Group III). Though studies had demonstrated the induction of hypertension by fructose diet, contradictorily, there are also studies demonstrating inconsistent elevation of blood pressure.17,18 A study done in male Sprague-Dawley rats with high fructose diet showed a demonstrable rise in systolic blood pressure but not mean arterial pressure (MAP) which was rationalized by the variability between animals and also the scale of metabolic dysfunction not being sufficient to defer an effect on blood pressure.17 The probable reason for the increased MAP response in Group III rats unlike the other groups in our study, would have been due to the associated rise in serum triglycerides. Similar observation was also made in a previous study.19
Subsequently after the treatment period of 6 weeks, all the 3 groups of animals [groups I, II and III] showed a reduction in mean arterial pressure from the period of induction though not statistically significant.
When the difference between groups were analyzed at the end of treatment, a constructive finding illustrated in our study was that groups on high dose M.charantia and standard therapy showed a reduction in MAP to the level of normalization, while low dose M.charantia in contrast showed a rise in blood pressure following a fall indicative of its inconsistency in treating hypertension.
There exists an analogous pattern of MAP changes in the groups II and III in the line chart indicating a potentially similar mechanism of BP lowering by M.charantia and telmisartan. This could be explained by a recent study signifying the existence of a peptide named VY-7 in M.charantia that possesses antihypertensive property by inhibiting angiotensin converting enzyme20 and in turn reducing aldosterone production. In addition, naturally, it has high potassium content and both could be contributory to increased natriuresis and thereby a fall in blood pressure. Telmisartan, an angiotensin receptor antagonist, also acts similarly by reducing aldosterone production. Yet, another homology that exists between telmisartan and M.charantia is that both possess PPAR γ agonistic activity.
Our study evinced a statistically significant increase in triglyceride levels at induction of metabolic syndrome as consistent with another study.21 It had been documented earlier with studies that mechanism of fructose induced gluconeogenesis and hypertriglyceridemia were interlinked. The analogy that exists is that 3 carbon molecules formed from fructose-1-phosphate could be utilized eventually in the formation of fatty acids and glycerol, which on esterification would form triglycerides. There could be few other mechanistic contributions, for instance, either up regulation of lipogenic pathway or down regulation of PPAR-α activity involved in catabolism of triglycerides.21
Subsequently after treatment, all the 3 groups showed a statistically significant reduction in triglycerides, it was evident that, M.charantia low, high doses and standard treatment had reduced the triglycerides to the extent of normalization. Yet, another study evaluating the hypolipidemic effects of M.charantia showed a similar reduction including low dose of 300 mg/kg as with our study.22 The milieu of reduction in triglyceride levels caused by bitter melon was due to increased expression of PPAR-α activity in the liver. As a sequel of increased activity of PPAR-α, the key receptor in down regulation of apolipoprotein C-III involved in hydrolysis of triglycerides by lipoprotein lipase (LPL) contributed to the lipid-lowering effect of M.charantia.23
All the 3 groups of animals included in our study had attained a statistically significant increase in total cholesterol levels following induction same as that observed in previous studies with high fructose diet induction.24 The reason behind the elevation of total serum cholesterol level by fructose as a retort to the increased weight and insulin resistance which would lead on to activation of the enzymes HMG CoA reductase and fatty acid synthase along with increased expression of hepatic sterol response element binding protein (SREBP).25
Compared to the normal control, group II and group III animals on showed a statistically significant reduction in total cholesterol, and further the results of a study done on off springs of rats fed with 66% fructose diet showed that bitter melon had significantly reduced the total cholesterol as seen with our study.26 On comparing the groups with that of normal animals at the end of treatment period revealed the reversal of serum cholesterol level to the degree of normality in those animals on high dose M.charantia and standard treatment. The probable mechanism as demonstrated by an earlier study is inhibition of the bile acid reabsorption, thereby leading on to increased elimination of bile acids in feces. In addition, it is also known to regulate cholesterol 7α-hydroxylase (CYP7A1) by increasing the level of hepatic CYP7A1 mRNA expression contributing to increased conversion of cholesterol to bile acids.27
This study also elucidated a statistically significant increase in LDL levels in all the 3 groups from the baseline, and a similar effect was produced earlier in another study. The perception behind the occurrence of increased LDL with fructose is that at large amounts it would undergo glycation rather than fructation, which is considered to be detrimental to the cellular proteins by the production advanced glycation end products (AGEs),28 thereby furnishing oxidative damage. Once the LDL is glycated, they are poorly recognized by the lipoproteins and scavenging receptors, which consequentially leads on to increased LDL levels.29
After treatment, Group II and Group III animals showed a statistically significant reduction in LDL from the period of induction to normalization. This action of M.charantia could be justified by its antiglycating activity proven by a study that demonstrated the percentage inhibition of AGE as 40% at 1 mg/ml concentration by AGE fluorescence.30 Furthermore, Momordin (charantin), the active component of bitter melon, by promoting PPARδ activity decreases LDL, with subsidiary action of decreased primary lipoprotein of LDL apolipoprotein B (Apo B) production, and apolipoprotein C- III expression on VLDL.31
Comparison of serum HDL levels among all the groups at induction, showed a statistically significant reduction and this result was homogenous to that of former studies.32 It has been well entrenched by studies that caveolins are found to be involved in the export of bile salts from the liver, and there exists a concordant relationship between exportation of bile salts and HDL levels i.e., any reduction or increment in the earlier would lead on to reduction or increase of the HDL levels respectively. Based on this mechanism, ingestion of high fructose diet would lower the HDL levels by reducing the bile salt export.33
Following treatment, all the 3 groups showed a statistically significant increase as observed in earlier study.34 Revealed that the restoration of serum HDL level to the degree of normality in those animals on high dose M.charantia only. In adipocytes, the enzyme lipoprotein lipase was responsible for both release of fatty acid and conversion of VLDL to cholesterol-rich LDL. Normally, macrophages embedded in the vessel wall would take up VLDL and ox-LDL actively and excess cholesterol would then be fluxed out through the HDL pathway. As demonstrated by studies that the balance between lipid influx and efflux is carried out by PPAR-γ in humans and PPAR-δ in lower animals. Any agent with the PPAR agonistic activity would increase HDL levels by decreasing LDL and M.charantia is one such agent with PPAR-δ agonistic activity thus reducing HDL levels.31
The estimated levels of thiobarbituric acid reactive substance malondialdehyde (MDA) showed a statistically significant rise. It was well recognized by studies that the animals fed on high fructose diet were known to produce remarkable changes in serum triglyceride levels, which in turn would increase the activity of fatty-acyl-coA oxidase leading on to β-oxidation. Further, excess usage of non-esterified fatty acid (NEFA) for β-oxidation would lead on to the down-regulation of malonyl-CoA, and the reduced NEFA transport via CPT-1 across mitochondria thereby increasing oxidation at endoplasmic reticulum and peroxisomes. In addition, oxidation of organelles in the cytoplasm releases ROS, which when formed in excess, damages the mitochondrial membrane rich in polyunsaturated fat thus serving as a source for lipid peroxidation derived aldehydes. However, the process does not terminate there, as those systemically released MDA would inhibit the defensive anti-oxidant enzymes SOD and catalase.35
Following treatment Groups II and III showed a statistically significant decrease in lipid derived aldehydes. Analysis done to scale the difference between groups revealed no statistically significant difference between the treated groups and normal control indicating the normalization of lipid peroxidation. Ours is the first study to demonstrate the effect of M.charantia on Lipid derived aldehydes in metabolic syndrome model even though the mechanism contributing to the effect has been studied.
Superoxide dismutase estimation done in our study revealed a statistically significant decline in their levels during the span of induction with fructose. It was recognized that ROS plays a key role in regulating various cellular functions but at higher concentration are responsible for disruption of structural integrity of cells and thereby damage the proteins, DNA and lipid. Any condition that disrupts this balance could lead on to oxidative stress by causing profound reduction in the enzyme superoxide dismutase, one such state is hyperglycemia induced by high fructose diet.36
The subsequent determination of enzyme levels following the treatment period though endowed ascend in their serum levels did not achieve statistical significance when compared to the values at induction. When we analyzed the difference in mean superoxide dismutase levels between the treated and age control rats, there was no statistically significant difference indicative of its acceleration towards normal with both the doses of M.charantia. While the standard therapy did not favorably usher the free radical scavenger, superoxide dismutase towards the expected magnitude, the reason could be credibly due to the mean reduction in their level was huge at the time of induction with respect to other two groups.
In our study, serum NF-KB levels were estimated using ELISA kit at the baseline (0 week), on induction (6 week) and following treatment (12 week). Though there are studies on tissue expression of NF-κB, subsequent to infections, inflammation and malignancies, there is only sparse literature available on serum levels of NF-κB till date. A study done in rats with mucositis on inflammatory markers including serum NF-κB found that there is difference between groups at baseline as in concordance with our study.[37] The mean serum level at baseline was established as 22.033±5.657 pg/ml in our study. All the 3 groups of animals showed an increase in the levels from that of baseline but were not to the level of significance.
Following treatment all the 3 groups of animals revealed a statistically significant reduction in serum NF-κB levels [P=0.043, 0.001, 0.027]. As of now, there are only 3 studies done with the objective of establishing the role of M.charantia on pro-inflammatory marker NF-κB, one being the work done to demonstrate the inhibitory activity of M.charantia as one of the tested compounds on NF-κB transcriptional activation in HepG2 cells (human hepato-carcinoma) in Dulbecco’s modified Eagle’s medium had proven its inhibitory effect.[38] Another was an m-RNA study on heart tissue of the obese Zucker rats demonstrated that down-regulation of nuclear factor-κB (NF-κB), and interferon-γ by M.charantia.39 The third being an electrophoretic mobility shift assay with the ethanol extracts and the hot aqueous extracts of M.charantia showing inhibition of NF-κB activation.40 But so far no research is done to assess the effect of M.charantia extract in vivo on serum NF-κB levels.
The histopathological examination of the liver and heart was done in our study. Due to liability of ethical concern, we have taken the pictures of diseased liver and heart in response to fructose intake from standard research articles. In comparison to normal control all the liver showed fatty infiltration, both microvesicular and macrovesicular steatosis that was in ordinance to high fructose diet as apparent in prior studies. In addition, the changes in histopathology of the liver and heart by M.charantia unlike that of pancreas, has not been studied in literature till date.
In distinction, the fatty change that was observed in these groups in comparison to the diseased picture revealed a significantly minimal change. There also exists a difference in fatty changes among groups, HPE of liver of Group I showed maximum change of grade 3+ while that of Groups II and III were presented with only grade 2+ changes.
So far there are no studies dealt on the role of M.charantia on the fatty changes precipitated on consumption of the fructose. So ours is the first work done to learn the changes, and we obtained an affirmative result that the changes in both M.charantia high dose and standard treatment groups were homogenous and the fatty change in these groups were of a lower degree in comparison to the low dose M.charantia group.
In comparison to normal control all the heart HPE sections showed hypertrophy that was in accordance to previous studies with reference to high fructose diet.
The cardiac hypertrophy was highly evident but observations made in these 3 groups were homogenous with no difference among them. The reason for this could duly be explained by the relatively brief span of treatment was not sufficient to bring about the scale of expected changes in the hypertrophied myocytes. But the positive finding illustrated was that the fatty change observed in the picture of disease control was not evident in the HPE sections of all three groups of treated animals. So, further studies pertaining to this could be done in future to assess the effect of Momordica on progression of cardiac hypertrophy.
Conclusion
High fructose diet (66%)was affirmatively found to be the animal model appropriate for inducing metabolic syndrome to study the effect of drugs as the model effectively reproduced all the metabolic changes [BMI,FBS,BP, Lipid parameters]seen in the syndrome. We included two different doses of M.charantia, of which 600mg/kg/day had exclusively matched the therapeutic efficacy of the standard therapy given in combination. M.charantia’s efficacy in a chronic inflammatory disease like metabolic syndrome is successfully demonstrated in our study with respect to reduction of inflammation and oxidative stress evidenced by a decline in serum NF-κB and LDA along with increased free radical scavenger, SOD. The biological basis of the effects of M.charantia by inhibiting the inflammatory pathway in metabolic syndrome both at the levels of ROS generation and transcription of pro-inflammatory marker NF-κB was proven. The histopathological examination findings has imparted that metabolic syndrome is a multi-organ inflammatory disease condition inducing detectable pathological changes in various organs like liver and heart and that M.charantia is a potentially effective agent to reverse such significant changes.
References
- Reaven G. M. Banting, Role of insulin resistance in human disease. Diabetes. 1988;37:1595-607.
CrossRef - Organization WHO: Definition, diagnosis and classification of diabetes mellitus and its complications. Report of a WHO consultation. Part 1: Diagnosis and classification of diabetes mellitus. Edited by: WHO. World Health Organization. 1999;1-28.
- Wild S. H., Roglic G., Green A., Sicree R., King H. Global prevalence of diabetes: estimates for the year 2000 and projections for 2030 – Response to Rathman and Giani. Diabetes Care. 2004;27:2569.
CrossRef - Thaman R. G., Arora. Metabolic Syndrome: definition And Pathophysiology -the Discussion Goes On!. J PhyPharm,Adv. 2013;3(13):48-56.
- Prasad D. S., Kabir Z., Dash A. K., Das B. C. Prevalence and risk factors for metabolic syndrome in Asian Indians: A community study from urban Eastern India. J Cardio vasc Dis Res. 2012;3(3):204-11.
CrossRef - Diabetes Atlas, second edition, International Diabetes Federation. 2003.
- Parasuraman S., Raveendran R., Kesavan R. Blood sample collection in small laboratory animals. Journal of Pharmacology & Pharmacotherapeutics. 2010;1(2):87-93.
CrossRef - Novelli E. L. B., Diniz Y. S., Galhardi C. M., Ebaid G. M. X.,Rodrigues H. G.,Mani F et al., Anthropometrical parameters and markers of obesity in rats. Lab. Anim. 2007;41:111-19.
CrossRef - Institutional animal care and use committee (IACUC)standard procedure Glucose Monitoring of Blood in Rats and Mice.
- Nigam K. P. Calculated Low Density Lipoprotein-Cholesterol: Friedewald’s Formula versus Other Modified Formulas. International Journal of Life Science and Medical Research. 2014;4(2):25-31.
CrossRef - Kanarek R and Orthen-Gambil N. Differentional effects of sucrose, fructose and glucose on carbohydrate-indused obesity in rats. JN The Journal of Nutrition. 1982;112:1546-54.
CrossRef - Novelli E. L. B.,Diniz Y. S., Galhardi C. M., Ebaid G. M. X., Rodrigues H. G.,Mani F.,Fernandes A. A H., Cicogna J. L. V. B. A. C. Novelli Filho. Anthropometrical parameters and markers of obesity in rats. Laboratory Animals. 2007;41:111-19.
CrossRef - Rutledge C. A., Adeli K. Fructose and the Metabolic Syndrome: Pathophysiology and Molecular Mechanisms.Nutrition Reviews. 2007;65(6):13-23.
CrossRef - Hossain M. A.,Mostofa M.,Debnath D., Alam A. K. M. R.,Yasmin Z.,Moitry N. F. Antihyperglycemic and Antihyperlipidemic of Karala (Momordicacharantia) Fruits in Streptozotocin Induced Diabetic Rats. J.Environ.Sci.&Natural Resources. 2012;5(1):29-37.
CrossRef - Platel K.,Srinivasan K. Effect of dietary intake of freeze-dried bitter gourd (Momordicacharantia) in streptozotocin induced diabetic rats. Nahrung. 1997;39:262-68.
CrossRef - Day C., Cartwright T., Provost J., Bailey C. J. Hypoglycaemic effects of Momordicacharantia extract. Planta Med. 1990;56:426-429.
CrossRef - Angelo D., Elmarakby A. A., Pollock M. D., Stepp W. D. Fructose Feeding Increases Insulin Resistance but Not Blood Pressure in Sprague-Dawley Rats Gerard.Hypertension. 2005;46:806-11.
CrossRef - Bezerra R. M. N.,Ueno M.,Silva M. S.,Tavares D. Q., Carvalho C. R. O., Saad M. J. A., Gontijo J. A. R. A high-fructose diet induces insulin resistance but not blood pressure changes in normotensive rats. Braz J Med Biol Res. 2001;34(9):1155-60.
CrossRef - Ackerman Z., MorOron-Herman.,Rosenthal T. M. G., Pappo O., Link G., Ben-Ami S. Fructose-Induced Fatty Liver Disease Hepatic Effects of Blood Pressure and Plasma Triglyceride Reduction. Hypertension. 2005;45:1012-18.
CrossRef - Priyanto A. D.,Doerksen R. J.,Chang C. I., Sung W. C., Widjanarko S. B., Kusnadi J., Lin Y. C., Wang T. C., Hsu J. L. Screening, discovery and characterization of angiotensin-I converting enzyme inhibitory peptides derived from proteolytichydrolysate of bitter melon seed proteins. J Proteomics. 2015;128:424-35.
CrossRef - Darwish A. S.,Aziem E. A.T.,El Din M.N. N.,Zied A. A.,Toussoun N. Fructose induced metabolic syndrome in rats, a role for glitazones, fibrates and statins. Bull. Alex. Fac. Med. 2006;42(4).
- Mohammady I., Elattar S., Mohammed S.,Ewais M. An Evaluation of Anti-Diabetic and Anti-Lipidemic Properties of Momordicacharantia (Bitter Melon) Fruit Extract in Experimentally Induced Diabetes. Life Science Journal. 2012;9(2):363-74.
- Chih-hao L., Olson P., Evans M. R. Minireview: Lipid Metabolism, Metabolic Diseases and Peroxisome Proliferator-Activated Receptors Endocrinology. 2003;144(6):2201–07.
- da Silva J. R.,Bernardes N.,de Brito O. J.,Sanches C. I.,Irigoyen C. M.,De Angelis K. Simvastatin-induced cardiac autonomic control improvement in fructose-fed female rats.Clinics 2011;66(10):1793-96.
- Al-Rasheed N.,Al-Rasheed N.,Bassiouni Y.,Fadaah L., Mohamad M. A. Potential Protective Effects of Nigella Sativa and Allium Sativum Against Fructose-Induced Metabolic Syndrome in Rats.Journal of Oleo Science. 2014;63(8):839-48.
CrossRef - Nerurkar P. V., Lee Y. K., Motosue M.,Adeli K and Nerurkar V. R. Momordicacharantia(bitter melon) reduces plasma apolipoprotein B-100 and increases hepatic insulin receptor substrate and phosphoinositide-3 kinase interactions. British Journal of Nutrition. 2008;100(4):751-59.
CrossRef - Matsui S., Yamane T., Takita T., Oishi Y.,Kobayashi K. The Nhypocholesterolemic activity of Momordicacharantia fruit is mediated by the altered cholesterol- and bile acid-regulating gene expression in rat liver. Nutr Res. 2013;33(7):580-5.
CrossRef - Brownlee M., Cerami A., Vlassara H. Advanced glycosylation end products in tissue and the biochemical basis of diabetic complications. N Engl J Med. 1988;318:1315-21.
CrossRef - Zimmermann R., Panzenböck U., Wintersperger A., et al. Lipoprotein lipase mediates the uptake of glycated LDL in fibroblasts, endothelial cells, and macrophages. Diabetes. 2001;50:1643-53.
CrossRef - Saraswat M.,Reddy Y., Muthenna. Bhanuprakash Reddy. Prevention of non-enzymicglycation of proteins by dietary agents: prospects for alleviating diabetic complications. British Journal of Nutrition. 2009;101:1714-21.
CrossRef - Kumar S., VamshiSharathnath K.,Yogeswaran P., Harani A.,Sudhakar K., Sudha P., Banji A. D. Medicinal potency of momordicacharantia. International Journal of Pharmaceutical Sciences Review and Research. 2010;1(2):95-100.
- H. F. Modulation of metabolic and cardiac dysfunctions by swimming in overweight rats on a high cholesterol and fructose diet: Possible role of adiponectin. Journal of physiology and pharmacolog.y 2013;64(2):231-40.
- Seneff S.,Wainwright G., Mascitelli L. Is the metabolic syndrome caused by a high fructose and relatively low fat, low cholesterol diet?Arch Med Sci. 2011;7(1):8-20.
CrossRef - Chaturvedi P. Role of Momordicacharantia in maintaining the normal levels of lipids and glucose in diabetic rats fed a high-fat and low-carbohydrate diet.Br J Biomed Sci. 2005;62(3):124-6.
CrossRef - Botezelli D. J., Cambri T. L.,Ghezzi C. A.,Dalia A. R.,Voltarelli A. F.,de Mello R. A. M. Fructose-rich diet leads to reduced aerobic capacity and to liver injury in rats Lipids in Health and Disease. 2012; 11(78):1-9.
CrossRef - Young-Hee P.,Kyung-Won L. Preventive Effect of Monascus -Fermented Products Enriched with Ubiquinones on Type 2 Diabetic Rats Induced by a High-Fructose Plus High-Fat Diet. J Med Food. 2014;17(7):826–829.
CrossRef - Logan M. R., Stringer M. A., Bowen M. J., Gibson J. R.,Sonisand T. S.,Keefe M. K. D. Serum levels of NFκB and pro-inflammatory cytokines following administration of mucotoxic drugs. Cancer Biology & Therapy. 2008;7(7):1139-45.
CrossRef - XuanNhiem N., et al Inhibition of Nuclear Transcription Factor-jBand Activation of Peroxisome Proliferator-Activated Receptors in HepG2 CellsbyCucurbitane-Type Triterpene Glycosides from Momordicacharantia. J Med Food. 2012;15(4):369–377.
CrossRef - Gadang V et al., Dietary bitter melon seed increases peroxisome proliferator-activated receptor-γ gene expression in adipose tissue, down-regulates the nuclear factor-κB expression, and alleviates the symptoms associated with metabolic syndrome. J Med Food. 2011;14(1-2):86-93.
CrossRef - Lii C. K et al., Suppressive effects of wild bitter gourd (Momordicacharantia Linn. var. abbreviata ser.) fruit extracts on inflammatory responses in RAW264.7 macrophages. J Ethnopharmacol. 2009;122(2):227-33.
CrossRef

