
Manuscript accepted on :24-Aug-2018
Published online on: 19-09-2018
Plagiarism Check: Yes
Reviewed by: Luca Mazzoni
Second Review by: Heri Septya Kusuma
Final Approval by: Dr. Beatrice O. Ondondo
Adi Parwata1 , Laksmiwati1, Sudiarta1, Dina M. N1 and Sutirta Yasa2
1Department of Chemistry, Faculty Mathematics and Natural Science.
2Fakulty of Medical Udayana University, Denpasar, Bali Indonesia.
Correspondent Author E-mail: m.andita@yahoo.co.id
DOI : https://dx.doi.org/10.13005/bpj/1521
Abstract
Phenols and flavonoids compounds in their activities as antioxidants can reduce blood glucose levels (hypoglycemic) through a mechanism to inhibit cell damage at pancreatic Langerhans gland, inhibit glucose absorption in the intestine and cell resistance to insulin. Preliminary analysis shows that total phenol and flavonoid contens is 2099,5025 mg GAE / 100 g, and 8133,322 mg QE / 100 gram, Antioxidant capacity with IC50 = 12.58 mg / mL. LD50 = 6,355,3536 gram. This results revealad that the water extract of Gyrinops versteegii leaves can be developed as an alternative to natural antioxidant, safe for consumption and can reduce blood glucose in hyperglycemic Wistar rats. The results of the measurement of the effect of decreasing blood glucose content showed that the water extract of Gyrinops versteegii leaves at doses of 100, 200 and 400 mg / kgBW significantly (p <0.01) could reduce blood glucose contents in hyperglycemic Wistar rats. The activity of reducing blood glucose levels (hypoglycemic) with oral doses of water extract of Gyrinops versteegii leaves was 100,200 and 400 mg / kgBW was 53.6% (53.6 ± 5.8), 58.9% (58.9 ± 8.6 ) and 75.8% (75.8 ± 1.3). High contents of phenol and flavonoids allegedly a factor that causes water extract of Gyrinops versteegii leaves to reduce blood glucose levels in hyperglycemic Wistar rats.
Keywords
Flavonoids Allegedly; Gyrinops Versteegii; Hyperglycemic
Download this article as:| Copy the following to cite this article: Parwata A, Laksmiwati L, Sudiarta S, Dina M. N, Yasa S. The Contents of Phenol and Flavonoid Compounds in Water Extract of Gyrinops Versteegii Leaves Have Potentially as Natural Antioxidants and Hypoglicemic in Hyperglycemic Wistar Rats. Biomed Pharmacol J 2018;11(3). |
| Copy the following to cite this URL: Parwata A, Laksmiwati L, Sudiarta S, Dina M. N, Yasa S. The Contents of Phenol and Flavonoid Compounds in Water Extract of Gyrinops Versteegii Leaves Have Potentially as Natural Antioxidants and Hypoglicemic in Hyperglycemic Wistar Rats. Biomed Pharmacol J 2018;11(3). Available from: http://biomedpharmajournal.org/?p=22752 |
Introduction
Phenolic compounds such as flavonoids are antioxidant compounds through direct arrest mechanisms, giving one of the hydrogen atoms to free radicals, chelating metal catalysts and protecting endogenous antioxidants radical reactions that endanger health will not continue. Free radical balance with endogenous antioxidants in the body can prevent oxidative stress that can cause degenerative diseases such as cancer and Diabetes Mellitus. (Wong S.P., et.al., 2006 and Adi Parwata, 2016). The content of phenol and flavonoid compounds and very strong antioxidant activity in medicinal plant extracts can inhibit cell damage at pan creas because flavonoids can neutralize free radicals. Flavonoids also inhibit glucose absorption in the intestine and cell resistance to insulin. Flavonoids can also stimulate insulin production (Jack, 2012 and Ramaiah, 2013)
The in vivo preliminary test showed that water extracts of Gyrinops versteegii leaves with doses of 50, 100 and 200 mg / kgBW in Wistar rats that experienced oxidative stress were significantly (p <0.05) lowering MDA levels with a mean of 6.37 ± 0, 23.5.56 ± 0.27 and 4.32 ± 0.27 U / mL. This dose is also able to increase the activity of the enzyme Superoxide Dismutase (SOD) with a mean of 12.15 ± 1.04, 15.70 ± 2.02, and 18.84 ± 1.51 and Catalase (CAT) enzymes with a mean of 6.68 ± 0.63; 8.20 ±1.14 and 9.29 ± 0.79 U / mL. (Adi Parwata, 2016).
Referring the use as a medicinal plant and strong antioxidant activity in vivo test in Wistar rats with maximum activity, water extract of Gyrinop versteegii leaves potentially to be developed as hypoglycemic activity in hyperglicemic Wistar rats (Ramaiah, 2013).
Materials and Methods
Material
Gyrinops versteegii leaves, Alloxan GR, methanol GR (E Merck), CMC-Na and Whatmann Filter Paper No.4 (E Merck), Mg crystal GR (E Merck), HCl GR (E Merck). Quercetin, Gallic Acid.
Instrument
UV-Visible double beam (Varian), analytic Digital Balance (Ohaus), Brand Memmert oven, (Colom 18), rotary vacuum evaporator Brand Buchii, Vortex, sonde and Glucometer.
Preparation Extract
Samples of leaves that have been dried with air at room temperature (300C) are made in powder form with a size of approximately 40 mesh then extracted. Maceration of Gyrinops versteegii leaves powder (simplicia) followed prosedure or Harborn (1996), Biswas R. et.al.(2005) and Ashafa (2010). Gyrinops versteegii leaves powder with 40 mesh fineness and <10% water content macerated with warm distilled water (70-80oC) for 24-48 hours. The extracts were filtered and the filtrate was evaporated to dryness using a rotary evaporator and then freeze dried. Condensed extract water collected is weighed and stored at a temperature of -200C. This extract is used for test or further analysis.
Determination Total Phenol
Total phenol contents in the herbal extracts water of Gyrinops versteegii leaves were determined by the modified Folin-Ciocalteu method (Wolfe et al., 2003 and Almey, 2010). An aliquot of the extract was mixed with 5 ml Folin-Ciocalteu reagent (previously diluted with water 1:10 v/v) and 4 ml (75 g/l) of sodium carbonate. The tubes were vortexed for 10- 15 minutes and allowed to stand for 90 minutes at room temperature for colour development. Absorbance was read at 760 or 765 nm using a spectrophotometer. Extracts were evaluated at a final concentration of 1 mg/ml. Total phenolic content was expressed as mg gallic acid equivalent/100 gram sample, using the equation obtained from a calibration curve of gallic acid or mg GAE /100 gram samples.
Determination Total Flavonoid
Total flavonoids were estimated using the method of Chang and Wen (2002), Ashafa (2010) and Ordon-ez et al. (2006). Half a ml of 2% AlCl3 ethanolic solution was added to 0.5 ml of the extracts in 10 mL volumetric flask. After one hour at room temperature for 25 minutes, the absorbance was read at 415/420 nm. The development of yellow colour was taking as indication of the presence of flavonoids. Total flavonoid content was calculated as quercetin equivalent (mg/g) using the equation Y= ax +b obtained from the calibration curve or mg QE/ 100 gram sample.
Determination Antioxidant Capacity
Antioxidant Capacity Analysis followed procedure Almey (2010). The analysis begins with making of a standard solution of gallic acid 0-100 mg/L. Weighed 0.1 grams each extract, then diluted with methanol to a volume of 5 mL flask and then in the vortex so that a homogeneous solution. This homogeneous solution is centrifuged at 3000 rpm for 15 minutes . Each solution has been pipetted 0.5 mL of this homogeneous, then add 3.5 ml of 0.1 mM DPPH in methanol at a test tube and then in the vortex. This solution was incubated at 250C for 30 minutes so DPPH reacts with the sample. Each solution was measured absorbance at λ max = 517 nm. Antioxidant capacity was calculated using linear regression equation Y = ax + b. Antioxidant capacity can be seen from the results % peredamannya and IC50. IC50 value is the value which is the concentration of test samples that provides damping DPPH oxidation by 50 %. IC50 value can be calculated from the linear regression equation y =ax+b) . Some of the extract concentration was measured percent of inhibition and included in the calibration curve . Extract concentration (ppm) as absis (x), while % inhibition as coordinates (y). The calculation result y = 50 included in the equation in order to obtain the value of x as the IC50 value of each sample. Contens of antioxidants can be seen from the IC50. IC50 < 50 ppm is said to be very powerful antioxidant , said to be strong IC50 50-100 ppm , said moderate is IC50 100-150 ppm and IC50 was > 151 is said to be weak as antioxidants.
Hypoglycemic Analysis
Hypoglycemic analysis followed the procedure Szkuldelski (2001) and Nandhagopal (2013). Analysis of decreased blood glucose in rats (hypoglycemic) begins with the manufacture of hyperglycemic rats with Aloxane induction at a dose of 100-125 mg / kg BW. A total of 25 Wistar rats were adapted for 2 weeks. Wistar rats that have undergone this adaptation measured their blood glucose levels (day 0). Furthermore, alloxane induced at a dose of 100-125 mg / kg BW. On the 3rd day, these rats measured their blood glucose levels. After all were said to be hyperglycemic (fasting blood glucose levels exceeded 135 mg / dL or approximately 140 mg / dL (Carvalho, 2003, Lansen,2008 and Manjusha, 2011).Normal blood glucose levels in fasting rats are 50-135mg / dL (Carvalho, 2003). An 25 of these rats were divided into 5 groups of 5 rats. Then each group is given treatment. Group I was not given the water extract of Gyrinops versteegii leaves (negative control), Group II, III and IV were given water extract of Gyrinops versteegii leaves respectively with doses of 100, 200 and 400 mg / kg BB (Reagen Shaw, 2007). Group IV is given Glibenclamide drug (positive control). Blood glucose measurements were carried out on days : 0,3,7 and 14. Day 0 was a measurement of blood glucose at the time before Aloksan was induced. Day 3 is 3 days after induced alloxane (hyperglycemic). Day 7 and 14 after being treated with oral of water extract of Gyrinops versteegii leaves. Blood glucose levels were measured using an easy touch glucometer (Gluko Dr. test). A drop of blood from the tip of the mouse’s tail is dripped on the glucometer strip, wait 10 seconds to read the value or number on the device. The value stated on the tool is the value of blood glucose levels in units of mg / dL (Ramaiah et.al, 2013).
Result and Discussion
Result
Preparation Extract
The preparation of the extract begins with the measurement of the water content simplicia of Gyrinops versteegii leaves. Water content of powder Gyrinops versteegii leaves is 5.98% w/ (8,5805±0,0097) as explained in table 1:
Table 1: Water contents of simplicia.
| Code | Initial sample weight (g) | Final sample weight (g) | Water content (%) |
| A | 1,16990 | 1,06942 | 8,588768 |
| B | 1,46302 | 1,33745 | 8,582931 |
| C | 1,19851 | 1,09580 | 8,569808 |
| Average± STDEV. | 8,5805±0,0097 | ||
The maceration results of 1000 grams of Gyrinops versteegii leaves powder were obtained 100 grams dry extract.
Total Phenol Contens Analysis
The measurement of Total phenol contens from water extract Gyrinops versteegii preceded by making standard curve of gallic acid with concentration with Absorbance as explained in table 2 and described figure 1.
Table 2: Absorbance of Gallic Acid Standard.
| Concentration (mg/L) | Absorbance |
| 0 | 0 |
| 10 | 0,040 |
| 20 | 0,077 |
| 40 | 0,180 |
| 60 | 0,249 |
| 80 | 0,322 |
| 100 | 0,397 |
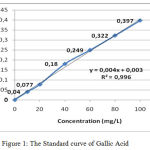 |
Figure 1: The Standard curve of Gallic Acid.
|
After absorbance the sample is included in the standard curve equation of gallic acid above obtained the total content of phenol Water Extract of Gyrinops versteegii leaves = 6020,4860 (6020,4860 ± 32,17) mg GAE/100 gram as explained in table 3:
Table 3. Total Contents of Phenol.
| Code Sample | Weight of extract (g) | Abs. | Contents
(mgGAE/100 gram) |
Content (%) |
| E1 | 0,064 | 0,158 | 6039,0625 | 6,0391 |
| E2 | 0,060 | 0,147 | 5983,3333 | 5,9833 |
| E3 | 0,064 | 0,158 | 6039,0625 | 6,0361 |
| Average ± STDEV | 6020,4860±32,17 | 6, 0195±0,0313 | ||
GAE =Gallat acid Equivalent; Abs. = Absorbance ;STDEV = Standard Deviation
Total Flavonoid Contens Analysis
The measurement of Total flavonoid contens from water extract Gyrinops versteegii leaves preceded by making standard curve of quercentine with some concentration as explained in table 4 and described figure 2:
Table 4: Quercetine Standard Curve.
| Concentration (mg/L) | Absorbans |
| 0 | 0 |
| 5 | 0,040 |
| 10 | 0,077 |
| 15 | 0,180 |
| 20 | 0,249 |
| 25 | 0,466 |
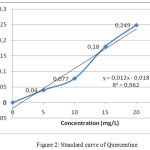 |
Figure 2: Standard curve of Quercentine.
|
After absorbance the sample is included in the standard curve equation of Querceti above obtained the total content of flavonoid Water Extract of Gyrinops versteegii leaves = 8133,322 mg QE / 100 gram as explained in table 5:
Table 5: Total Content of Flavonoid.
| Code of Sample | The Weight of Extract (g) | Absorbans | Contents (mg QE/100 g) | Contents (% g/100 g) |
| D1 | 0,076 | 1,246 | 6929,825 | 6,929825 |
| D2 | 0,055 | 1,256 | 9651,515 | 9,651515 |
| D3 | 0,051 | 0,939 | 7818,627 | 7,818627 |
| Average | 8133,322 | 8,133322 | ||
Analysis of IC50
Measurements or calculations of IC50 preceded by the preparation or measurement of absorbance of some extract concentrations from the sample proceeded to make a graph between% inhibition (y axis) with concentration (x axis) then from the linear regression formula obtained can be calculated IC50 as explained in table 6 and described figure 3:
Table 6: IC50 of Gyrinops versteegii leaf water extract.
| No. | Concentration extract (ppm) | Absorbance | % inhibit | Persamaan regresi | |
| Blanco | Extract | ||||
| 1 | 0,00 | 0,222 | 0,00 | 0,00 | y = 3,257x + 9,028 R² = 0,940 |
| 2 | 4 | 0,160 | 27,93 | ||
| 3 | 6 | 0,150 | 32,43 | ||
| 4 | 8 | 0,148 | 33,33 | ||
| 5 | 10 | 0,123 | 44,59 | ||
| 6 | 20 | 0,066 | 70,27 | ||
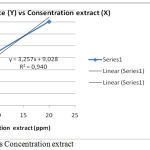 |
Figure 3: Curve % Inhibit vs Concentration extract.
|
It result can be proved water extract of Gyrinops versteegii leaves had the highest antioxidant capacity with IC50 < 50 ppm or very powerful antioxidant and potentially to be developed into a source of natural antioxidants.
Analysis Hypoglycemic
Blood glucose measurement results in the negative control group starting from the day before alloxan was induced (day 0), hyperglycemic (day 3 after alloxane induction) and after treatment (days 7 and 14) as explained table 7:
Table 7: Blood Glucose contents of negatif control group (C-).
| No. Rats | Code (group) | Blood Glucose contents on the day ….(mg/dL) | |||
| 0 | 3 | 7 | 14 | ||
| 1 | C (-) | 115 | 208 | 325 | 447 |
| 2 | C (-) | 122 | 210 | 345 | 462 |
| 3 | C (-) | 128 | 217 | 351 | 487 |
| 4 | C (-) | 134 | 224 | 356 | 498 |
| 5 | C (-) | 164 | 267 | 378 | 498 |
| Average±STDEV | 132,6 ±18,9 | 225,2±24,2 | 351±19,1 | 478,4±22,8 | |
Blood glucose measurement results in dose 100 group (Group II) starting from the day before alloxan was induced (day 0), hyperglycemic (day 3 after alloxane induction) and after treatment (days 7 and 14) as explained in Table 8:
Table 8: Decrease of blood glucose contents on dose 100 mg / kg BB group (T1).
| No. Rats | Code (Group) | Blood Glucose contents on the day ….(mg/dL) | Δ decrease | % Decrease | |||
| 0 | 3 | 7 | 14 | ||||
| 1 | T1 | 89 | 240 | 187 | 101 | 139 | 57,9 |
| 2 | T1 | 90 | 242 | 184 | 110 | 132 | 54,5 |
| 3 | T1 | 106 | 242 | 184 | 112 | 130 | 53,7 |
| 4 | T1 | 107 | 250 | 188 | 121 | 129 | 51,6 |
| 5 | T1 | 117 | 250 | 193 | 131 | 119 | 47,6 |
| Average±STDEV | 101,8±12,0 | 244,8±4,8 | 187,2±3,7 | 115,0±11,4 | 129,8±7,2 | 53,6±5,8 | |
Blood glucose measurement results in dose 200 group (Group II) starting from the day before alloxan was induced (day 0), hyperglycemic (day 3 after alloxane induction) and after treatment (days 7 and 14) as explained in Table 9:
Table 9: Decrease of blood glucose contents on dose 200 mg / kg BB group (T2).
| No.
Rats |
Code
(Group) |
Blood Glucose contents on the day ….(mg/dL) | Δ
decrease |
%
Decrease |
|||
| 0 | 3 | 7 | 14 | ||||
| 1 | T2 | 86 | 266 | 163 | 93 | 173 | 65 |
| 2 | T2 | 90 | 267 | 178 | 100 | 167 | 62,5 |
| 3 | T2 | 97 | 279 | 178 | 102 | 177 | 63,4 |
| 4 | T2 | 108 | 286 | 191 | 115 | 171 | 59,8 |
| 5 | T2 | 115 | 291 | 191 | 163 | 128 | 43,9 |
| Average±STDEV | 99,2±12,2 | 277,8±11,2 | 180,2±11,6 | 114,6±28,2 | 163,2±20 | 58,9±8,6 | |
Blood glucose measurement results in dose 400 group (Group IV) starting from the day before alloxan was induced (day 0), hyperglycemic (day 3 after alloxane induction) and after treatment (days 7 and 14) as explained in Table 10:
Tabel 10: Decrease of blood glucose contents on dose 400 mg / kg BB group (T3).
| No. Rats | Code (Group) | Blood Glucose contents on the day ….(mg/dL) | Δ decrease | % Decrease | |||
| 0 | 3 | 7 | 14 | ||||
| 1 | T3 | 98 | 356 | 144 | 89 | 267 | 75 |
| 2 | T3 | 100 | 398 | 189 | 90 | 308 | 77 |
| 3 | T3 | 107 | 408 | 204 | 95 | 313 | 77 |
| 4 | T3 | 112 | 410 | 209 | 98 | 312 | 76 |
| 5 | T3 | 120 | 424 | 210 | 111 | 313 | 74 |
| Average±STDEV | 107,4±8,9 | 399,2±25,9 | 191,2±27,7 | 96,6±8,9 | 302,6±20 | 75,8±1,3 | |
Blood glucose measurement results in positive control /Glibenklamid (C+) starting from the day before alloxan was induced (day 0), hyperglycemic (day 3 after alloxane induction) and after treatment (days 7 and 14) as explained in Table 11:
Tabel 11: Decrease of blood glucose contents on positive control (C+)
| No. Rats | Code (Group) | Blood Glucose contents on the day ….(mg/dL) | Δ decrease | % decrease | |||
| 0 | 3 | 7 | 14 | ||||
| 1 | C(+) | 92 | 212 | 212 | 103 | 322 | 76 |
| 2 | C(+) | 97 | 209 | 215 | 112 | 326 | 74 |
| 3 | C(+) | 97 | 204 | 218 | 112 | 337 | 75 |
| 4 | C(+) | 100 | 201 | 221 | 119 | 349 | 75 |
| 5 | C(+) | 133 | 214 | 295 | 123 | 353 | 74 |
| Average±STDEV | 103,8±16,6 | 451,2±20,9 | 232,2± 36,3 | 113,8±7,7 | 337,4±13,6 | 74,8±0,6 | |
Discussion
The water content of the simplicia obtained in this study was 5,98 % w/w. This result has been in accordance with the Regulation of the Head of the Food and Drug Inspection Agency (BPOM) No. 12 of 2014 on quality requirements of traditional medicine. This regulation states that the water content of a herbal simplicia of traditional medicine is less than or equal to 10% w/w or a maximum of 10% w/w. The results of in vitro analysis evidetly that water extract of Gyrinops versteegii leaves have the highest antioxidant capacity ie IC50 = 12.58 mg/mL (< 50 ppm ) Based on these results that the water extract of Gyrinops versteegii leaves can be regarded as a natural antioxidant and developed further testing in vivo antioxidant activity. The in vivo preliminary test showed that oral administration of water extracts of Gyrinops versteegii leaves with doses of 50, 100 and 200 mg / kgBW in Wistar rats that experienced oxidative stress were significantly (p <0.05) lowering MDA levels with a mean of 6.37 ± 0 , 23.5.56 ± 0.27 and 4.32 ± 0.27 U / mL. This dose is also able to increase the activity of the enzyme Superoxide Dismutase (SOD) with a mean of 12.15 ± 1.04, 15.70 ± 2.02, and 18.84 ± 1.51 and Catalase (CAT) enzymes with a mean of 6.68 ± 0.63; 8.20 ± 1.14 and 9.29 ± 0.79 U / mL (Adi Parwata, 2016). Acute Toxicity with LD50 = 6,355,3536 gram.According to Weils table in Harmita (2006), this value is at the threshold value that is not toxic so that water extract of Gyrinops versteegii leaves safe for consumption both as herbal drink and other herbal medicinal materials (Jiang et.al, 2011 and Gunawan et.al, 2016).High antioxidant capacity is C50 = 12.58 mg/mL (< 50 ppm ), high total content of phenolic and flavonoids the water extract of leaves Gyrinops versteegii that is 2099,5025 mg GAE/ 100 g and 8133,322 mg QE/100 g able to inhibit and neutralize free radicals (DPPH) (Mathew et.al, 2006 and Maisuthisakul et.al, 2007). Flavonoids can be direct scavenging of Reactive Oxygen Species (ROS). Flavonoids can be prevention of ROS formation throught metal chelation so prevention of redox reactions, inhibition of xantine oxidase and inhibition of NADPH oxidase. Flavonoids can be protection of lipophilic antioxidants and induction of antixidant enzymes (Akhlaghi, 2009). This resulted in a reaction barrier between ROS lipid peroxidation reaction with unsaturated fatty acids long-chain (PUFAs) can be suppressed and the results peroxidation MDA will decrease (Kaneto, 1999, Lecumberri, 2011; Akhlaghi, 2009). The magnitude of hypoglycemic activity or decrease in blood glucose (Δ) from the water extract of Gyrinops versteegii leaves on hyperglycemic mice can be calculated from the results of deviation (Δ) of blood glucose levels on the last day of measurement (day 14) with blood glucose levels when hyperglycemic (day 3) and % reduction. The results showed that the negative control without oral induction of water extracts of Gyrinops versteegii leaves increased blood glucose levels starting from before hyperglycemia (day 0) until the last measurement of day 14, as described in figure 4:
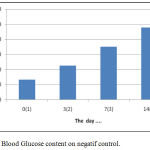 |
Figure 4: Blood Glucose content on negatif control.
|
These results indicate that intraperitoneal induction of Alloxane at a dose of 100-125 mg / kgBB without treatment or treatment with certain drugs both syntheses and herbs will cause damage to Lagerhans gland of the pancreas but can still produce insulin (Nandhagopal, 2013).The results showed that the treatment by giving orally extracts of water from Gyrinops versteegii leaves dose of 100 mg / kg after hyperglycemia or blood glucose content > 135 mg/dL or >140 mg/dL (Manjusha et al, 2011) blood glucose levels continued to decline from the 7th day until the last measurement of the 14th day, as described in figure 5:
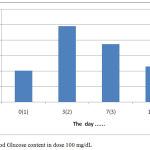 |
Figure 5: Blood Glucose content in dose 100 mg/dL.
|
The results showed that the treatment by giving orally extracts of water from Gyrinops versteegii leaves dose of 200 mg / kg after hyperglycemia (blood glucose content > 135 mg/dL) blood glucose levels continued to decline from the 7th day until the last measurement of the 14th day, as described in figure 6:
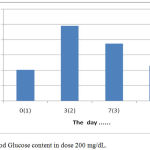 |
Figure 6: Blood Glucose content in dose 200 mg/dL.
|
The results showed that the treatment by giving orally extracts of water from Gyrinops versteegii leaves dose of 400 mg / kg after hyperglycemia (blood glucose content > 135 mg/dL) blood glucose levels continued to decline from the 7th day until the last measurement of the 14th day, as described in figure 7:
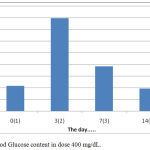 |
Figure 7: Blood Glucose content in dose 400 mg/dL.
|
Based on the results shown in the graph and table above shows that the dose of 100,200 and 400 mg / kgBW can reduce blood glucose levels in hyperglycemic mice with a consecutive decrease of 53.6% (53.6 ± 5.8), 58 , 9% (58.9 ± 8.6) and 75% (75.8 ± 1.3). The highest dose can affect the decrease in blood glucose is a dose of 400 mg / kgBW.High contents of total flavonoids and very strong antioxidant activity, the water extract of Gyrinops versteegii leaves is thought to have activity in lowering blood glucose in hyperglycemic wistar rats. Flavonoids in their capacity as antioxidants can inhibit cell damage at pan creases, inhibit glucose absorption in the intestine and cell resistance to insulin (Kaneto, 1999, Ruha et.al, 2001, Song et.al, 2002 ; Grasi et.al, 2010 and Ryzky 2015)
Conclusion
High contents of total phenol and flavonoids with very strong antioxidant activity, the water extract of gyrinops versteegii leaves with a dose of 100, 200 , 400 mg / kgBW was able to reduce blood glucose levels in hyperglycemic Wistar rats with a consecutive value of 53.6%, 58.9% and 75.8%.
Acknowledgement
I would like to thank with colleagues and friends who faithfully support laboratory research until completion of research. We did not forget to thank profusely to Rector, Chairman and staff of the Institute for Research and Community Services University Udayana, Denpasar, Bali and staff on the funds provided to finance the research.
References
- Parwata A. I., Sukardiman M. O., Mulya H. S and Widhiartini A. Inhibition of Fibrosarcoma Growth by 5-hydroxy-7-ethoxy-flavanons from Kaempferia pandurata Roxb. Biomedical and Pharmacology Journal. 2016;9(3):941-48.
CrossRef - Parwata A., Manuaba P., Wita S. Gaharu Leaf Water Extract Reduce MDA and 8-OHdG Levels and Increase Activities SOD and Catalase in Wistar Rats Provided Maximum Physical Activity. Bali Medical Journal. 2016;5(3):79-83.
CrossRef - Akhlaghi M. and Brian B. Mechanisms of flavonoid protection against myocardial ischemia–reperfusion injury. Journal of Molecular and Cellular Cardiology. 2009;46:309–17.
CrossRef - Almey A., Khan A. J., Zahir S., Suleiman M., Rahim A. K. Total phenolic content and primary antioxidan activity of methanolic and ethanolic extract of aromatic plants’ leaves. International Food Research Journal. 2010;17:1077-88.
- Ashafa A. O. T., Grierson D. S and Afolayan A. J. In Vitro Antioxidant Activity of Extracts From the Leaves of Felicia Muricata Thunb. an Underutilized Medicinal Plant in the Eastern Cape Province. South Africa Afr J Tradit Complement Altern Med. 2010;7(4):296–302.
- Biswas R., Dasgupta A., Mitra A.,Roy S.K., Dutta P.K., Achari B., Dastidar S.G., dan Chatterjee T. K. Isolation, purification and characterization of four pure compounds from the root extract of Pluchea indica Less and the potentiality of the root extract and the pure compounds for antimicrobial activity. European Bulletin of Drug Research. 2005;13:63-70.
- Chang S., Yang M and Wen H. C. J. Estimation of Total Flavonoid Content in Propolis by Two Complementary Colori metric Methods. J. Food Drug Anal. 2002;10:178-182.
- Calvalho. Experimental Model of Induction of Diabetes Mellitus in Rats. Barzil. 2003;2.
- Grassi D., Desideri G and Ferri C. Flavonoids Antioxidants Against Atherosclerosis. Nutrients. 2010;2:889-902.
CrossRef - Gunawan I. W. G., Puspawati N. M., Kumara R., Dewi N. W and Parwata A. I. M. O. Effect Of Euchresta Hors fieldii Lesch Benn Leaf Extract On Increases Enzyme Activity Of Super oxide Dis mutase And Glutathione Peroxidase In Rats with Maximum Physical Activity. J. Pharm. Sci. & Res. 2017;9(5):578-582.
- dan Radji H. M. Buku Ajar Analisis Hayati, Edisi 3, Penerbit Buku Kedokteran EGC. Jakarta. 2008.
- Jiang M. Z., Yan H., Wen Y., Li X. M. In vitro and in vivo studies of antioxidant activities of flavonoids from Adiantum capillus-veneris L. African Journal of Pharmacology. 2011;5(18):2079-85. China.
- Jack. Synthesis of Anti diabetic Flavonoids and Their Derivative.Medical Research. 2012;180.
- Kaneto H., Kajimoto Y., Miyagawa J., Matsuoka T.,Fujitani Y.,Umayahara Y., Hanafusa T.,Matsuzawa Y.,Yamasaki Y., Hori M. Beneficial effects of antioxidants in diabetes Possible protection of pancreatic β-Cells against glucose toxicity. Diabetes. 1999;48:2398-2406.
CrossRef - Lecumberri E.,Goya L.,Mateos R.,Alfa M., Ramos R., Izquierdo-Pulido M and Bravo L. A Diet Rich in Dietary Fiber from Cocoa Improvees Lipid Profil and Reduces Malondialdehyde in Hyper cholesterolemic Rats. Nutrition. 2007;23:332-41.
CrossRef - Lenzen S. Mechanism of Alloxan and Streptozotocin-Induced Diabetes. Diabetologia. 2008;51:216-226.
CrossRef - Maisuthisakul P., Suttajit M., Pongsawatmanit R. Assessment of phenolic content and free radical-scavenging capacity of some Thai indigenous plants. Food Chem. 2007;100:1409–18.
CrossRef - Mathew S., Abraham E. T. In vitro antioxidant activity and scavenging effects of Cinnamomum verum leaf extract assayed by different methodologies. Food Chem Toxicol. 2006;44:198–206.
CrossRef - Hazra M., Kundu S. S., Bhattcharya S., Pallab K. H., Gupta M., Upal K. M. Evaluation of hipoglicemic and Anti hyperglycemic effect of Luffa cylmdrical fruit extract in Rats. Journal of Advanced Pharmacy Education & Research. 2011;2:138-146.
- Nandhagopal K., Kannyakuman M., Velpandian V. Anti diabetic Activity of Karchure Chooranam on Alloxan Induced Diabetic Rats. International Journal of Pharma and Bio Sciences. 2013:434-439.
- Ordon-ez A. A. L., Gomez J. D., Vattuone M. A., Isla M. I. Antioxidant activity of Sechium edule (Jacq.) Swart extracts. Food Chem. 2006;97:452–458.
CrossRef - Ramaiah M., Rao B. G and Srikanta K. R. Anti diabetic activity of ethanolic Extract of Memecylon malabarium Cogn (Melastomataceae) Leaves. Int. J. Pharm. Bio Sci. 2012;822-828.
- Reagan-Shaw S., Nihal M and Ahmad N. Dose Translation from Animal to Human Studies Revisited. The FASEB Journal Life Sciences Forum. 2007;22(6):59-661.
- Rizky B. A. White Dragon Fruit (Hylocereus undatus) Potential As Diabetes Mellitus Treatment Artikel Review. J. Majority. 2015;4(1): 69-72.
- Ruhe R. C and McDonald R. B. Use of anti oxidant nutrientinthe prevention and treatment of type 2 diabetes. J.Am.Coll. Nutr. 2001;20(5):363-369.
CrossRef - Song J.,Kwon O.,Chen S.,Daruwala R.,Eck P., Park J. B., Levine M., Flavonoid inhibition of SVCT 1 and GLUT 2, intestinal trasporters for vitamin C and glucose. J.Biol.Chem. 2002;277(18):15252–15260.
CrossRef - Raju S. B. G.,Rao G. B and Latha M. Y. B. Anti hiperglycemic Activity of Hygrophila spinos a roots in Alloxan induced Diabetic Rats. 2011;1(4):315-317.
- Szkuldelski T. The Mechanism of Alloxan and Streptozotocin Action in B Cells of The Rat Pancreas. J. Physiol. Res. 2001;50:536-546.
- Wong S. P., Leong L. P and Koh J. H. W. Antioxidant activities of Aqueous extracts of selected plant. Food Chem. 2006;99:775-783.
CrossRef - Wolfe K., Wu X., Liu R. H. Antioxidant activity of apple peels. J Agric Food Chem. 2003;51:609–614.
CrossRef

