
Manuscript accepted on :16-May-2018
Published online on: 18-07-2018
Plagiarism Check: Yes
Reviewed by: Eric Lien
Second Review by: C. Kanniammal
Final Approval by: Mohamed Abdel-Daim
Fariba Gorohi, Maryam Shiemorteza and Marjan Mohammad Nori
Islamic Azad University, Tehran Medical Branch.
Corresponding Author E-mail: faribagorohi197@gmail.com
DOI : https://dx.doi.org/10.13005/bpj/1541
Abstract
This analytic-descriptive study compares the growth curve of breastfed babies and those babies who receive formula at 0 to 12 months of age. In order to do the study, the weights of 95% of newborn babies were considered at birth. The data were collected through a questionnaire whose validity was tested by Cronbach's alpha method. The data was analyzed using SPSS software (version 22) and appropriate statistical tests. Data analysis was performed on the basis of statistical inference and appropriate statistical techniques to confirm or reject the hypothesis.
Keywords
Bottle-Feeding; Breastfeeding; Growth Curve
Download this article as:| Copy the following to cite this article: Gorohi F, Shiemorteza M, Nori M. M. Comparison of Height, Weight and Head Circumference Index and the Incidence of Infectious and Gastrointestinal Diseases in Breast-Fed and Formula-Fed Infants at 0 To 1 Year old in Bu-Ali Sina Hospital. Biomed Pharmacol J 2018;11(3). |
| Copy the following to cite this URL: Gorohi F, Shiemorteza M, Nori M. M. Comparison of Height, Weight and Head Circumference Index and the Incidence of Infectious and Gastrointestinal Diseases in Breast-Fed and Formula-Fed Infants at 0 To 1 Year old in Bu-Ali Sina Hospital. Biomed Pharmacol J 2018;11(3). Available from: http://biomedpharmajournal.org/?p=21580 |
Introduction
Human growth has various dimensions and each of these dimensions affects each other. Therefore, physical growth affects the mental growth and vice versa, and if attention is made to the physical needs of the child in the process of growth, its effects on the mental growth is obvious. Children are the most vulnerable group in society. Therefore, full care is one of the important tasks of mothers and the society. Infancy is one of the periods that play a critical role in all stages of a person’s life. In this period, nutrition plays a decisive role in the child’s physical, emotional and mental growth. Exceptional period of infancy is important for rapid growth and high nutritional needs of the infant. Therefore, inadequate food intake or inappropriate selection of food may increase the risk of growth disorder with a potential adverse effect on neuro-cognitive development (AbdYazdan et al., 2014). The World Health Organization has recommended that exclusive breastfeeding for six months and with other complementary foods by the end of the 2 years is the most appropriate way to feed babies (Roig et al., 2010). Child growth is an important criterion for public health. Height and weight control is the best means of controlling growth and an important part of child care. Using height and weight growth curves, one can compare the child’s condition with the condition of standard population of his/her age and as a means to screen disorders. In addition to the above mentioned index, head circumference measurement should also be considered as an important measurable index, especially at birth and early years of life (Kafaee, et al., 2016). Child growth indicators are a standard to judge the proper growth of children. Measurements of height, weight and head circumference, and the combination of each of them with age or height, make anthropometric indicators. One of the best and easiest indicators of growth and physical development is weight. The weight of 95 % of infants is 2.5-4.6 kg and with a mean of 3.4kg. Often, boys are heavier than girls. At 5 months, baby has doubled the birth weight, and at 2 years of age, he/she has increased fourfold their birth weight and then the weight gain will be reduced to around 2.5 kg per year. Height or body length is another indicator for measuring growth. The height of the baby is 45-55 cm at birth with an average length of 50 cm. It will reach about 1.5 times birth height. It will be 2 times the height of birth at age 4. The head circumference is also one of the indicators of growth. The head circumference over the early years of life increases rapidly due to faster brain growth in these years. At birth, the circumference of the head is 32.6-37.2 with the mean of 35 cm. In the first six months after birth, the head circumference increases about 8-10 cm with the mean of 44 cm. In the second six months after birth, the head circumference increases by about 3 centimeters and reaches an average of 47 centimeters (Hatami et al., 2015). Given the proven benefits of breastfeeding, it is one of the most important ways of promoting children’s development in societies. However, mothers discontinue breastfeeding due to various factors and use formula to feed their child. Formula-feeding instead of breast feeding has a variety of effects on the baby’s emotional and mental development. In this regard, this research tries to determine the difference between growth indices of infants 0 to one year age and those who have fed with breast milk.
Methodology
This descriptive study compares growth indices such as height, weight, and head circumference in children at 0- one year old. This study make a comparison between the growth curve of infants fed with breastmilk and those fed with formula. In order to do this study, all formula-fed infants with no complementary food and breastfed infants were sampled. The samples were homogeneous by mother’s job, mother’s age, age gap between mother and infant, and exclusive breastfeeding in both groups. Data were collected through questionnaire and children’s growth curve.
Inferential Analysis
In this section, height, weight and head circumference growth are measured in babies from 0 to 12 months. Then, the growth rates of two groups are compared and the results are presented in the following tables. In order to investigate infectious and digestive diseases, we compared the incidence of six diseases including diarrhea, vomiting, gastroenteritis, OTU, and urinary tract infection in breastmilk fed infant and formula-fed infants. The tables indicate the results.
Hypothesis Testing
The First Hypothesis
There is a significant difference between height growth index of breast-fed and formula-fed infants at 0 to 1 year old.
The statistical population is divided into two groups of breast-fed and formula-fed infants. In order to accept or reject the first hypothesis, the independent t test is used.
Table 1 to table 5 shows the results of descriptive statistics of independent t-test on difference between height growth index of breast-fed and formula-fed infants.
Height growth at 1 months of age
In table 1, if Levene test for equality of variances shows that two variances are equal, the first row of the result is used. But if Levene’s test shows that the variances of two samples are not equal, the second row of the results should be used. In this example, the significance level of Levene test is equal to 0.016 that this amount indicates that two samples do not have equal variance (if the significance level is less than 0.05 then the variance of two samples are not equal in the level of 5% and if this amount is less than 0.01 then the variance of two samples are not equal in the level of 1%). So the second row is used.
Table 1: The result of independent t-test to height growth at 1 months of age.
| F | Significance level | t | Degree of freedom (df) | Significance level (2-tailed) | Mean difference | |
| Height growth | 16.000 | 0.016 | 31.000 | 4 | 0.000 | 2.06667 |
| 31.000 | 2 | 0.001 | 2.06667 |
According to the above table, the significance level is equal to 0.016 and because this level is less than 0.05, so there is a significant difference in the height growth index between breast-fed and formula-fed infants at 3 months of age. And the growth rate index is higher in breast-fed infants. Therefore, the null hypothesis is accepted.
Height growth at 3 months of age
In table 2, if Levene test for equality of variances shows that two variances are equal with each other, the first row of the result is used. But if Levene test shows that the variances of two samples are not equal, the second row of the results should be used. In this example, the significance level of Levene’s test is equal to 0.005 that this amount indicates that two samples do not have equal variance (if the significance level is less than 0.05 then the variance of two samples are not equal in the level of 5% and if this amount is less than 0.01 then the variance of two samples are not equal in the level of 1%). So the second row is used.
Table 2: The result of independent t-test to height growth at 3 months of age.
| F | Significance level | t | Degree of freedom (df) | Significance level (2-tailed) | Mean difference | |
| Height growth | 32.267 | 0.005 | 1.889 | 4 | 0.132 | 1.0000 |
| 2.810 | 3.118 | 0.064 | 1.0000 |
According to the above table, the significance level is equal to 0.005 and because this level is less than 0.05, so there is a significant difference in the height growth index between babies who received the breast milk and infants who received powdered milk at 3 months of age. And this index in children who received breast milk has higher growth rate. Therefore, the null hypothesis is accepted.
Height growth at 6 months of age
In table 3, if Levene test for equality of variances shows that two variances are equal, the first row of the result is used. But if Levene test shows that the variances of two samples are not equal, the second row of the results should be used. In this example, the significance level of Levene’s test is equal to 0.38 that this number indicates that two samples do not have equal variance (if the significance level is less than 0.05 then the variance of two samples are not equal in the level of 5% and if this amount is less than 0.01 then the variance of two samples are not equal in the level of 1%). So the second row is used.
Table 3: The result of independent t-test to height growth at 6 months of age.
| F | Significance level | t | Degree of freedom (df) | Significance level (2-tailed) | Mean difference | |
| Height growth | 9.260 | 0.038 | 6.719 | 4 | 0.003 | 0.91667 |
| 6.719 | 2.187 | 0.017 | 0.91667 |
According to the above table, the significance level is equal to 0.038 and because this level is less than 0.05, so there is a significant difference in the height growth index between babies who received the breast milk and infants who received powdered milk at 6 months of age. And this index in children who received breast milk has higher growth rate. Therefore, the null hypothesis is accepted.
Height growth at 9 months of age
In table 4, if Levene test for equality of variances shows that two variances are equal with each other, the first row of the result is used. But if Levene test shows that the variances of two samples are not equal, the second row of the results should be used. In this example, the significance level of Levene’s test is equal to 0.148 that this number indicates that two samples do not have equal variance (if the significance level is less than 0.05 then the variance of two samples are equal in the level of 5% and if this amount is less than 0.01 then the variance of two samples are not equal in the level of 1%). So the first row is used.
Table 4: The result of independent t-test to height growth at 9 months of age.
| F | Significance level | t | Degree of freedom (df) | Significance level (2-tailed) | Mean difference | |
| Height growth | 3.200 | 0.148 | 2.683 | 4 | 0.055 | 0.2 |
| 2.683 | 2.941 | 0.076 | 0.2 |
According to the above table, the significance level is equal to 0.148 and because this level is more than 0.05, so there is not a significant difference in the height growth index between babies who received the breast milk and infants who received powdered milk at 9 months of age.
Height growth at 12 months of age
In table 5, if Levene’s test for equality of variances shows that two variances are equal with each other, the first row of the result is used. But if Levene’s test shows that the variances of two samples are not equal, the second row of the results should be used. In this example, the significance level of Levene’s test is equal to 1.000 that this number indicates that two samples do not have equal variance (if the significance level is less than 0.05 then the variance of two samples are equal in the level of 5% and if this amount is less than 0.01 then the variance of two samples are not equal in the level of 1%). So the first row is used.
Table 5: The result of independent t-test to height growth at 12 months of age.
| F | Significance level | t | Degree of freedom (df) | Significance level (2-tailed) | Mean difference | |
| Height growth | 0.000 | 1.000 | 0.000 | 4 | 1.000 | 0.000 |
| 0.000 | 4.000 | 1.000 | 0.000 |
According to the above table, the significance level is equal to 1.000 and because this level is more than 0.05, so there is not a significant difference in the height growth index between babies who received the breast milk and infants who received powdered milk at 12 months of age.
The Second Hypothesis
There is a significant difference between the growth rate of weight in breast-fed and formula-fed infants at 0 to 1 year old.
The statistical population that considered in this study was divided into two groups. The one group was breast-fed infants and another group was formula-fed infants and these two groups were tested. Independent t-test is used to accept or reject the hypothesis, that the growth of weight is different.
Table 6, table 7, table 8, table 9 and table 10 show the results of descriptive statistics of independent t-test for difference between the rate of weight growth in breast-fed and formula-fed groups.
Weight gain at 1 months of age
In table 6, if Levene test for equality of variances shows that two variances are equal, the first row of the result is used. But if Levene test shows that the variances of two samples are not equal, the second row of the results should be used. In this example, the significance level of Levene test is equal to 0.037 that this amount indicates that two samples do not have equal variance (if the significance level is less than 0.05 then the variance of two samples are equal in the level of 5% and if this amount is less than 0.01 then the variance of two samples are not equal in the level of 1%). So the second row is used.
Table 6: The result of independent t-test to weight growth at 1 months of age.
| F | Significance level | t | Degree of freedom (df) | Significance level (2-tailed) | Mean difference | |
| Weight growth | 9.394 | 0.037 | 3.145 | 4 | 0.035 | 0.96667 |
| 3.145 | 2.048 | 0.085 | 0.96667 |
According to the above table, the significance level is equal to 0.037 and because this level is less than 0.05, so there is a significant difference between the weight growth index of breast-fed and formula-fed infants at 1 months of age. And this index in children who received breast milk has higher growth rate. Therefore, the null hypothesis is accepted.
Weight gain at 3 months of age
In table 7, if Levene test for equality of variances shows that two variances are equal, the first row of the result is used. If Levene test shows that the variances of two samples are not equal, the second row of the results should be used. In this example, the significance level of Levene’s test is equal to 0.031 that this amount indicates that two samples do not have equal variance (if the significance level is less than 0.05 then the variance of two samples are equal in the level of 5% and if this amount is less than 0.01 then the variance of two samples are not equal in the level of 1%). So the second row is used.
Table 7: The result of independent t-test to weight growth at 3 months of age.
| F | Significance level | t | Degree of freedom (df) | Significance level (2-tailed) | Mean difference | |
| Weight growth | 10.667 | 0.031 | 2.177 | 4 | 0.095 | 0.4000 |
| 3.266 | 3.000 | 0.047 | 0.4000 |
According to the above table, the significance level is equal to 0.031 and because this level is less than 0.05, so there is a significant difference between the weight growth index of breast-fed and formula-fed infants at 3 months of age. And the growth rate index is higher in breast-fed infants. Therefore, the null hypothesis is accepted.
Weight gain at 6 months of age
In table 8, if Levene test for equality of variances shows that two variances are equal, the first row of the result is used. But if Levene test shows that the variances of two samples are not equal, the second row of the results should be used. In this example, the significance level of Levene’s test is equal to 0.561 that this amount indicates that two samples do not have equal variance (if the significance level is less than 0.05 then the variance of two samples are equal in the level of 5% and if this amount is less than 0.01 then the variance of two samples are not equal in the level of 1%). So the second row is used.
Table 8: The results of independent t-test for weight gain in 6-months old babies.
| F | Significant level | t | Degree of freedom | significant level (2-tailed) | Average difference | |
| Weight gain | 0.400 | 0.561 | -0.500 | 4 | 0.643 | -0.03333 |
| -0.500 | 3.200 | 0.649 | -0.03333 |
According to table 8, the significant level was 0.561 and as it is less than 0.05, it means that there is a significant difference between the weight gain indicator of the 6-months old breast-fed and formula-fed infants. In babies who were breast feeding, this indicator showed more growth. So the assumption of zero is accepted.
Weight gain at 9 months of age
If the Levene test shows that the two variances are equal, the first row of table 9 is used while if the test shows that the variances of the two tests are not the same, and the second row of the table is used. In this example, the amount of significant level which shows the significant level of Levene test is 0.724. This result shows that the two sample tests have the same variance (when the significant level is less than 0.05, the variance of the two tests are not equal in the level of 5% while if the significant level is less than 0.01, the variance of the two tests are not equal in the level of 1%) so the first row of the table is used.
Table 9: The results of independent t-test for weight gain in 9-months old babies.
| F | Significant level | t | Degree of freedom | significant level (2-tailed) | Average difference | |
| Weight gain | 0.150 | 0. 724 | 1.464 | 3 | 0.239 | 0.08333 |
| 1.387 | 1.899 | 0.306 | 0.08333 |
According to table 9, the significant level was 0.724 and as it is more than 0.05, it means that there is not a significant difference between the weight gain indicator of the 9 months old breast-fed and formula-fed infants. In babies who were breast feeding, this indicator showed more growth. So the null hypothesis is accepted.
Weight gain at 12months of age
If the Levene test shows that the two variances are equal, the first row of table 13 is used while if the test shows that the variances of the two tests are not the same, the second row of the table is used. In this example, the amount of significant level which shows the significant level of Levene test is 0.495. This result shows that the two sample tests have the same variance (when the significant level is less than 0.05, the variance of the two tests are not equal in the level of 5% while if the significant level is less than 0.01, the variance of the two tests are not equal in the level of 1%) so the first row of the table is used.
Table 10: The results of independent t-test for weight gain in 12-months old babies.
| F | Significant level | t | Degree of freedom | significant level (2-tailed) | Average difference | |
| Weight gain | 0.600 | 0. 495 | 0.000 | 3 | 1.000 | 0.000 |
| 0.000 | 1.684 | 1.000 | 0.000 |
According to table 10, the significant level was 0.495 and as it is more than 0.05, it means that there is not a significant difference between the weight gain indicator of the 12-months old breast-fed and formula-fed infants.
The Third Hypothesis
There is a significant difference between the head circumference growth indicator for zero to one-year-old breast-fed and formula-fed infants.
In this research, the statistical population in included in two groups of babies, i.e. those who are breast feeding and those who are feeding with powder milk. The population was tested and to confirm or reject the hypothesis which says the head circumference growth indicators for the two groups are different, the independent t-test was conducted.
Tables 11 to 15 show the results of the descriptive analysis of independent t-test. they show the difference between the head circumference growth indicators for indicator of breast-fed and formula-fed infants.
Head Circumference Growth in One-Month-old Infants
If the Levene’s test shows that the two variances are equal, the first row of table 11 is used while if the test shows that the variances of the two tests are not the same, and the second row of the table is used. In this example, the amount of significant level which shows the significant level of Levene’s test is 0.024. This result shows that the two sample tests do not have the same variance (when the significant level is less than 0.05, the variance of the two tests are not equal in the level of 5% while if the significant level is less than 0.01, the variance of the two tests are not equal in the level of 1%) so the second row of the table is used.
Table 11: The results of independent t-test for head circumference growth in one-month-old babies.
| F | Significant level | t | Degree of freedom | significant level (2-tailed) | Average difference | |
| head circumference growth | 18.150 | 0. 024 | 8.024 | 3 | 0.004 | 1.65000 |
| 6.431 | 1.108 | 0.082 | 1.65000 |
According to table, the significant level was 0.024 and as it is less than 0.05, it means that between the head circumference growth indicator of breast-fed and formula-fed infants at 1 months of age. In infants who are breast feeding, this indicator shows more growth so the null hypothesis is accepted.
Head circumference growth in 3-months old infants
If the Levene’s test shows that the two variances are equal, the first row of table 12 is used while if the test shows that the variances of the two tests are not the same, the second row of the table is used. In this example, the amount of significant level which shows the significant level of Levene’s test is 0.41. This result shows that the two sample tests do not have the same variance (when the significant level is less than 0.05, the variance of the two tests are not equal in the level of 5% while if the significant level is less than 0.01, the variance of the two tests are not equal in the level of 1%) so the second row of the table is used.
Table 12: The results of independent t-test for head circumference growth in 3-months old babies.
| F | Significant level | t | Degree of freedom | significant level (2-tailed) | Average difference | |
| head circumference growth | 7.585 | 0. 041 | 1.866 | 3 | 0.159 | 0.86667 |
| 2.393 | 2.077 | 0.134 | 0.86667 |
According to table 12, the significant level was 0.041 and as it is less than 0.05, it means that there is a significant difference between the head circumference growth indicator of the 3-months old babies who are breast feeding and those who are feeding with powder milk,. In infants who are breast feeding, this indicator shows more growth so the null hypothesis is accepted.
Head circumference growth in 6-months old infants
If the Levene’s test shows that the two variances are equal, the first row of table 13 is used while if the test shows that the variances of the two tests are not the same, the second row of the table is used. In this example, the amount of significant level which shows the significant level of Levene’s test is 0.561. This result shows that the two sample tests do not have the same variance (when the significant level is less than 0.05, the variance of the two tests are not equal in the level of 5% while if the significant level is less than 0.01, the variance of the two tests are not equal in the level of 1%) so the second row of the table is used.
Table 13: The results of independent t-test for head circumference growth in 6-months old babies.
| F | Significant level | t | Degree of freedom | significant level (2-tailed) | Average difference | |
| head circumference growth | 0.15 | 0. 027 | 9.076 | 3 | 0.003 | 0.51667 |
| 8.598 | 2.077 | 0.015 | 0.51667 |
According to table 13, the significant level was 0.027 and as it is less than 0.05, it means that there is a significant difference between the head circumference growth indicator of breast-fed and formula-fed infants at 6 months of age. In infants who are breast feeding, this indicator shows more growth so the null hypothesis is accepted.
Head circumference growth at 9 months of age
In the table 14, if the Levene test for the equality of the two variances shows that the two variances are equal, we use the first line of the results. However, if the Levene test shows that the variances of the two samples are not equal, then the second line of the results should be used. In this example, the value of the significant level, indicating the significant level of the Levene’s test is .495. This shows that the two samples have the same variances (whenever the number of significance level is less than 05, at the level of 5% and if this number is less than .01 At the level of 1%, the variances of the two samples is not equal) so we use the first line.
Table 14: Independent T-test results for head circumference at 9 months of age.
| F | The significance level | t | Degrees of freedom | The significance level(2 tailed) | Average Difference | |
| Growth of head circumference | 0.600 | 0.495 | 0.949 | 3 | 0.413 | 0.10000 |
| 0.866 | 1.684 | 0.492 | 0.10000 |
Considering the above table, it is seen that the significance level is at 0.495 and because it is higher than 0.05, it means that is, there is no significant difference in head circumference between the group of breastfed and formula fed babies at 9 months of age.
Growth of the head circumference at 12 months
In Table 15, if the Leven’s test for equality of two variances indicates that the two variances are equal, we use the first line of the results. However, if the Levene’s test shows that the variance of the two samples is not equal, then the second line of the results should be used. In this example, the value of the significance level indicating the significance level of the Leven’s test is 1.000, indicating that the two samples have the same variances (if the number of significance level is less than 05, at a level of 5% and whenever this number is less than .01 at the level of 1%, the variance of the two samples is not equal, so we use the first line.
Table 15: Independent T-test results for head circumference at 12 months of age.
| F | The significance level | t | Degrees of freedom | The significance level(2 tailed) | Average Difference | |
| Growth of head circumference | 0.000 | 1000 | 0.000 | 4 | 1000 | 0. 000 |
| 0.000 | 1.714 | 1.000 | 0. 000 |
According to the above table, it is seen that the level of significance is 1.000 and because it is higher than 0.05, that is, between the group of breastfed and formula- fed children, at 12 months of age, there is not a significant difference in head circumference index.
The following figure shows the average head circumference growth of breastfed and formula-fed children at different spans of time.
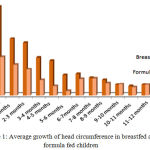 |
Figure 1: Average growth of head circumference in breastfed and formula fed children.
|
The Forth Hypothesis
There is a significant difference between the frequency of infectious and digestive diseases in children younger than one year of age who are breastfed.
In this hypothesis, the index of infectious and digestive disorders was evaluated and measured in six different diseases, and the results are recorded in the following tables.
Diarrhea
Table 16: Descriptive statistical results for independent t- test for the intragroup difference between the breastfeeding and the formula feeding.
| Feeding | Number | Average | Standard deviation | Average of the standard error | |
| Intragroup difference | Breastfeeding | 30 | 1.4 | 0.49827 | 0.09097 |
| Formula Feeding | 30 | 1.9 | 0.30513 | 0.05571 |
The table above shows the mean and standard deviations and the standard error of the mean indices of diarrhea disease in breastfed and formula fed children. As the table shows, the average of diarrhea in formula fed children is more than the breastfed ones.
In Table 17, if the Levene’s test for equality of two variances shows that the two variances are equal, we use the first line of the results. However, if the Levene’s test shows that the variance of the two samples is not equal, then the second line of the results should be used.
In this example, the value of the significance level that represents the significance level of the Levene’s test is .000, which indicates that the two samples have not the same variances (if the number of significance level is less than .05, at the level of 5% and if this number is less than .01 at the level of 1%, the variances of the two samples are not equal; So the second line will be used.
Table 17: The results of independent t-test for Diarrhea
| F | Level of significance | t | Degrees of freedom | Level of significance (2-tailed) | Average difference | |
| Diarrhea | 38.839 | 0.000 | -4.687 | 58 | 0.000 | -0.5 |
| -4.687 | 48.068 | 0.000 | -0.5 |
According to the above table, it can be seen that the level of significance is 0.000 and because it is lower than 0.05, it means that, between the group of breastfed children and those who are formula-fed, there is a significant difference in the diarrhea index and this indicator has a higher growth rate in formula- fed infants. So the zero assumption is accepted.
Vomiting
Table 18: The results of descriptive statistics of independent t-test for intergroup difference between breastfeeding and formula feeding
| Average of the standard error | Standard deviation | Average | Number | Feeding | |
| .08510 | 0.46609 | 1.3 | 30 | Breastfeeding | Vomiting |
| .06920 | 0.37905 | 1.8333 | 30 | Formula |
The table above shows the mean and standard deviations and the standard error of the mean in vomiting disease in breastfed or formula-fed children. As can be realized from the table, the average vomiting rate in formula-fed is higher than breastfed children.
In Table 19, if the Levene’s test for equality of two variances shows that the two variances are equal, we use the first line of the results. But, if the Levene’s test shows that the variances of the two samples are not equal, then the second line of the results should be used. In this example, the value of the significance level indicating the significance level of the Levene’s test is .016. This means that the two samples have not the same variances (if the number of significant levels is less than .05, at a level of 5% and when this number is less than .01 at the level of 1%, the variances of the two samples is not equal, so the second line will be used.
Table 19: Independent T-test results for Vomiting.
| Average difference | Level of significance (2-tailed) | Degrees of freedom | t | Level of significance | F | |
| -0.53333 | 0.000 | 58 | -4.862 | 0.016 | 6.153 | Vomiting
|
| -0.53333 | 0.000 | 55.687 | -4.862 |
According to the above table it is seen that the level of significance is 0.016 and as it is lower than 0.05, it means there is no significant difference between breastfed and formula fed babies in vomiting index. This index has more growth in formula fed babies; therefore the null hypothesis is accepted.
Urinary Tract Infection
Table 20: The results of descriptive statistics of independent t-test for the intergroup difference between breastfeeding and formula feeding.
| Average of the standard error | Standard deviation | Average | Number | Feeding | |
| .06312 | 0.34575 | 1.1313 | 30 | Breastfeeding | Urinary tract infection |
| .03333 | 0.18257 | 1.9667 | 30 | Formula feeding |
In the table above, the indices of the mean and standard deviation and the standard error average for the urinary tract infection in breastfed and formula-fed children are presented. As can be found from the table, the average rate of urinary tract infection in formula-fed children is higher than that of breastfed ones. The highest frequency of children in terms of age, in the formula feeding group belongs to the 11-12 months old and 1-2 months old with a frequency of 13.3% and in the breastfeeding group belonging to the 1-2 month old group with a frequency of 13.3%. The highest frequency of respondents by gender belonged to the group of female infants (56.7%) in the breastfeeding group and in the formula-fed group the frequency of male and female children was equal.
After Testing the Hypotheses, the Results Suggested
There is a significant difference between the height growth indices in children under one year of age who received breastfeeding with children who had formula feeding.
Table 21: Summary of independent height growth test results.
| variable | Age | T-test value | Significance level |
| Height Growth | 0-1 months | 31.000 | 0.016 |
| 1-2 months | 5.494 | 0.000 | |
| 2-3 months | 2.810 | 0.005 | |
| 3-4 months | 7.425 | 0.043 | |
| 4-5 months | 6.791 | 0.044 | |
| 5-6 months | 6.719 | 0.038 | |
| 6-7 months | 2.121 | 1.000 | |
| 7-8 months | 3.674 | 1.000 | |
| 8-9 months | 2.683 | 0.148 | |
| 9-10 months | 1.225 | 1.000 | |
| 10-11 months | 1.265 | 0.442 | |
| 11-12 months | 0.000 | 1.000 |
As you see in the above table, from 1 month to 6 months, there is a significant difference between the rate of growth of children fed with Infant formula and breastfeeding children and the significance level in these courses is less than 0.05. A confirmation that there is a significant difference between the breastfeeding infants and consume milk infant’s growth. And in all six periods, the average growth rate of breastfed infants is higher than that of baby milk infants. In the 6 months to 12 month period, unlike the previous six months, there is no significant difference in the growth rate between the breastfeeding infant and Infant-formula infants, as the significance level of this group is greater than 0.05. There was a significant difference between the Weight growth indicators in children 0 to 1-year-old who received breast milk with children who had Infant formula.
Table 22: Summary of independent weight growth test results.
| variable | Age | T test value | Significance level |
| Height Growth | 0-1 months | 3.145 | 0.037 |
| 1-2 months | 4.808 | 0.019 | |
| 2-3 months | 3.266 | 0.031 | |
| 3-4 months | 8.222 | 0.030 | |
| 4-5 months | 3.881 | 0.044 | |
| 5-6 months | 0.500- | 0.561 | |
| 6-7 months | 0.500- | 0.561 | |
| 7-8 months | 0.293 | 0.724 | |
| 8-9 months | 1.464 | 0.724 | |
| 9-10 months | 1.000 | ||
| 10-11 months | 0.293 | 0.724 | |
| 11-12 months | 0.000 | 0.495 |
As it can be observed in the table above, from 1 month to 6 months, there is a significant difference between the weight growth indicator of children fed with Infant-formula and infants fed breast milk. The significant level of these courses is less than 0.05. This is a confirmation that there is a significant difference between the weight growth indicator of breast-fed infants and infants who use Infant-formula. And in all six cycles, the average weight growth indicator of infants consuming breast milk is higher than that of infants who use Infant-formula. From 6 months to 12 months, unlike 6 earlier periods is observed that there is no significant difference in weight growth between the group of breastfed infants and infants who use Infant-formula since the significance level of this group is greater than 0.05. There is a significant difference between head circumference growth index in children between 0 and 1 year of age who have been breastfed with children who consume infant-formula.
Table 23: Summary of T-test independent results of head circumference growth.
| variable | Age | T-test value | Significance level |
| Height Growth | 0-1 months | 6.431 | 0.024 |
| 1-2 months | 13.168 | 0.013 | |
| 2-3 months | 2.393 | 0.041 | |
| 3-4 months | 8.500 | 0.048 | |
| 4-5 months | 7.906 | 0.044 | |
| 5-6 months | 8.598 | 0.027 | |
| 6-7 months | 2.500 | 0.561 | |
| 7-8 months | 0.293 | 0.724 | |
| 8-9 months | 0.949 | 0.495 | |
| 9-10 months | 0.178 | 0.268 | |
| 10-11 months | 0.775 | 0.053 | |
| 11-12 months | 0.000 | 1.000 |
As the above table, it can be seen from the age of 1 month to 6 months between the growth rates of the head of children fed with milk, there is a significant difference between children fed breast milk and as can be seen, the significance level of these courses is less than 0.05. This is confirmation that there is a significant difference between the growth of the head circumference of the breastfed infant and the infant who consumes milk powder and in all six cycles, the average growth of the head circumference of the breastfeeding infant is higher than who use Infant-formula. In the 6 months to 12 months of age, contrary to the earlier six months, there is no significant difference in the growth rate between the breastfeeding and Infant-formula infants in the breast milk, as the significance level of this group is greater than 0.05. There is a significant difference between the incidence of infectious and gastrointestinal diseases in children younger than one year of age who received milk powder.
Table 24: Summary of T-test independent results of infectious and digestive diseases
| variable | period | T-test value | Significance level |
| Infectious and digestive diseases | Diarrhea | 4.687- | 0.000 |
| Vomit | 4.862- | 0.016 | |
| Urinary tract infection | 11.674- | 0.004 | |
| Gastroenteritis | 16.155- | 0.000 | |
| OTU | 29.000- | 0.043 |
In the above table, the incidence of six types of infectious and gastrointestinal diseases is monitored among children fed with milk and infants fed breast milk and we concluded that there is a significant difference between the two groups and as can be observed, the significant level in these courses is less than 0.05. This is a confirmation that there is a significant difference between the incidence of infectious and gastrointestinal diseases in breastfed infants and infants who use milk powder. And in all six types of disease, the prevalence is lower among infants of breast milk than infants who use milk powder.
Discussion
Vafaie et al. (1995) reviewed the growth pattern of children fed breast milk and milk powder in Neyshabur city and compared it with the National Center for Health Statistics. A Growth chart is a clinical tool for assessing the health and development of a child that can be influenced by various factors including methods of nutrition. The aim of this study was to compare the growth indices of infants fed breast milk and infant formula and compare them with the National Center for Health Statistics in 2017. This descriptive-analytical study was performed on 186 children under the age of 6 months in a randomized sampling method in urban and rural health centers in Neyshabur in 2017. The data gathering tool was a checklist in which the demographic characteristics and information on the children’s anthropometric indices were completed from their health records. Data were analyzed using SPSS software version 20 and statistical analysis at the significance level. The results showed that there was a significant difference between the mean of anthropometric indices of infants (weight, height, and head circumference) in two groups of breastfed and milk powder infants at two months and six-month group. In this research, the comparison between breast milk and infant milk was studied only in the first six months of life. The growth indices indicated that there was a significant difference between the two groups in height weight and head circumference. In our study, we looked at these changes in the first 12 months of the birth. And the result we scored for growth indices in the first six months was quite consistent with the results of Vafaie and his colleagues. In other words, as Vafaie noted in their research there is a significant difference between height and weight growth and head circumference in nursing and breastfeeding infants. The average of this growth in infants who drinks breast milk is higher than that of infants who drink milk powder. We also concluded in the first part of our research and it can be said that these two types of research are in agreement with each other, but in the second part of the study, we look at the growth indices in the second six months of the birth, we observed that there is no significant difference in growth between two groups of children with different nutrition. Dahaghin and Mobasheri in 2017 in an article, were comparing the indices of growth (weight, height, head circumference) in children breastfed and formula-fed during their first 6 months of life. The baby’s natural growth and nutrition are closely interrelated. In the first year of life, especially in the first six months of childhood growth, regular and periodic measurements of growth indices (weight, height, and head circumference) are an appropriate measure of the growth of the child. Therefore, weight, which is considered to be the most sensitive indicator of growth, is considered the best way to diagnose a growth disorder and malnutrition in a child. There are significant differences between growth indices of newborns in different countries due to race and environmental economic factors. Studies have concluded that breastfeeding children have an ideal organic growth of up to 3 months, but they lose weight from 3 to 6 months of age. Regarding the changes in growth indices between these two groups (breast milk and powder milk), it was decided to compare these indices in these two groups. This study is a descriptive-cross sectional study and it is a community of all children who have passed their first 6 months of life and have family evidence in Shahid Beheshti University of Medical Sciences and Health Services. Regarding the changes in growth indices between these two groups (breast milk and powder milk), it was decided to compare these indices in these two groups.
A total of 240 children were studied, of which 50% were breastfeeding milk and 50% were a formula-fed group. Weight, height and head circumference at birth were not significantly different (P> 0.05), while height, weight and head circumference at 2 months showed a significant difference. This study looked at the growth of children in the first six months more rigorously and the result is slightly different from the result of our research in the first six months of the birth of breastfeeding infants and Infant-formula. The study found that the growth of these two groups of children was significantly different during the two months, but this growth was reduced in the second trimester. But in our study, we showed that this significant difference was maintained until the birth of six months and then gradually the height and weight indices and the head circumference of the breast milk drinker and powder milk drinker infants are going to close to each other. Therefore, it can be said that since both studies pursue the same goal and come to somewhat similar results, then these two studies are in agreement with each other.
Conclusion
The purpose of this study was to compare the growth curve of 0-12-month-old children fed with powder milk with children fed at the same age with breast milk. For this purpose, the weight of 95% of newborn infants was evaluated at birth. The data were collected from a questionnaire whose validity was tested by Cronbach’s alpha method. This information was analyzed in SPSS version 22 software by appropriate statistical tests according to research hypotheses. Data analysis was performed on the basis of statistical inference and with the help of appropriate statistical techniques to confirm or reject.
Acknowledgement
The author(s) received no specific funding for this work.
References
- Abdi-Zadan, Zahra Elahi, Tahere Golshiri, Parastoo. Comparison of the Effect of Mothers’ Empowerment Program on Breastfeeding in Pre and Postpartum Period, on the Time of Breastfeeding, New Care.Journal of Nursing and Midwifery Faculty, Birjand University of Medical Sciences. 2015;11:1.
- Hatami, Hossein, Nozadi S, Majlesi M ,Eftekhar F A, Razavi H, Mansour S , Parizadeh, Mohammad S J. Comprehensive Public Health Book, Arjmand Publication. 2016;1.
- Roig A. O, Martínez M. R, García J. C, Hoyos S. P, Navidad G. L, Álvarez J. C. F & González R. G. D. L. Factors associated with breastfeeding cessation before months. 2010;18(3):373-380.
- Atrian K .M, Nasiri S, Sarafraz N, Abbaszadeh F & Jafarabadi A.M. The link of arms holding infant and growth rate. Holistic Nursing And Midwifery Journal. 2016;26(1):41-47.
- Clark K. M, Li M, Zhu B, Liang F, Shao J, Zhang Y & Lozoff B. Breastfeeding, mixed, or formula feeding at 9 months of age and the prevalence of iron deficiency and iron deficiency anemia in two cohorts of infants in China. The Journal of pediatrics. 2017;181:56-61.
CrossRef - Ventura A. K. Developmental trajectories of bottlefeeding during infancy and their association with weight gain. Journal of Developmental & Behavioral Pediatrics. 2017;38(2):109.
- Bartick M. C, Schwarz E. B, Green B. D, Jegier B. J, Reinhold A. G, Colaizy T. T & Stuebe A. M. Suboptimal breastfeeding in the United States: Maternal and pediatric health outcomes and costs. Maternal & child nutrition. 2017.
CrossRef - Betoko A, Lioret S, Heude B, Hankard R, Carles S, Forhan A & Lauzon‐Guillain B. Influence of infant feeding patterns over the first year of life on growth from birth to 5 years. Pediatric Obesity. 2017.
CrossRef - Hopkins D, Steer C. D, Northstone K & Emmett P. M. Effects on childhood body habitus of feeding large volumes of a cow or formula milk compared with breastfeeding in the latter part of infancy. The American journal of clinical nutrition. 2015;ajcn100529.
- Ryan K, Bissell P, Alexander J. Moral work in women’s narratives of breastfeeding. Journal of Social Science & Medicine. 2010;70(6):951–958.
CrossRef - Hoddinott P, Britten J, Pill R. Why do interventions work in some places and not others: A breastfeeding support group trail? Journal of Social Science & Medicine. 2014;109:55–65.
- Hockenberry-Wilson K. wong’s nursing care of infant and children. 8 th ed. Missori: Mosby Publication. P. 2007;290-291.
- Kyle J. Essentials of pediatric nursing. Philadelphia: Baltimore Publication. P. 2008;94.
- Morowati- Sharifabad M, Hajizadeh H, Karbasi A .S, Fallahzadeh H. Study of the status of 6-12 months children exclusive breastfed up to six months and its related factors in the Urban health care centers of Ardakan city. Journal of Shahid Sadoughi University of Medical Sciences. (In Persian). 2012;40(3):64-94.
- Murase M, Wagner E. A, Chantry C. J, Dewey K. G & Nommsen-Rivers L. A. The relation between breast milk sodium to potassium ratio and maternal report of a milk supply concern. The Journal of pediatrics. 2017;181: 294.
CrossRef

