P. M. Shivamurthy1, T.N. Nagabhushan1 and Vijaya Basavaraj2
1Sri Jayachamarajendra College of Engineering, Mysuru.
2JSS Medical College and Hospital, Mysuru.
Corresponding Author E-mail: pmshiva@sjce.ac.in
DOI : https://dx.doi.org/10.13005/bpj/1496
Abstract
Nuclear pleomorphism is considered to be one of the most significant shape based feature adapted in grading the cancer through the pathological studies of the H&E stained tissue slides. Microscopic study of manually extracting the feature is highly laborious and misleads the pathologists during grading. Digitization of the slides has given rise to various segmentation approaches to extract the nuclei shape to assess the degree of pleomorphism. Here, a novel approach of initializing and evolving the distance regularized level sets (DRLS) for the detection and segmentation of the nuclei has been presented. In this work, two major objectives have been achieved. First, a novel geometric approach has been devised for the detection of centroids of each nuclei in the occluded region and second, a shape prior model has been presented for the extraction of gradient information through morphological operations. The multiple level set implementation of the DRLS contours are initialized using the centroids detected and driven through the gradient computed. The proposed method has been experimented over the images of benign and malignant breast cancer tissue obtained from BeakHis dataset. A quantitative analysis of the results have shown that a 97% of object detection accuracy and 78% of overlap resolution has been achieved through the proposed model. A comparative study with that of geodesic active contours have indicated an improvement in the segmentation accuracy measure of 9-10 pixel difference.
Keywords
Curvature-Norm; Geometric Centroid; Nuclear Pleomorphism; Shape-prior Model
Download this article as:| Copy the following to cite this article: Shivamurthy P. M, Nagabhushan T. N, Basavaraj V. A Curvature-Norm Based Centroid Initialized Distance Regularized Level Sets for Nuclear Segmentation in Histopathological Images. Biomed Pharmacol J 2018;11(3). |
| Copy the following to cite this URL: Shivamurthy P. M, Nagabhushan T. N, Basavaraj V. A Curvature-Norm Based Centroid Initialized Distance Regularized Level Sets for Nuclear Segmentation in Histopathological Images. Biomed Pharmacol J 2018;11(3). Available from: http://biomedpharmajournal.org/?p=22085 |
Introduction
Extraction of the significant biomarker play a significant role in the diagnosis and prognosis of the cancer. Pathologists have considered the nuclear pleomorphism as an important shape based biomarker in the process of staging the disease. A manual delineation of the nuclear boundary fetches the pleomorphic features based on the shape detected through microscopic observation of the histopathological slides. This is a very laborious and time consuming activity due to the heterogeneity of the tissue objects observed on the slides. This will mislead the diagnosis process resulting in wrong staging. This may also, be due to inter and intra-observer variabilities existing among the pathologists.
Many automated staging systems have been proposed following the advent of digitization of the slides. The digitized image is considered as a 2-D scene Is, represented as a matrix M, consisting of pixel intensity values of RGB components. It is defined as Is= (M, ω), where ω = χ(x,y) is the pixel intensity function representing a vector ω ϵ M, consisting of intensity levels of red, green and blue components. Various imaging techniques have been presented in the literature, addressing the object detection, segmentation and followed by classification. Segmentation of nuclei is an important phase in the process of extracting the pleomorphic features. Since the boundary to be extracted is irregular and presents discontinuity, many low level approaches fail in segmenting the nuclei to the required accuracy. Hence, due to complex morphological features and heterogeneity of the image, segmentation of the nuclei is considered to be a challenging task.
Existing Literature
Most of the works presented in the literature have highlighted significance of various features and similarity measures in addressing the object detection in an overlapped region and segmenting the irregular boundary. An unsupervised segmentation has been presented based on the features computed using magnitude and spectra in the frequency domain.1 A morphologically seeded watershed based method has been proposed extract the overlapped nuclei.2 In a work presented, a Gaussian based hierarchical voting and repulsive balloon model has been used for a cell segmentation.3 An improved hybrid active contour model driven by both boundary and region information is used for an effective nuclear segmentation4. In the work presented by 5,6 a multi-scale radial line scanning has been proposed to delineate the boundaries of nuclei detected using Laplacian of Gaussian kernels. An integrated model of adaptive morphology and curvature scale space has been used to segment the overlapped cells.7 A color decomposition based active contours and a sparse shape prior and occlusion constraint based levels sets have also been proposed for a robust nuclei segmentation.8,9 A large feature set based adaboost classifier technique has been used to perform nuclear detection.10 There are methods based on deep convolution networks applied to perform nuclear segmentation.11,12 It has also been shown that the edge based approaches are inefficient due to irregularity and missing boundary information, whereas region based approaches suffer from over and under segmentation.
System Overview
There are two major challenges need to addressed during the segmentation of the nuclei in a digitized H&E images. First, the detection of the number of nuclei present in an occluded region and second, to compute the boundary information accurately to segment the nuclei shape presenting the pleomorphic features. The work presented in this research has been able to address both the issues efficiently. Following are the main objectives achieved in this proposed methodology.
First, the computation of geometric centroid Cg = {ci : M(xi ,yi) ϵ Is} of each nuclei objects present in the occluded region of interest (ROI) extracted through proposed shape prior based morphological enhancements. In the existing literature, various methods of centroid detection have been proposed. A review on centroid detection techniques based on Euclidian distance map, Hough transform and H-Maxima transform has been presented.13,14 Nuclear size has been considered as a biomarker representing the ground truth for the detection of the centroids.15,16 Detection schemes based on support vector machine (SVM) and deep learning approaches have been presented.17,18 In the work presented in this research, a novel approach of generating the centroids of the irregular curvature has been presented. This is achieved by computing the intersecting points Xi={x1,x2,…..xm} of the norms Nc={n1,n2,…..nl} obtained orthogonal to the tangents Tc={t1,t2,…..tl} drawn over each boundary point Bc(x,y) on the curve. Considering the Euclidian distance function over the m intersecting points, k number of clusters are obtained using k-means clustering. The k value is computed for each region, by taking the fractional area of the overall region keeping the average area of the nuclei as the fractional value given by Eq. 1.

where Aregion is the area of the occluded region and Aavg is the mean area of the nuclei computed using the shape prior model. Through this approach an approximate centroid of each nuclei present in the occluded region is obtained, hence detecting the existence of nuclei.
Second, the segmentation of the nuclei boundary through the evolution of contours implemented as multiple level sets of distance regularized level set (DRLS) function. Active contours, originally proposed as energy minimizing deformable models19 have been considered to be most effective in segmenting the irregular boundaries. The basic idea is to evolve the contour u, which is represented as a polynomial function in a level set functional model. The level set function Ф(u) is represented as a partial differential equation as given in Eq.2

Where fG is the function which computes the gradient information. The evolution of the contour towards the object boundary is controlled by the gradient information, obtained as the function of EI and Eu representing the energy gradient of image and the contour respectively. As the contour evolves towards the boundary, the energy difference reduces to null value. Various active contour models have been proposed in the existing literature emphasizing the importance of gradient computation to drive the contours effectively. An active shape model based on a statistical approach constrained by point distribution,20 has been presented to drive the active contours effectively.21 A multiple level set implementation based on both region and edge gradient is also presented.22 Geodesic active contours23 have been shown to be quite effective segmentation approach.24 A novel method of computing adaptive energy and integrating the shape, region and the boundary features have been presented.25,26 A region gradient based active model has also been proposed,27 which is based on an energy minimizing model.28
In this research, an improved edge based distance regularized level set (DRLS)29 active contour model has been adapted. Here, two important terms viz., forward and backward diffusion effects of contour evolution have been integrated in a distance regularization model. It results in reduced initialization with fewer iterations of contour evolution. The DRLS model is as shown in Eq.3

Here the distance regularization term is as shown in Eq.4

The term is the diffusion rate controlled by a positive or negative potential value pv indicating the forward and backward diffusion. The second term is the derivative of the external energy.
The basic idea of the work presented in this research is to obtain the region of interest by adapting a shape prior model to morphologically extract the foreground regions Froi.. A novel geometrical approach of obtaining the set of norms ni ϵ Nc to the curvature orthogonal to a tangent ti drawn over each ith boundary point, is adapted to compute the set of centroids Cg, representing the geometrical centers of each nuclei present in the region. The resultant of morphological processing based on the proposed shape prior is adapted to compute the energy gradient Ig, which represents the external driving force for the contour evolution. Hence, the DRLS contours implemented as multiple level sets are initialized at the centroids detected and made to evolve using the shape prior based gradient computed. Subsequent sections provide the description of the data set used and a detailed discussion of the various stages of the methodology, followed by experimentation and result analysis.
Materials and Methods
In this section, a description of the data set used followed by a detailed discussion on each stages of the methodology is presented.
Description of the dataset
The digitized images of H&E stained histopathological slides have been obtained from a standard collection provided by BreakHis dataset.30 The dataset represents the samples of surgical open biopsy(SOB) of benign and malignant breast cancer tissues. A total of 200 images representing adenosis of benign and ductal carcinoma of malignant samples, at a zooming level of 400x have been chosen for experimentation. Fig.1 shows the sample images of both clinical representations.
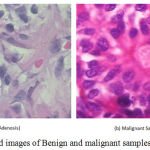 |
Figure 1: H&E stained images of Benign and malignant samples at 400X zoom.
|
The images represented as a 2-D grid M, are considered at a resolution of 700×460. The various stages of methodology, as discussed in the following section, have been applied to achieve the above listed objectives. Throughout this research many notation have been used as listed in Table.1
Table 1: List of symbols and notations used in this research
| Symbol | Description | Symbol | Description |
| Is | 2-D image scene | M | 2-D image grid |
| χ | Pixel intensity function | ω | RGB vector |
| Cg | Set of centroids | ci | Centroid of each nuclei |
| Xi | Points of intersecting norms | Nc | Set of norms orthogonal to the tangent over the curve |
| Tc | Set of the tangents drawn on the boundary points of the curve (Bc) | Aregion | Total area of ROI |
| Aavg | Average nuclei area | Φ(u) | Level set function of the contour u |
| fG | Gradient function | D | Diffusion rate of DRLS |
| Froi | Foreground region of interest | Ig | Energy gradient |
| sf | Signal frequency of the image | N | Noise component |
| Dcf | Denoised signal co-efficient | β,γ | Structural elements for erosion and dilation |
Proposed Methodology
In this section, various stages of the proposed method has been presented in detail. Algorithm 1 shows the complete illustration of the various phases involved.
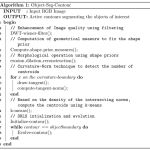 |
Scheme 1
|
Image Enhancement
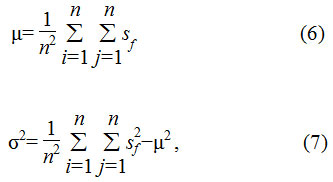
The H&E stained image inherently presents both low and high frequency noise components, due to staining and zooming errors. Hence, Wiener filter is considered to be the promising technique in eliminating both the components. The frequency sub-bands, sf, are separated from noise components N=(slow,shigh) and a denoised signal co-effiecient Dcf can be computed as shown in Eq. 5

Where μ and σ2 represents mean and variance of the signal component computed as shown in Eq. 6 and 7
A discrete wavelet transform (DWT) of the original signal component splits the signal into various spatial bands and separates both low and high frequency noise bands from the image as shown in Eq. 8 and 9.
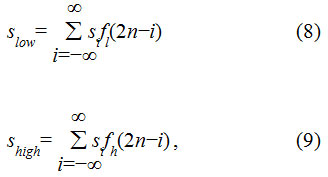
The idea of integrating Weiner filter with DWT results in an efficient filtering of the noise components.31 It has also been shown that DWT results in reduced over-segmentation.32
Computation of Shape prior
In this phase, the foreground region of interest Froi is extracted using a suitable shape prior model representing the structural element β and γ, to compute the area of the nuclei objects to be detected. The shape prior model is as shown as shown in Eq. 10 and 11.

The parameters μD and σD are the mean and standard deviation of the nuclei diameter, which is derived from the mean area of the foreground objects obtained from the outcome of the clusters generated using k-means algorithm. The area computed by β and γ are used with erosion and dilation process respectively. The parameter α corresponds to the thresholding factor for dilation. These morphological operations generates the foreground scene from which the image gradient Ig is computed. Binarization of the same results in the extraction of ROI.
Centroid detection
After obtaining the ROI from the previous stage, the detection of the existence of the nuclei is performed in this stage. As presented earlier, the novel curvature-norm technique is adapted to extract the centroid of the nuclei. Fig. 2 shows the outcome of the method over an occluded region. It shows the generation of norms over the boundary points of the curve and finally showing the centroid points of the number of nuclei present in the region.
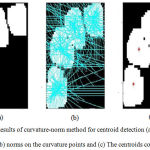 |
Figure 2: Results of curvature-norm method for centroid detection (a) Occluded region (b) norms on the curvature points and (c) The centroids computed. |
The computation of the centroids is achieved using k-means clustering applied over the intersecting points of the norms. Here, the value of k is computed as shown in Eq. 1. Finally, the DRLS contours are initialized as multiple level set functions at the centroids detected and the evolution of the same is guided by the image gradient Ig, which is computed as discussed above.
Results and Discussion
The proposed methodology is experimented over 200 images selected from both benign and malignant samples in the dataset chosen. Fig.3 shows the results of each stages and the final outcome of the segmentation approach proposed.
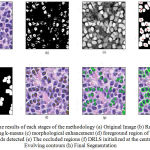 |
Figure 3: The results of each stages of the methodology (a) Original Image (b) Region of interest using k-means (c) morphological enhancement (d) foreground region of interest with centroids detected (e) The occluded regions (f) DRLS initialized at the centroids (g) Evolving contours (h) Final Segmentation. |
The proposed method DRLS with curvature-norm initialization (DRLS-CN) outperforms the DRLS without curvature-norm initialization.
Quantitative analysis
The efficacy of the proposed methodology has been studied using following two quantitative measures. First, object detection and occlusion resolution measures and, second, segmentation accuracy based on boundary error metrics. The object detection measures are computed using sensitivity (SN), specificity (SP), positive predictive value (PPV), and the overlap resolution (OR). Based on the ground truth, the above measures are computed using true positive (TP), true negative (TN), false positive (FP) and false negative (FN).24 Since, the manual delineation performed by the pathologist is tedious, only 40 samples have been considered for quantitative analysis. A comparative results of DRLS segmentation with and without curvature-norm initialization is presented in Table.2
Table 2: Object detection and overlap measures for DRLS-CN and DRLS
| SN | SP | PPV | OR | |
| DRLS-CN | 0.97 | 0.74 | 0.82 | 0.78 |
| DRLS | 0.92 | 0.66 | 0.81 | 0.70 |
The chart shown in Fig. 4 indicates the other two measures of object detection and overlap resolution viz., actual count (AC) and detected count (DC).24 These measures are computed by taking the average of 20 randomly chosen objects.
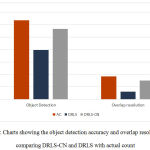 |
Figure 4: Charts showing the object detection accuracy and overlap resolution by comparing DRLS-CN and DRLS with actual count. |
Second, the measures of segmentation accuracy is computed using following two metrics.33 They are Hausdorff distance (HD) and Mean absolute distance (MAD) as shown in Eq. 12 and Eq. 13.
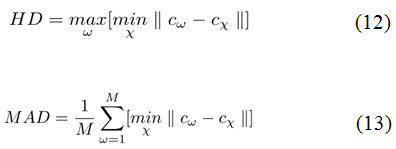
The key factor for computing the above measures is the distance in terms of pixel difference between the manual delineation performed over the object boundary and the final contour. Since the manual delineation is a tedious task, pathologists have randomly chosen 20 objects for ground truth generation. These measures have been plotted in the charts shown in Fig.5 and Fig.6, in comparison with the Geodesic active contours driven by curvature-norm initialization. The proposed DRLS-CN has shown a very less pixel difference of utmost 4 pixels in contrast with that of GAC-CN, which measures in a range of 2-14 pixels. It is clearly evident from the result, that DRLS-CN outperforms GAC-CN in terms of segmentation accuracy.
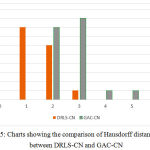 |
Figure 5: Charts showing the comparison of Hausdorff distance (HD) between DRLS-CN and GAC-CN. |
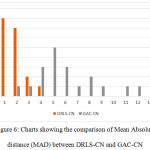 |
Figure 6: Charts showing the comparison of Mean Absolute distance (MAD) between DRLS-CN and GAC-CN. |
Conclusion
The work presented in this research, has been able to address the importance of extracting the pleomorphic features for the purpose of diagnosis and prognosis of the cancer disease. An improved active contour technique has been adapted to perform the challenging task of segmenting the nuclei from an occluded region of a digitized H&E stained image. Here, a novel curvature-norm technique is devised to compute the geometric centroid of the occluded object and the DRLS contours are initialized at those centroids to evolve towards the object boundary to segment the nuclei shape resulting in pleomorphic features. Initially, the region of interest is extracted using a novel shape prior model, which is also used to compute the image gradient, representing the external energy in driving the DRLS contour efficiently towards the object boundary. Hence, this work has been able to present two novel techniques. First, The shape prior model and second, the curvature-norm technique for centroid detection. The results of the segmentation have been compared with other techniques and found to be quite promising in terms of object detection, overlap resolution and also with respect to segmentation accuracy. Further, the results can be extended for the post segmentation classification process.
References
- Khan A. M, El-Daly H, Simmons E and Rajpoot N.M. A hybrid magnitude-phase approach to unsupervised segmentation of tumor areas in breast cancer histology images. J. Pathol. Inform. 2013 Mar;4:7.
- Shu J, Fu H, Qiu G, Kaye P and Ilyas M. Segmenting over alapping cell nuclei in digital his to pathology images. in Proc. IEEE 35th Annu. Int. Conf. Eng. Med. Biol. Soc. Osaka, Japan. 2013 Jul;3–7:5445–5448.
- Zhang X, Xing F, Su H, Yang L and Zhang S. High-throughput histopathological image analysis via robust cell segmentation and hashing. Medical image analysis. 2015;26(1):306-315.
CrossRef - Jing J, Wan T, Cao J and Qin Z. An improved hybrid active contour model for nuclear segmentation on breast cancer histopathology. In Biomedical Imaging (ISBI), 2016 IEEE 13th International Symposium on. IEEE. 2016 April;1155-1158.
CrossRef - Xu H, Wang H, Berendt R, Jha N and Mandai M. Automated nuclear segmentation in skin histopathological images using multi-scale radial line scanning. In Healthcare Innovation Point-Of-Care Technologies Conference (HI-POCT), 2016 IEEE. IEEE. 2016 November;175-178.
CrossRef - Xu H, Lu C, Berendt R, Jha N and Mandal M. Automatic Nuclear Segmentation Using Multiscale Radial Line Scanning With Dynamic Programming. IEEE Transactions on Biomedical Engineering. 2017;64(10):2475-2485.
CrossRef - Wang P, Hu X, Li Y, Liu Q and Zhu X. Automatic cell nuclei segmentation and classification of breast cancer his to pathology images. Signal Processing. 2016;122:1-13.
- CrossRef
- Prasath V.S, Fukuma K, Aronow B.J and Kawanaka H. Cell nuclei segmentation in gliom a his to pathology images with color decomposition based active contours. In Bioinformatics and Biomedicine (BIBM), 2015 IEEE International Conference on. IEEE. 2015 November;1734-1736.
- Zhang P, Wang F, Teodoro G, Liang Y, Brat D and Kong J. Automated level set segmentation of his to pathologic cells with sparse shape prior support and dynamic occlusion constraint. In Proceedings. IEEE International Symposium on Biomedical Imaging. NIH Public Access. 2017, April;2017:718.
- Vink J , Leeuwen M.V, Deurzen C. V and Haan G. Efficient nucleus detector in his to pathology images. J. Microsc. 2013;249(2):124–135.
CrossRef - Chen H, Qi X, Yu L, Dou Q, Qin J and Heng P.A. Deep contour-aware networks for object instance segmentation from histology images. Medical image analysis. 2017 DCAN;36:135-146.
- Janowczyk A, Doyle S, Gilmore H and Madabhushi A. A resolution adaptive deep hierarchical (RADHicaL) learning scheme applied to nuclear segmentation of digital pathology images. Computer Methods in Biomechanics and Biomedical Engineering. Imaging & Visualization. 2018;6(3):270-276.
CrossRef - Irshad H, Veillard A, Roux L. et al. Methods for nuclei detection, segmentation, and classification in digital histopathology: a reviewcurrent status and future potential. IEEE reviews in biomedical engineering. 2014;7:97–114.
CrossRef - Xing F and Yang L. Robust nucleus/cell detection and segmentation in digital pathology and microscopy images: a comprehensive review. IEEE reviews in biomedical engineering. 2016;9:234–263.
CrossRef - Vink J.M. Leeuwen V.C, Deurzen V et al. Efficient nucleus detector in histopathology images. Journal of microscopy. 2013;249(2):124–135.
- Faridi P, Danyali H, Helfroush M.S et al., Cancerous nuclei detection and scoring in breast cancer his to pathological images. arXiv preprint arXiv. 2016;1612:01237
- Morote A. Nuclear detection in histopathology images. Thesis work. 2010.
- Sirinukunwattana K, S, Raza E. A, Tsang Y.W. et al., Locality sensitive deep learning for detection and classification of nuclei in routine colon cancer histology images. IEEE transactions on medical imaging. 2016;35(5):1196–1206.
CrossRef - Kass M, Witkin A and Terzopoulos D. Snakes: Active contour models. International journal of computer vision. 1988;1(4);321–331.
CrossRef - Chan T and Zhu W. Level set based shape prior segmentation, in Computer Vision and Pattern Recognition, 2005. CVPR 2005. IEEE Computer Society Conference on. IEEE. 2005.
- Ali S and Madabhushi A. Active contour for overlap resolution using watershed based initialization (acorew): Applications to his to pathology, in Biomedical Imaging: From Nano to Macro, 2011 IEEE International Symposium on, IEEE. 2011;614–617.
- Ali S and Madabhushi A. Segmenting multiple overlapping objects via a hybrid active contour model incorporating shape priors: applications to digital pathology, in SPIE Medical Imaging,International Society for Optics and Photonics. 2011;79622–79622.
CrossRef - Caselles V, Kimmel R and Sapiro G.Geodesic active contours. International journal of computer vision. 1997;22(1):61–79.
CrossRef - Fatakdawala H, Xu J, Basavanhally A. et al., Expectation–maximization-driven geodesic active contour with overlap resolution (emagacor): Application to lymphocyte segmentation on breast cancer his to pathology. IEEE Transactions on Biomedical Engineering 2010;57(7):1676–1689.
CrossRef - Ali S, Veltri R, Epstein J et al., Adaptive energy selective active contour with shape priors for nuclear segmentation and gleason grading of prostate cancer. Medical Image Computing and Computer-Assisted Intervention–MICCAI. 2011;2011:661–669.
CrossRef - Ali S and Madabhushi A. An integrated region-, boundary-, shape-based active contour for multiple object overlap resolution in histological imagery. IEEE transactions on medical imaging. 2012;31(7):1448–1460.
CrossRef - Chan T. F and Vese L. A. Active contours without edges. IEEE Transactions on image processing. 2001;10(2):266–277.
CrossRef - Mumford D and Shah J. Optimal approximations by piecewise smooth functions and associated variational problems. Communications on pure and applied mathematics. 1989;42(5):577–685.
CrossRef - Li C, Xu C, Gui C. et al., Distance regularized level set evolution and its application to image segmentation. IEEE Transactions on image processing. 2010;19(12):3243–3254.
CrossRef - Spanhol F. A, Oliveira L. S, Petitjean C. et al., A dataset for breast cancer his to pathological image classification. IEEE Transactions on Biomedical Engineering. 2016;63(7):1455–1462.
CrossRef - Siddeq M. M and . Yaba D. S. P. Using discrete wavelet transform and wiener filter for image de-nosing. Wasiit Journall for Sciience Mediiciine. 2009;2(2):18–30.
- Proch A,azka, Vysata O and Jerhotova E. Wavelet use for reduction of watershed transform over-segmentation in biomedical images processing, in Information Technology and Applications in Biomedicine (ITAB), 2010 10th IEEE International Conference on, IEEE. 2010;1–4.
- Madabhushi A and Metaxas D. N. Combining low-, high-level and empirical domain knowledge for automated segmentation of ultrasonic breast lesions. IEEE transactions on medical imaging. 2003;22(2):155–169.
CrossRef


