
Manuscript accepted on :March 19, 2018
Published online on: --
Plagiarism Check: Yes
Rejith K. N1 and Kamalraj Subramaniam2
1Research scholar, Karpagam university, Coimbatore India.
2Faculty of Engineering, Karpagam University, India.
Corresponding Author E-mail: rejith_kn@yahoo.com
DOI : https://dx.doi.org/10.13005/bpj/1377
Abstract
Individuals with Parkinson’s disease have been stressed and shown difficulty in various emotion recognition. In recent years, numerous studies have been conducted in emotion recognition of Parkinson’s disease (PD). EEG signals helps to find out the connections between emotional condition and its brain activities. In this paper, classification of EEG based emotion recognition in Parkinson’s disease was analyzed using four features and two classifiers. Six emotional EEG stimuli such as happiness, sadness, fear, anger, surprise, and disgust were used to categorize the PD patients and healthy controls (HC). For each EEG signal, the alpha, beta and gamma band frequency features are obtained for four different feature extraction methods (Entropy, Energy-Entropy, Spectral Entropy and Spectral Energy-Entropy). The extracted features are then associated to different control signals and two different models (Probabilistic Neural Network and K-Nearest Neighbors Algorithm) have been developed to observe the classification accuracy of these four features. The proposed combination feature, Energy–Entropy feature performs evenly for all six emotions with accuracy of above 80% when compared to other features, whereas different features with classifier gives variant results for few emotions with highest accuracy of above 95%.
Keywords
Cognitive Deficit; Electroencephalogram; Emotion; Emotional Deficits; Non-Linear Methods; Parkinson’s Disease
Download this article as:| Copy the following to cite this article: Rejith K. N, Subramaniam K. Classification of Emotional States in Parkinson’s Disease Patients using Machine Learning Algorithms. Biomed Pharmacol J 2018;11(1). |
| Copy the following to cite this URL: Rejith K. N, Subramaniam K. Classification of Emotional States in Parkinson’s Disease Patients using Machine Learning Algorithms. Biomed Pharmacol J 2018;11(1). Available from: http://biomedpharmajournal.org/?p=19602 |
Introduction
Electroencephalogram (EEG) signals or brain signals are used widely to diagnose epilepsy, sleep disorders, depth of anesthesia, coma, encephalopathy, and brain death and also for detecting tumors, stroke and other focal brain disorders as front line method. Other applications like developing brain machine interface using motor signals and Parkinson’s individual’s emotional recognition were researched diversely in recent years. In patients, emotional processing with disorder were analyzed using neuroimaging techniques such as functional magnetic resonance imaging (fMRI) and positron emission tomography (PET) and these techniques helps to identify the specific region of emotional functions.1 In previous research works, emotional processing in patients with disorder were analyzed using neuroimaging techniques such as functional magnetic resonance imaging (fMRI) and positron emission tomography (PET) and these techniques helps to identify the specific region of emotional functions.1 It is also noted that the right hemisphere is involved with positive emotions such as happiness and surprise and the left hemisphere is involved with negative emotions such as sad, anger, fear, and disgust.2 Various researchers have shown their interest on motor and cognitive impairments in neurological disorder people. Later on, researchers have focused on investigating the emotional conditions in people with neurological disorders.3
In the previous study, researchers have focused emotional investigations in various neurological disorders such as Parkinson’s disease, Stroke, Huntington’s disease, and Alzheimer’s disease. In this article, we focused and reviewed on emotional recognition of Parkinson’s disease individuals. Patients with Parkinson’s disease (PD) have central nervous system disorder which affects motor system with low voluntary muscle controls, sleep issues and behavior problems. Such people lead to depression and anxiety with high emotional behavior. PD individual’s emotional states and their abilities in recognition of emotion were analyzed in this study.
In PD emotion investigation, researchers have used various analyzing techniques based on EEG signals using visual stimuli, audio stimuli, audio-visual stimuli and speech prosody analysis. In early stage of PD emotion analysis, various researches were conducted on analyzing right-hemisphere disease (RHD) individuals and left-hemisphere disease (LHD) individuals.5,6 Later five distinct emotional studies were conducted such as happiness, (pleasant) surprise, anger, disgust, and sadness and emotional data were recorded using unfamiliar face expressions.8,9,11,15 Further few researchers analyzed on six emotional studies (happiness, sadness, fear, anger, surprise, and disgust) on PD and HC individuals [13, 17,18]. The rest of the paper is organized as follows: Section II describes the data collection and feature extraction method. Section III illustrates the designed network model and its performances. Section IV and V presents the results and conclusion, showing the results of Emotional EEG signals.
Feature Extraction
Protocol and Data Collection
Database of twenty non-demented PD patients and 20 healthy controls viewed emotional stimuli with fourteen-channel EEG recording were used in this study.16 Twenty non-demented PD patients (10men and 10women) and 20 healthy controls (9 men and 11 women) matched for age (range from 40 to 65 years), education level, and gender participated in the study. The PD patients were recruited through the Neurology Unit outpatient service at the Department of Medicine of the Hospital University Kebangsaan Malaysia (HUKM) medical center in Kuala Lumpur, Malaysia. All of them had been diagnosed with Idiopathic PD by a neurologist. Patients who had coexisting neurological disturbances (e.g., epilepsy, stroke) or who had undergone deep brain stimulation were not included in the study. The HC participants were recruited through the hospital community and/or from relatives of PD patients. Multimodal stimulus (combination of audio and visual) was used to evoke the emotions. To classify the EEG-based emotional states and visualize the changes of emotional states over time, this paper compares four kinds of EEG features for emotional state classification.
Feature Extraction Process
In this section, feature extraction processes using spectral features are described and carried out. Four features namely Entropy, Energy-Entropy, Spectral Entropy and Spectral Energy-Entropy were proposed and analyzed based on the statistical approach [16]. First the raw EEG data was preprocessed and then feature extraction was performed. The recorded signals were segmented into number of frames with a overlapping of 75% [11]. Each frame has 1280 samples (corresponding to 10 second). The segmented signals were then filtered using pass band elliptic filters and the alpha (7 to 14 Hz), beta (14 to 21 Hz) and gamma (21 to 34 Hz) from all the 14 channels1,11 were obtained.
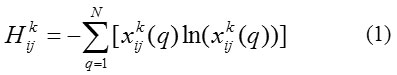
Entropy (EN) value is calculated using the Shannon entropy. From the filtered values, the entropy feature is calculated using the Equation (1),
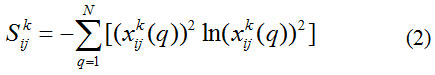
Energy- Entropy (EEN) value is calculated using the power values of Shannon entropy. From the filtered values, the EEN feature is calculated using the Equation (2),
For Spectral Entropy (SEN) feature extraction process, from the filtered values, x(q) were first Fourier transformed to using the Equation (3),
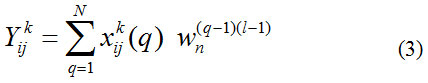
where
![]()
is the complex exponential and N is the total number of data in the filtered signal. From the Fourier transformed signal Y (m), the SEN value is calculated using Equation (4),
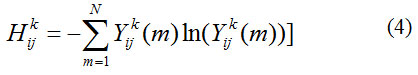
Where N = 128, is the number of samples.
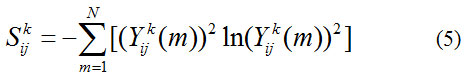
Then the Spectral Energy- Entropy(EEN) value is calculated using the power values of Spectral entropy. From the filtered values, the EEN feature is calculated using the Equation (5),
Similarly, the features corresponding to the PD and HC performed by all the twenty subjects (for all trials) were extracted using fourteen channels. Each frame has 42 (14 channels x 3 bands) feature values and it is given as input to the network model.
Feature Classification
K-Nearest Neighbor Algorithm
In pattern recognition, the k-nearest neighbor algorithm (KNN) is a non-parametric method used for classification and regression. In k-NN classification, the output is a class membership. An object is classified by a majority vote of its neighbors, with the object being assigned to the class most common among its k nearest neighbors (k is a positive integer, typically small). If k = 1, then the object is simply assigned to the class of that single nearest neighbor. For this KNN model same 42 input values were given and the accuracy results of each emotion (happiness-E1, sadness-E2, fear-E3, anger-E4, surprise-E5, and disgust-E6) and the corresponding smoothing parameter (K) ranges from 1 to 10 are tabulated in Table 1a, 1b, 1c and 1d.
Table 1a: Results of SpectralEntropy feature using KNN classifier
| K | E1 | Time(s) | E2 | Time(s) | E3 | Time(s) | E4 | Time(s) | E5 | Time(s) | E6 | Time(s) |
| 1.00 | 80.74 | 1.81 | 89.32 | 1.54 | 86.22 | 1.51 | 80.20 | 1.54 | 88.04 | 1.51 | 84.66 | 1.54 |
| 2.00 | 80.74 | 1.31 | 89.32 | 1.10 | 86.22 | 1.10 | 80.20 | 1.07 | 88.04 | 1.08 | 84.66 | 1.09 |
| 3.00 | 80.68 | 1.07 | 89.26 | 0.91 | 85.68 | 0.92 | 80.41 | 0.91 | 87.09 | 0.91 | 86.42 | 0.91 |
| 4.00 | 81.01 | 1.13 | 89.19 | 0.94 | 85.74 | 0.93 | 80.41 | 0.95 | 87.43 | 0.93 | 85.95 | 0.93 |
| 5.00 | 80.34 | 1.01 | 89.59 | 0.91 | 85.34 | 0.91 | 80.68 | 0.92 | 86.01 | 0.92 | 85.95 | 0.92 |
| 6.00 | 80.95 | 1.06 | 89.93 | 0.95 | 85.68 | 0.95 | 80.34 | 0.93 | 86.28 | 0.93 | 85.61 | 0.92 |
| 7.00 | 80.81 | 1.04 | 89.93 | 0.96 | 85.95 | 0.88 | 79.93 | 0.91 | 85.54 | 0.93 | 86.28 | 0.94 |
| 8.00 | 80.74 | 1.11 | 89.80 | 0.96 | 85.88 | 0.94 | 80.20 | 0.94 | 86.15 | 0.93 | 85.61 | 0.95 |
| 9.00 | 81.08 | 1.22 | 90.14 | 0.96 | 85.68 | 0.92 | 79.86 | 0.92 | 85.27 | 0.95 | 86.08 | 0.94 |
| 10.00 | 81.08 | 1.25 | 90.20 | 0.96 | 85.74 | 0.97 | 80.00 | 0.95 | 85.47 | 0.95 | 85.74 | 0.96 |
| MAX% | 81.08 | 1.81 | 90.20 | 1.54 | 86.22 | 1.51 | 80.68 | 1.54 | 88.04 | 1.51 | 86.42 | 1.54 |
Table 1b: Results of Entropy feature using KNN
| Spread Factor | E1 | Time(s) | E2 | Time(s) | E3 | Time(s) | E4 | Time(s) | E5 | Time(s) | E6 | Time(s) |
| 0.55 | 95.97 | 8.71 | 68.46 | 9.18 | 63.94 | 9.63 | 65.77 | 9.70 | 67.89 | 9.16 | 70.15 | 8.54 |
| 0.56 | 95.73 | 7.64 | 68.70 | 8.46 | 64.47 | 8.47 | 65.99 | 8.38 | 68.15 | 7.73 | 70.24 | 8.07 |
| 0.57 | 95.51 | 7.58 | 68.81 | 8.37 | 65.07 | 8.53 | 66.32 | 8.46 | 68.28 | 8.49 | 70.44 | 7.39 |
| 0.58 | 95.35 | 7.58 | 68.88 | 8.46 | 65.55 | 8.46 | 66.67 | 8.49 | 68.44 | 8.50 | 70.53 | 7.38 |
| 0.59 | 95.24 | 7.67 | 68.88 | 8.46 | 66.01 | 8.47 | 66.92 | 8.51 | 68.57 | 8.30 | 70.59 | 7.39 |
| 0.60 | 95.04 | 7.77 | 68.99 | 8.43 | 66.34 | 8.44 | 67.11 | 8.41 | 68.68 | 8.38 | 70.75 | 7.69 |
| 0.61 | 94.98 | 7.78 | 68.74 | 8.53 | 66.76 | 8.45 | 67.42 | 8.48 | 68.66 | 8.30 | 70.77 | 7.42 |
| 0.62 | 94.89 | 8.41 | 68.66 | 8.36 | 67.03 | 8.50 | 68.04 | 8.51 | 68.72 | 8.31 | 70.75 | 7.49 |
| 0.63 | 94.87 | 8.49 | 68.57 | 8.41 | 67.33 | 8.47 | 68.08 | 8.47 | 68.77 | 8.29 | 70.75 | 7.85 |
| 0.64 | 94.85 | 8.53 | 68.50 | 8.47 | 67.60 | 8.42 | 68.15 | 8.48 | 68.70 | 8.42 | 70.68 | 7.47 |
| 0.65 | 94.82 | 8.49 | 68.26 | 8.36 | 67.69 | 8.41 | 68.35 | 8.71 | 68.74 | 9.06 | 70.68 | 7.46 |
| MAX% | 95.97 | 8.71 | 68.99 | 9.18 | 67.69 | 9.63 | 68.35 | 9.70 | 68.77 | 9.16 | 70.77 | 8.54 |
Table 1c: Results of Energy Entropy feature using KNN
| K | E1 | Time(s) | E2 | Time(s) | E3 | Time(s) | E4 | Time(s) | E5 | Time(s) | E6 | Time(s) |
| 1.00 | 80.00 | 0.46 | 89.53 | 0.47 | 87.16 | 0.49 | 81.08 | 0.46 | 86.62 | 0.47 | 85.88 | 0.48 |
| 2.00 | 80.00 | 0.32 | 89.53 | 0.32 | 87.16 | 0.34 | 81.08 | 0.32 | 86.62 | 0.35 | 85.88 | 0.34 |
| 3.00 | 80.47 | 0.27 | 89.80 | 0.28 | 86.42 | 0.29 | 80.81 | 0.28 | 86.15 | 0.27 | 86.22 | 0.27 |
| 4.00 | 80.74 | 0.27 | 89.46 | 0.27 | 86.62 | 0.29 | 81.15 | 0.28 | 86.69 | 0.28 | 86.08 | 0.28 |
| 5.00 | 81.15 | 0.27 | 90.07 | 0.28 | 86.69 | 0.28 | 81.15 | 0.28 | 86.01 | 0.27 | 86.15 | 0.27 |
| 6.00 | 81.08 | 0.28 | 89.80 | 0.28 | 86.82 | 0.29 | 80.95 | 0.28 | 86.49 | 0.28 | 86.15 | 0.30 |
| 7.00 | 81.01 | 0.27 | 90.41 | 0.28 | 86.76 | 0.28 | 80.95 | 0.28 | 85.54 | 0.27 | 86.01 | 0.27 |
| 8.00 | 81.08 | 0.28 | 90.41 | 0.28 | 86.69 | 0.28 | 81.01 | 0.28 | 86.08 | 0.30 | 86.22 | 0.27 |
| 9.00 | 81.08 | 0.28 | 90.74 | 0.28 | 86.69 | 0.28 | 80.95 | 0.28 | 85.27 | 0.29 | 86.28 | 0.28 |
| 10.00 | 81.15 | 0.28 | 90.68 | 0.29 | 86.89 | 0.29 | 80.88 | 0.29 | 85.81 | 0.30 | 86.28 | 0.27 |
| MAX% | 81.15 | 0.46 | 90.74 | 0.47 | 87.16 | 0.49 | 81.15 | 0.46 | 86.69 | 0.47 | 86.28 | 0.48 |
Table 1d: Results of Spectral Energy-Entropy feature
| K | E1 | Time(s) | E2 | Time(s) | E3 | Time(s) | E4 | Time(s) | E5 | Time(s) | E6 | Time(s) |
| 1.00 | 58.18 | 0.47 | 74.32 | 0.43 | 94.80 | 0.44 | 85.88 | 0.46 | 93.38 | 0.46 | 79.46 | 1.61 |
| 2.00 | 58.18 | 0.31 | 74.32 | 0.32 | 94.80 | 0.30 | 85.88 | 0.32 | 93.38 | 0.31 | 79.46 | 1.22 |
| 3.00 | 58.18 | 0.26 | 73.11 | 0.26 | 95.07 | 0.26 | 86.28 | 0.27 | 93.99 | 0.27 | 82.70 | 0.98 |
| 4.00 | 58.04 | 0.26 | 73.51 | 0.27 | 95.00 | 0.26 | 86.22 | 0.27 | 94.12 | 0.26 | 81.89 | 0.97 |
| 5.00 | 58.85 | 0.26 | 73.72 | 0.26 | 94.93 | 0.26 | 86.35 | 0.27 | 94.53 | 0.26 | 82.97 | 1.01 |
| 6.00 | 58.58 | 0.26 | 73.99 | 0.27 | 94.93 | 0.26 | 86.15 | 0.27 | 94.32 | 0.27 | 82.23 | 0.94 |
| 7.00 | 58.24 | 0.26 | 75.20 | 0.26 | 94.73 | 0.26 | 86.22 | 0.27 | 94.32 | 0.27 | 82.97 | 0.99 |
| 8.00 | 58.24 | 0.27 | 74.86 | 0.27 | 94.66 | 0.26 | 86.08 | 0.28 | 94.32 | 0.28 | 82.64 | 0.98 |
| 9.00 | 58.11 | 0.27 | 75.00 | 0.27 | 94.46 | 0.26 | 87.16 | 0.27 | 93.92 | 0.27 | 83.45 | 0.95 |
| 10.00 | 58.11 | 0.27 | 74.80 | 0.28 | 94.53 | 0.27 | 86.32 | 0.27 | 93.78 | 0.27 | 83.04 | 1.01 |
| MAX% | 58.85 | 0.47 | 75.20 | 0.43 | 95.07 | 0.44 | 87.16 | 0.46 | 94.53 | 0.46 | 83.45 | 1.61 |
Probabilistic Neural Network
To discriminate the PD and HC for six different emotions, probabilistic neural network (PNN) has been developed. PNN is a supervised neural network proposed by Donald F. Specht19,20 and it is a kind of radial basis network suitable for classification problems. The PNN is a direct continuation of the work based on Bayesian classification and classical estimators for probability density function. The only factor that needs to be selected for training is the smoothing factor/spread factor which affects the classification accuracy. The network structure of PNNs is similar to that of back propagation12,13; the primary difference is that uses exponential activation function instead of sigmoid activation function and also the training time is lesser compared to multi-layer feed forward network trained by back propagation algorithm.
The probabilistic neural net consists of four types of units, namely, input units, pattern units, summation units, and an output unit. The pattern unit computes distances from the input vector to the training input vectors. when an input is presented, it produces a vector whose elements indicate how close the input is to a training input. The summation unit sums these contributions for each class of inputs to produce as its net output a vector of probabilities. Finally, a complete transfer function on the output of the second layer picks the maximum of these probabilities, and produces a 1 for that class and a 0 for the other classes. Furthermore, the shape of the decision surface can be made as complex as necessary, or as simple as desired, by choosing an appropriate value of the smoothing parameter. In this paper, PNN architecture and the feature extraction process are constructed and analysed using MATLAB software. This problem requires 42 input neurons. The accuracy results of each emotion and the corresponding best smoothing parameter (K) ranges from 0.55 to 0.65 are tabulated in Table 2a, 2b, 2c and 2d.
Table 2a: Results of Entropy feature using PNN classifier
| Spread Factor | E1 | Time(s) | E2 | Time(s) | E3 | Time(s) | E4 | Time(s) | E5 | Time(s) | E6 | Time(s) |
| 0.55 | 56.35 | 2.32 | 90.68 | 1.93 | 84.80 | 1.97 | 86.96 | 2.05 | 86.82 | 2.36 | 87.03 | 2.11 |
| 0.56 | 56.35 | 0.82 | 90.68 | 0.67 | 84.80 | 0.68 | 86.96 | 0.84 | 86.82 | 0.80 | 87.03 | 0.69 |
| 0.57 | 56.35 | 0.86 | 90.68 | 0.64 | 84.80 | 0.63 | 86.89 | 0.76 | 86.82 | 0.67 | 87.03 | 0.72 |
| 0.58 | 56.35 | 0.99 | 90.68 | 0.62 | 84.80 | 0.66 | 86.89 | 0.91 | 86.82 | 0.76 | 87.03 | 0.66 |
| 0.59 | 56.35 | 0.83 | 90.68 | 0.65 | 84.80 | 0.61 | 86.89 | 0.69 | 86.82 | 1.01 | 87.03 | 0.68 |
| 0.60 | 56.42 | 0.92 | 90.68 | 0.60 | 84.80 | 0.63 | 86.89 | 0.70 | 86.82 | 1.08 | 87.03 | 0.69 |
| 0.61 | 56.42 | 0.80 | 90.68 | 0.63 | 84.80 | 0.64 | 86.89 | 0.56 | 86.69 | 0.87 | 87.03 | 0.70 |
| 0.62 | 56.42 | 0.96 | 90.68 | 0.65 | 84.80 | 0.62 | 86.89 | 0.61 | 86.69 | 1.36 | 87.03 | 0.72 |
| 0.63 | 56.42 | 0.87 | 90.68 | 0.62 | 84.80 | 0.64 | 86.89 | 0.62 | 86.69 | 0.66 | 87.03 | 0.73 |
| 0.64 | 56.42 | 0.87 | 90.68 | 0.64 | 84.86 | 0.65 | 86.89 | 0.59 | 86.69 | 0.70 | 87.03 | 0.66 |
| 0.65 | 56.49 | 1.05 | 90.68 | 0.63 | 84.86 | 0.61 | 86.89 | 0.59 | 86.69 | 0.64 | 87.03 | 0.60 |
| MAX% | 56.49 | 2.32 | 90.68 | 1.93 | 84.86 | 1.97 | 86.96 | 2.05 | 86.82 | 2.36 | 87.03 | 2.11 |
Table 2b: Results of Spectral Entropy feature using PNN
| Spread Factor | E1 | Time(s) | E2 | Time(s) | E3 | Time(s) | E4 | Time(s) | E5 | Time(s) | E6 | Time(s) |
| 0.55 | 95.97 | 8.71 | 68.46 | 9.18 | 63.94 | 9.63 | 65.77 | 9.70 | 67.89 | 9.16 | 70.15 | 8.54 |
| 0.56 | 95.73 | 7.64 | 68.70 | 8.46 | 64.47 | 8.47 | 65.99 | 8.38 | 68.15 | 7.73 | 70.24 | 8.07 |
| 0.57 | 95.51 | 7.58 | 68.81 | 8.37 | 65.07 | 8.53 | 66.32 | 8.46 | 68.28 | 8.49 | 70.44 | 7.39 |
| 0.58 | 95.35 | 7.58 | 68.88 | 8.46 | 65.55 | 8.46 | 66.67 | 8.49 | 68.44 | 8.50 | 70.53 | 7.38 |
| 0.59 | 95.24 | 7.67 | 68.88 | 8.46 | 66.01 | 8.47 | 66.92 | 8.51 | 68.57 | 8.30 | 70.59 | 7.39 |
| 0.60 | 95.04 | 7.77 | 68.99 | 8.43 | 66.34 | 8.44 | 67.11 | 8.41 | 68.68 | 8.38 | 70.75 | 7.69 |
| 0.61 | 94.98 | 7.78 | 68.74 | 8.53 | 66.76 | 8.45 | 67.42 | 8.48 | 68.66 | 8.30 | 70.77 | 7.42 |
| 0.62 | 94.89 | 8.41 | 68.66 | 8.36 | 67.03 | 8.50 | 68.04 | 8.51 | 68.72 | 8.31 | 70.75 | 7.49 |
| 0.63 | 94.87 | 8.49 | 68.57 | 8.41 | 67.33 | 8.47 | 68.08 | 8.47 | 68.77 | 8.29 | 70.75 | 7.85 |
| 0.64 | 94.85 | 8.53 | 68.50 | 8.47 | 67.60 | 8.42 | 68.15 | 8.48 | 68.70 | 8.42 | 70.68 | 7.47 |
| 0.65 | 94.82 | 8.49 | 68.26 | 8.36 | 67.69 | 8.41 | 68.35 | 8.71 | 68.74 | 9.06 | 70.68 | 7.46 |
| MAX% | 95.97 | 8.71 | 68.99 | 9.18 | 67.69 | 9.63 | 68.35 | 9.70 | 68.77 | 9.16 | 70.77 | 8.54 |
Table 2c: Results of Spectral Energy-Entropy feature using PNN classifier
| Spread Factor | E1 | Time(s) | E2 | Time(s) | E3 | Time(s) | E4 | Time(s) | E5 | Time(s) | E6 | Time(s) |
| 0.55 | 96.80 | 27.12 | 66.33 | 25.74 | 60.68 | 27.08 | 64.55 | 27.20 | 66.24 | 27.18 | 68.29 | 25.56 |
| 0.56 | 96.61 | 25.86 | 66.88 | 24.94 | 61.07 | 26.04 | 64.92 | 26.78 | 66.47 | 26.49 | 68.61 | 25.63 |
| 0.57 | 96.44 | 26.00 | 67.37 | 24.50 | 61.43 | 25.87 | 65.19 | 26.31 | 66.75 | 26.00 | 68.91 | 25.88 |
| 0.58 | 96.32 | 25.82 | 67.81 | 24.86 | 61.87 | 25.96 | 65.35 | 26.00 | 67.04 | 25.97 | 69.11 | 25.66 |
| 0.59 | 96.15 | 25.58 | 68.16 | 24.41 | 62.29 | 26.09 | 65.56 | 25.69 | 67.21 | 26.58 | 69.41 | 26.38 |
| 0.60 | 95.99 | 25.68 | 68.55 | 24.80 | 62.69 | 25.94 | 65.87 | 25.07 | 67.47 | 25.95 | 69.53 | 25.88 |
| 0.61 | 95.87 | 26.08 | 68.93 | 24.71 | 63.08 | 26.20 | 66.09 | 23.95 | 67.60 | 26.19 | 69.79 | 26.35 |
| 0.62 | 95.76 | 25.93 | 69.09 | 25.05 | 63.40 | 24.65 | 66.41 | 25.95 | 67.87 | 25.79 | 69.89 | 26.23 |
| 0.63 | 95.63 | 25.63 | 69.19 | 26.15 | 63.73 | 24.13 | 66.71 | 26.15 | 67.97 | 26.59 | 69.92 | 25.98 |
| 0.64 | 95.57 | 25.92 | 69.21 | 26.27 | 64.20 | 25.25 | 66.88 | 25.80 | 68.09 | 25.92 | 70.00 | 26.49 |
| 0.65 | 96.80 | 27.12 | 66.33 | 25.74 | 60.68 | 27.08 | 64.55 | 27.20 | 66.24 | 27.18 | 68.29 | 25.56 |
Table 2d: Results of Energy-Entropy feature using PNN classifier
| Spread Factor | E1 | Time(s) | E2 | Time(s) | E3 | Time(s) | E4 | Time(s) | E5 | Time(s) | E6 | Time(s) |
| 0.55 | 80.07 | 6.89 | 86.96 | 7.61 | 87.97 | 3.61 | 80.68 | 2.21 | 80.68 | 2.21 | 85.47 | 2.21 |
| 0.56 | 80.07 | 2.40 | 86.96 | 2.87 | 87.91 | 0.69 | 80.74 | 0.83 | 80.74 | 0.83 | 85.47 | 0.80 |
| 0.57 | 80.07 | 2.71 | 87.03 | 2.69 | 87.91 | 0.67 | 80.81 | 0.83 | 80.81 | 0.83 | 85.47 | 0.80 |
| 0.58 | 80.07 | 2.37 | 87.03 | 2.35 | 87.84 | 0.65 | 80.74 | 0.77 | 80.74 | 0.77 | 85.47 | 0.81 |
| 0.59 | 80.07 | 2.21 | 87.09 | 2.57 | 87.70 | 0.66 | 80.74 | 0.78 | 80.74 | 0.78 | 85.47 | 0.80 |
| 0.60 | 80.07 | 2.13 | 87.23 | 2.80 | 87.77 | 0.69 | 80.74 | 0.95 | 80.74 | 0.95 | 85.47 | 0.84 |
| 0.61 | 80.07 | 2.13 | 87.23 | 3.04 | 87.77 | 0.71 | 80.74 | 0.81 | 80.74 | 0.81 | 85.54 | 0.81 |
| 0.62 | 80.07 | 2.18 | 87.30 | 2.65 | 87.77 | 0.67 | 80.74 | 0.72 | 80.74 | 0.72 | 85.54 | 0.79 |
| 0.63 | 80.07 | 2.24 | 87.36 | 2.59 | 87.77 | 0.72 | 80.74 | 0.74 | 80.74 | 0.74 | 85.54 | 0.81 |
| 0.64 | 80.07 | 2.15 | 87.43 | 2.55 | 87.77 | 0.68 | 81.01 | 0.80 | 81.01 | 0.80 | 85.61 | 0.81 |
| 0.65 | 80.07 | 2.17 | 87.50 | 2.83 | 87.77 | 0.74 | 81.01 | 0.76 | 81.01 | 0.76 | 85.61 | 0.85 |
| MAX% | 80.07 | 6.89 | 87.50 | 7.61 | 87.97 | 3.61 | 81.01 | 2.21 | 81.01 | 2.21 | 85.61 | 2.21 |
Results and Discussion
To discriminate PD and HC for each emotion, PNN and KNN models have been developed. In this case, two class classifications were carried out using PNN and KNN to categorize these different emotions. The overall classification accuracies of four features for each emotion using two models were tabulated and shown in the figure (A) and (B). While comparing the classification accuracy of four features, it can be observed that EEN feature performs evenly well for all six emotions. But for emotion E1, maximum accuracy of 96.8 is obtained using SEEN with PNN and second highest accuracy of 95.97 using SEN with PNN. For emotion E2, maximum accuracy of 90.81 is obtained using EN with KNN and second highest accuracy of 90.74 using EEN with KNN. For emotion E3, maximum accuracy of 95.07 is obtained using SEEN with KNN and second highest accuracy of 87.97 using EEN with PNN. For emotion E4, maximum accuracy of 88.65 is obtained using EN with KNN and second highest accuracy of 87.16 using SEEN with KNN. For E5, maximum accuracy of 94.53 is obtained using SEEN with KNN and second highest accuracy of 88.04 using SEN with KNN. For E6, maximum accuracy of 87.43 is obtained using EN with KNN and second highest accuracy of 87.03 using EN with PNN.
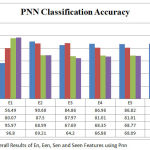 |
Figure 1: Overall Results of En, Een, Sen and Seen Features Using Pnn
|
From the figure (A), it could be observed that, the highest classification accuracy of 90.68% (for emotion E2) and the lowest classification accuracy of 56.49% (for emotion E1) were obtained for EN feature using PNN. Then the highest classification accuracy of 87.97% (for emotion E3) and the lowest classification accuracy of 80.07% (for emotion E1) were obtained for EEN feature using PNN. For SEN using PNN, the highest classification accuracy of 95.97% (for emotion E1) and the lowest classification accuracy of 67.69% (for emotion E3) were obtained. Then for SEEN using PNN, the highest classification accuracy of 96.8% (for emotion E1) and the lowest classification accuracy of 64.2% (for emotion E3) were obtained for SEEN feature using PNN.
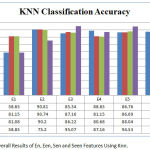 |
Figure 2: Overall Results of En, Een, Sen and Seen Features Using Knn.
|
From the figure (B), it could be observed that, the highest classification accuracy of 90.81% (for emotion E2) and the lowest classification accuracy of 58.65% (for emotion E1) were obtained for EN feature using KNN. Then the highest classification accuracy of 90.74% (for emotion E2) and the lowest classification accuracy of 81.15% (for emotion E1 & E4) were obtained for EEN feature using KNN. For SEN using KNN, the highest classification accuracy of 90.2% (for emotion E2) and the lowest classification accuracy of 80.68% (for emotion E4) were obtained. Then for SEEN using PNN, the highest classification accuracy of 95.07% (for emotion E3) and the lowest classification accuracy of 58.85% (for emotion E1) were obtained for SEEN feature using KNN.
Conclusion
The extracted features were associated to their respective emotions and models were developed successfully. The performance of the two models were tabulated and compared. In this paper, the time domain features EN & EEN and the frequency domain features SEN &SEEN features were extracted from the PD and HC EEG signals and the results were analyzed. From the analysis, it has been clearly observed that the proposed energy-entropy combination feature using PNN and KNN in time domain performs evenly well (above 80.07% to 90.74%) for all emotions. Whereas other features gives lower accuracy values of below 60% for few emotions. But for E1 highest accuracy of 96.8% using PNN and for E3 highest accuracy of 95.07% using KNN were observed in proposed energy-entropy feature in frequency domain only. Hence, the proposed energy-entropy features may perform even much better in time-frequency domain with suitable classifier model.
References
- Davidson and W. I. The functional neuro- anatomyof emotion and affective style. Trends in Cognitive Sciences. 1999;3:11-21.
CrossRef - TottoAlves S. S. F and Aznar-Casanova J. A. Models of brain asymmetry in emotional processing. Psychology& Neuroscience. 2008;1:63-66.
- Bevilacqua D. D’., Mandoline G and Suma M. A new tool to support diagnosis of neurological disorders by means of facial expressions. IEEE International Workshop on Medical Measurements and Applications Proceedings (MeMeA). 2011;544-549.
- Teplan, Fundementals of EEG measurement.Measurement Science Review. 2002;2.Section 2.
- Steven T. D., Kenneth m. H., Bowers D and Valenstein E. Recognition and Discrimination of Emotional Faces and Pictures. Brain and Language. 1980;9:206-214.
CrossRef - Mohr E.,Juncos J., Cox C.,Litvan I.,Fedio P.,Thomas N. C. Selective deficits in cognition and memory in high-functioning parkinsonian patients. Journal of Neurology,Neurosurgery and psychiatry. 1990;53:603-606.
CrossRef - Pell M. On the receptive prosodic loss in Parkinson’s disease.Cortex. 1996;32:693-704.
CrossRef - Zhao S., Rudzicz F., Leonardo G. C., Cesar M´arquez-Chin., Livingstone S. Automatic Detection of Expressed Emotion In Parkinson’s Disease.
- Marc D. P., Carol L. L. Facial expression decoding in early Parkinson’s disease.Cognitive Brain Research. 2005;23:327– 340. 2005.
- Bowers D.,Miller K., Mikos A., Kirch L. D.,springer U.,Fernandez H., Foote K and Okun M. Startling facts about emotion in Parkinson’s disease blunted reactivity to aversive stimuli. Brain. 2006;129:3356-3365.
CrossRef - Baumgartner T., Esslen M., Jancke L. From emotion perception to emotion experience:Emotions evoked by pictures and classical music.International journal of psychophysiology. 2006;60:34-43.
CrossRef - Schroder C., Mobes J., Schutze M., Szymanoo F. N., Bangewski M., NAGER W., Bangert M., Frank T. M and Dengler R. Perception of Emotional speech in parkinson’s disease. Movement disorders. 2006;21:10.
CrossRef - Murugappan R. N and Yaacob S. Comparison of Different Wavelet Features from EEG Signals for Classifying Human Emotions. IEEE Symposium on Industrial Electronics and Applications (ISIEA 2009). 2009;4-6.
CrossRef - Paulraj M. P., Bin S. Y.,Hamid A., Adom B.,Subramaniam K.,Hema C. R. EEG based hearing threshold classification using fractal feature and neural networks, IEEE Student conference on research and development. 2012.
- Chun-Xiao H.,Wang J ., Guo-Sheng Y., Yan-Qiu C. Investigation of EEG abnormalities in the early stage of Parkinson’s disease. Cogn Neurodyn. 2013;7:351–359. 2013.
- Yuvaraj M. M., Mohamed N. I., Sundaraj K.,Omar M., Mohamad K., Palaniappan R. Detection of emotions in Parkinson’s disease using higher order spectral features from brain’s electrical activity. Biomedical Signal Processing and Control. 2014;14:108–116. 2014.
CrossRef - Yuvaraj M. M., Mohamed N. I., Iqbal M. O.,Sundaraj K., Mohamad K., Palaniappan R and Satiyan M. Emotion classification in Parkinson’s disease by higher-order spectra and power spectrum features using EEG signals: A comparative study. Journal of Integrative Neuroscience. 2014;13:11–32. 2014
CrossRef - Yuvaraja M. M., Rajendra U. A., Adelid H., Mohamed N. I.,Mesquitaf E. Brain functional connectivity patterns for emotional state classification in Parkinson’s disease patients without dementia. Behavioural Brain Research. 2016;298:248–260. 2016.
CrossRef - Palaniappan P. R., Nishida S and Saiwaki N. Fuzzy ARTMAP classification of mental tasks using segmented and overlapped EEG Signals. Proceedings of IEEE Region 10 Conference (TENCON), Kuala Lumpur, Malaysia. 2000;2(25-27):388-391.
- Sivanandam N.,Paulraj M. Introduction to Artificial Neural Networks. Vikas Publishing House, India. 2003.
- Fausett L. Fundamentals of Neural Network, Prentice Hall, New Jersey, USA. 1994
- Specht D. F. Probabilistic Neural Networks. Neural Networks. 1990;3:109–118.
CrossRef - Yuvaraj R., Murugappan M., Mohamed N. I., Mohd. I. O., Sundaraj K., Mohamad K., Palaniappan R., Mesquita E and Satiyan M. On the analysis of EEG power, frequency and asymmetry in Parkinson’s disease during emotion processing. Behavioral and Brain Functions. 2014.
CrossRef

