
Manuscript accepted on :July 06, 2017
Published online on: --
Plagiarism Check: Yes
Ali D. Salman1, Ghasak H. Jani2 and Abdalbseet A. Fatalla2
1Department of Chemical engineering, Basrah University for Oil and Gas, Basrah, Iraq.
2Department of Prosthodontics, College of Dentistry, University of Baghdad, Bab-Almoazm, PO Box 1714, Baghdad, Iraq.
Corresponding Author E-mail: abdalbasit@codental.uobaghdad.edu.iq
DOI : https://dx.doi.org/10.13005/bpj/1262
Abstract
The aim of this investigation was to assess and compare the impact of incorporation of nano-silica sand (crystalline) and nano-silica (amorphous) on the properties (impact strength, transverse strength, and hardness)of heat-cure type acrylic resin denture base material, polymethyl methacrylate (PMMA). Nano particles(NPs) with different concentrations (3%, 5% and 7%) were incorporated by weight into PMMA and processed under optimal conditions.161 samples were prepared for this study.These samples were placed in three groups according to the tests performed and each group consisted of seven sub-groups according to the percentage of NPs added. Charpy test for impact strength, transverse strength test and hardness test (shore D) were conducted. The morphology, size distribution and crystal linity of the NPs were estimated by scanning electron microscope, atomic force microscope, and X-Ray diffraction respectively.The results show that each investigated property was enhanced after NPs filler was incorporated when compared to control group. Highly significant improvements in impact strength,transverse strength and hardness were observed with addition of NPs to PMMA at 3%, 5% and 7% by weight. However, compromised mechanical properties is still a drawback of PMMA , hence it can be easily damaged by accidents or high mastication forces during denture wear. One of the ways of improving the mechanical properties of PMMA based materials may be NPs incorporation which can improve the physical and mechanical properties. Optimum nano particle doses can yield superior mechanical properties.
Keywords
Polymethylmethacrylate; denture base; silica; nanoparticles; nanotechnology
Download this article as:| Copy the following to cite this article: Salman A. D, Jani G. H, Fatalla A. A. Comparative Study of the Effect of Incorporating SiO2 Nano-Particles on Properties of Poly Methyl Methacrylate Denture Bases. Biomed Pharmacol J 2017;10(3). |
| Copy the following to cite this URL: Salman A. D, Jani G. H, Fatalla A. A. Comparative Study of the Effect of Incorporating SiO2 Nano-Particles on Properties of Poly Methyl Methacrylate Denture Bases. Biomed Pharmacol J 2017;10(3). Available from: http://biomedpharmajournal.org/?p=16208 |
Introduction
Polymethylmethacrylate (PMMA) is among the widely used materials in prosthetic dentistry. It has a simple manipulation technique, low price, and commendable esthetic output. PMMA based materials can be used to produce less bulky and economic dentures which can be frequently adjusted and corrected when required.Broken denture is the most frequent complaint of denture wearers encountered by clinicians. It can be due to the induced stiffness of denture base prosthesis from long-term fatigue failure which is triggered by repeated masticatory forces or from excessive extra oral forces generated from unintentional prognosis of the prosthesis.1
Dental materials of dentures can be divided into mainly three categories: resin, ceramic, and metal. The dental prosthesis directly contacts with the oral mucosa and is under long-term use in the oral environment,hence the dental materials must have excellent properties and good biological activity to function properly.2 Investigations show that 67% of the dentures get damaged within few years of fabrication.3 To develop the quality and properties of denture base, researchers should focus to prepare and produce a material with superior mechanical properties. Combination of different kinds of materials to PMMA like fibers, metals,powder fillers, carbon nano tubes (CNT) and nano-silica have been experimented.4 Nano materials have unique properties which are tiny size, huge surface area, surface area to volume ratio, a huge sizable surface of atoms.5 Denture base composite with nano-fillers has higher interfacial cross-link strength between the resin bulk and nano materials as compared to the classic resin bulk. This superior molecular bonding shields the nano materials and makes a dense interface, which improves the bonds between resin and makes polymers denser and increases their molecular weight.6
Silica nano particles (amorphous-crystalline)have been successfully mixed with PMMA and other polymeric dental materials. Several experimental studies have shown notable effects on mechanical and thermal properties of these materials.7 However, unsuitable type or dose of nano particles loading can result in decreased mechanical properties.8 Nano silica natural powder has been preferred to enhance properties of PMMA, as a bio compatible material that owns high level of fracture resistance.9 Incorporation of inorganic nano particles to enhance polymer performance has received interest lately. Among nano-composite materials, most widely examined is silica-polymethylmethacrylate (PMMA), due to its optical and mechanical properties.10
The nano-silica integrated with polymer matrix can enhance the durability, strength, and the resistance of the polymer. The nano-composite properties are highly reliant on the molecular properties, specifically on the type and sizes proportions of the organic-inorganic interfaces, on the systems of interaction between organic and inorganic components.11
Theaim of this research was to investigate the impact of the particle size, shape (irregular and spherical), structure (amorphous-crystalline) of the adding doseof silica nano-fillers on the mechanical properties of the PMMA matrix material. The morphology and microstructure of the fillers and their allocation in the composite were analyzed by scanning electron microscopy (SEM).
Materials and Methods
Preparation of Silica Nanoparticles
Crystalline nanosilica sand (NSS) was taken and prepared from Ardma location at Anbar province in western Iraq.
Amorphous nanosilica(NS) was taken and prepared from Iraqi rice husk.
The prepared silica nanoparticle specifications and characterization are available in our previous work.12,13
Preparation of Specimens
Grouping of the Specimens
The Materials used in the study as specified by the manufacturers are shown in Table 1. The denture base material, filler powders, particle sizes, and ratio of fillers according to weight are shown in Table 2 and Table 3. One hundred and sixty-one samples were prepared and divided into 3 groups according to the tests selected. Two groups consisted of 70 samples while third group consisted of 21 samples and these were subdivided according to the added dosage of (amorphous-crystalline) SiO2 nano particles into four sub groups as shown in Table 2 and Table 3.
Table 1: Materials used in the study as specified by the manufacturers.
| Materials | Index | Characteristic | SSA (m2/g) | Average Particle Size(nm) | Manufacturer |
| Poly methyl methacrylate | (PMMA) | Powder: methyl methacrylate | — | ||
| methyl methacrylate monomer | (MMA) | liquid monomer catalyst | — | ||
| Nanosilica (amorphous) | NS | 99 % purity, Iraqi rice husk. | 300 | 50nm | University Of Technology Baghdad |
| Nanosilica sand (crystalline) (Quartz) | NSS | 99.83 % purity, Iraqi silica sand | 40 | 70nm | University Of Technology Baghdad |
Table 2: Tabulation of the samples containing NS.
| Groups | Subgroups | Description | PMMA/SiO2 (g) | No. of samples |
| Group A
Impact strength test |
Group A1 | (PMMA) without additives | 100/0 | 3 samples |
| Group A2 | PMMA with 3% NS | 97/3 | 3 samples | |
| Group A3 | PMMA with 5% NS | 95/5 | 3 samples | |
| Group A4 | PMMA with 7% NS | 93/7 | 3 samples | |
| Group B
Flexural transverse strength |
Group B1 | 0% Control Mixture | 100/0 | 10 samples |
| Group B2 | PMMA with 3% NS | 97/3 | 10 samples | |
| Group B3 | PMMA with 5% NS | 95/5 | 10 samples | |
| Group B4 | PMMA with 7% NS | 93/7 | 10 samples | |
| Group C
Surface hardness |
Group C1 | 0% Control Mixture | 100/0 | 10 samples |
| Group C2 | PMMA with 3% NS | 97/3 | 10 samples | |
| Group C3 | PMMA with 5% NS | 95/5 | 10 samples | |
| Group C4 | PMMA with 7% NS | 93/7 | 10 samples |
Table 3: Tabulation of the samples containing NSS.
| Groups | Subgroups | Description | PMMA/SiO2(g) | No. of Samples |
| Group D
Impact strength test |
Group D1 | (PMMA) without additives | 100/0 | 3 samples |
| Group D2 | PMMA with 3% NSS | 97/3 | 3 samples | |
| Group D3 | PMMA with 5% NSS | 95/5 | 3 samples | |
| Group D4 | PMMA with 7% NSS | 93/7 | 3 samples | |
| Group E
Flexural transverse strength |
Group E1 | 0% Control Mixture | 100/0 | 10 samples |
| Group E2 | PMMA with 3% NSS | 97/3 | 10 samples | |
| Group E3 | PMMA with 5% NSS | 95/5 | 10 samples | |
| Group E4 | PMMA with 7% NSS | 93/7 | 10 samples | |
| Group F
Surface hardness |
Group F1 | 0% Control Mixture | 100/0 | 10 samples |
| Group F2 | PMMA with 3% NSS | 97/3 | 10 samples | |
| Group F3 | PMMA with 5% NSS | 95/5 | 10 samples | |
| Group F4 | PMMA with 7% NSS | 93/7 | 10 samples |
Preparation of Composites
Test samples were prepared with the denture base resin (DentsplyInt.,Woodbridge, Canada). The acrylic resin used in the study was mixed according to the manufacturer’s instructions (2.2 g Powder:1 ml liquid) and the mixing ratio of each group is calculated and illustrated in the Table 2a and Table 2b. Nano-particles(NS-NSS) were incorporated at 3%, 5%, and 7% by weight to liquid monomer (MMA), the nano-filler was well dispersed in the monomer for three minutes by ultra-sonication type of mixing using probe sonication apparatus (Soniprep 150) (120W, 60KHz) as shown in fig. 1. The mixture was sonicated in a water bath for 30 minutes at ambient temperature to produce MMA containing nano particles.
The suspension of monomer with nano particles was instantly mixed with acrylic powder to reduce the possibility of particle aggregation and phase separation. PMMA powder and MMA containing nano particles were mixed rightly according to the ratio and conditions specified in the instructions manual and polymerized to produce denture base resin.Mixture was left until it reached working stage then it was packed in the flasks (Hanau Type, Germany) of conventional dentures and were placed for heat curing.
Two different metal molds were used to prepare the test samples. The first moldmeasuring 65 mm×10 mm×2.5 mm (length, width and height respectively) was used to prepare the samples to be tested for transverse flexural strength and surface hardness. The other mold measuring 80 mm×10 mm×4 mm (length, width and height respectively) was used to prepare samples for impact strength test (ANSI/ADA specification No. 12, 1975).14
The prepared mixtures were packed in a rectangular mold in standard denture flask by using a template as shown in Fig. 2. The closed flasks, strained with clamps, were polymerized in a water bath for 8h at 70℃ and cooled for 35 minutes in water at 25℃(ANSI/ADA specification No. 12, 1975).14
The samples were de flasked and cleaned from impurities. The specimens were alternately polished with silicon carbide (SiC) papers, at different grits to attain soft edges.
The prepared specimens in which the silica sand nanoparticles (crystalline) were incorporated are denoted as An, Bn, and Cn while the samples containing silica nanoparticles(amorphous) are denoted as Dn,En, and Fn, where n is the sequence number.
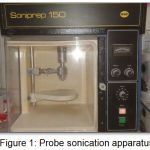 |
Figure 1: Probe sonication apparatus.
|
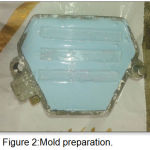 |
Figure 2: Mold preparation.
|
Testing of Specimens
Impact Strength Test
After immersing the samples in water for 48 hours at 37 °C, the samples were tested by using Charpy type impact testing instrument (TMI, testing machine Inc. Amity Ville, New York, USA) with a 2 joules testing capacity and the impact energy absorbed was read on a scale which represents the energy required to fracture the specimen. The impact strength was calculated by applying the following formula:
Where, I is the impact energy in joules, W is the width of the sample in millimeters, T is the thickness of the sample in millimeters and I.S is the Impact strength = kJ/m2.3.2 Flexural transverse strength
According to International Organization for Standardization (20795-1:2008.32) the flexural transverse strength was measured by using the 3-point bending test. Four groups were prepared by adding0%, 3%, 5%, and 7% of NPs, with 10 samples in each group. The samples were kept in water at room temperature for 14 days before testing with a universal testing machine (Sintech Renew 1121; Instron Engineering Corp, WDW-200 E, UK). The sample thickness and width were measured with a micrometer device before each test. The flexural strength (S) was calculated by using the following formula:
Where, S is the flexural strength in MPa, F is the load at break in N, L is 50 mm, the span of sample between supports, B is the width of each sample, D is the thickness of each sample.
Surface Hardness Testing
After immersing 70 specimens for two days in distilled water at room temperature, specimens were tested using duro meter shore D hardness tester(HARTIP 3000 compant).Five measurements were recorded from different areas of each sample (identical area selected for each sample) and an average of five readings was calculated. The mechanical properties were analyzed using analysis of variance (ANOVA) with multiple comparison test, at a significance level P = 0.05. Statistical analysis was performed with Mini tab 16 software.
Results and Discussion
SEM Characterization and Microstructure Analysis of Control Samples
Fig. 3A shows the SEM micro graphs of the PMMA control. SEM demonstrated a porous structure that comprised of mainly large sized pores. Numerous cracks were also spotted which indicated that the interaction process was not completed which explains the poor hardness and strength for the control mixture. These results are in agreement with the results obtained by Song et al. 2011.15
SEM Characterization and Microstructure Analysis of PMMA-NS.
The SEM image of the PMMA-NS is shown in Fig. 3B which was prepared with 3% NS of nominal particle size,50 nm. It shows that the micro structure of the PMMA-NS was dense and well organized with small sized pores. A consolidated body structure with the shortage of the voids, and cavities was noticed. The structure was more uniform and homogeneous as compared to the control specimen which illustrates the eminent strength of the material. The apparent strength of the material could be attributed to the high activity of nano particles which consolidate the filler/matrix inter phase to facilitate interactions between structures. NPs fill the pores and voids to increase the strength, reduces the size of the crystals at the interface zone. This out come is in conformity with the results obtained by Song et al 2011.15
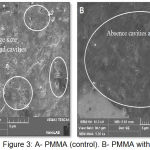 |
Figure 3: A- PMMA (control). B- PMMA with nano-filler
|
SEM Characterization of the NS-NSS
According to SEM images shown in Fig. 4500 nm magnification of SiO2 nano particles show difference in cluster of nano particles by adhesion to form micro-particles.
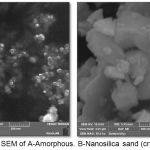 |
Figure 4: SEM of A-Amorphous. B-Nanosilica sand (crystalline).
|
The XRD of nano particle (as shown in Fig 5 and 6) show different arrangement of atoms in space:
(A) Nano silica (amorphous) atoms are randomly scattered and appear as a broad peak on graph
(B) Nano silica sand (crystalline) are evenly dispersed and appear as high intensity narrow peaks.
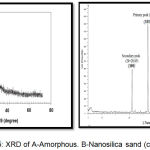 |
Figure 5: XRD of A-Amorphous. B-Nanosilica sand (crystalline).
|
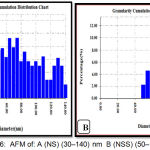 |
Figure 6: AFM of: A (NS) (30–140) nm B (NSS) (50–120) nm.
|
Theory of Modification
The impact of incorporating nano particles on mechanical properties of PMMA is shown in Tables 4, 5 and 6.The diversity of results displayed in the tables can be explained by the variety particle size distribution of NPs, different concentrations of added nano particles and different curing age of composites in water.16 It is well known that, initial fracture of resin composites occurs at the NPs/matrix in terphase. The decrease in the particle size of filler increases the surface area and therefore, massive surface energy at the inter phase was notable.Thus, the stress concentration at the NPs /matrix inter phase diminishes with the decrease in particles size of the NPs, resulting in higher values of flexural strength of the corresponding composites.17,18
Effect of (NPs) Dosage on Impact Strength Development of PMMA-NPs.
Effect of incorporating different dosages of NS-NSS on the impact strength is given in Fig.7. In comparison with the control group (0% NS), the PMMA with NS at different percentages had higher impact strengths. This could be due to the micro-filling effect of nano particles which fill the voids and pores of PMMA with the nano particles. PMMA-NS was prepared in different percentages of NS of the same particle size.The mixtures with 3% of NS displayed higher impact strength than their counterparts.
Group A2 with average particle size of 50nm exhibited an impact strength of 10.7 kJ/m2 at 3% NS, while the addition of 5% NS exhibited an impact strength of 9.62 kJ/m2 at the same particle size (Table 4 and 7). The reason behind that is when increasing nano particles percentage up to optimum dose this cussing agglomeration of NPs due to the effective affinity of NPs to aggregate, however, nano-fillers are difficult dispersed in polymers by conventional techniques to be homogeneous. PMMA-NSS was prepared in different percentages of NSS of the same particle size 70nm. The mixture prepared by incorporating 3% NSS displayed higher strength than their counter parts. Group D2 with average particle size 70nm exhibited an impact strength of 9.42 kJ/m2 at 3% NSS, while the addition of 7% NSS dropped the strength to 7.65 kJ/m2 as shown in Fig.7. It is evident that increasing the percentage of NPs results in increased strength to a certain limit after which any increase in the NPs percentage leads to a decrease in the strengths. The results of this test are in conformity with the measurements obtained by Alnamel and Mudhaffer 2014.19
Effect of (NPs) Dosage on Flexural Transverse Strength Development of PMMA-NPs
Figure (8) shows the trend of increased flexural transverse strength with the increase in the NS percentage to optimum value. By examining the transverse strength of the PMMA-NS prepared in different percentages of NS at the same particle size, it can be seen from results that the group B2 with 3% NS had a value of 41.25 MPa while the group B4 with 7% NS and achieved higher strength value with a mean of 45.7 MPa. This confirmed that the strength of composite increases by increasing the percentage of NS to optimum percentage and by decreasing the particle size.
It was also evident that addition of NPs when compared to 0% NPs had significantly better outcomes (Table 5 and 7).The improvement of strength can be attributed to interfacial strength between nano particles and matrix created by cross-link bonding covering then a no particles fillers which prevents crack propagation. Group E mixtures were prepared by incorporating 5% NSS with average particle size of 70nm. Group E3 had highest value of 60, which dropped to 57 MPa when the dosage was increased to 7% of NSS as shown in Fig 8.
The standard deviations, means,standard error of the means, minimum and maximum values of empirical results are shown in Table 5. These resultswerein conformity with the measurements obtained by Fatih allah and Jani 2016.20
Effect of (NPs) Dosage on Surface Hardness Development of PMMA-NPs
Fig.9 shows the results of surface hardness tests for different doses of NPs, having the same particle size.Group C4 was prepared by incorporating 5% of NS and average particle size of 50 nm. It had the highest value of hardness with a mean of 81.43.Group C1 had 0% NS and the lowest mean value of hardness 77.15. Group F mixtures were prepared by incorporating different doses of NSS and average particle size of 70 nm. Group F2 was prepared with 3% of NSS, had a hardness value of 83.15, while in Group F3 with 5% of NSS the hardness value dropped to 81.60. Table 6 shows the means, standard deviations, standard error of the means, minimum and maximum values of experimental specimen measuring surface hardness in different concentrations of SiO2 nano filler. These results are in good agreement with the results obtained by Fatih allah 2015.21
Table 4: Descriptive statistics for impact strength (kj/m2).
| Group | N | Mean | Minimum | Maximum | S.D. | S.E. |
| PMMA Control | 10 | 7.647 | 7.066 | 8.076 | .522 | .301 |
| PMMA-NS 3% | 10 | 10.018 | 9.829 | 10.390 | .321 | .185 |
| PMMA-NS 5% | 10 | 9.627 | 9.011 | 10.07 | .550 | .317 |
| PMMA-NS 7% | 10 | 7.06 | 6.052 | 7.648 | .876 | .506 |
| PMMA-NSS 3% | 10 | 9.42 | 7.100 | 11.576 | 2.24 | 1.29 |
| PMMA-NSS 5% | 10 | 9.01 | 8.478 | 9.677 | .608 | .351 |
| PMMA-NSS 7% | 10 | 7.65 | 6.753 | 8.112 | .522 | .301 |
Table 5: Descriptive statistics for Flexural Transverse strength (MPa).
| Group | N | Mean | Minimum | Maximum | S.D. | S.E. |
| Control | 10 | 34.5 | 18 | 62 | 12.21 | 3.8 |
| PMMA-NS 3% | 10 | 41.25 | 14 | 55 | 12.05 | 3.8 |
| PMMA-NS 5% | 10 | 42.2 | 24 | 53 | 8.20 | 2.5 |
| PMMA-NS 7% | 10 | 45.7 | 36 | 51 | 5.35 | 1.6 |
| PMMA-NSS 3% | 10 | 55 | 46 | 67 | 7.28 | 2.3 |
| PMMA-NSS 5% | 10 | 60 | 45 | 72 | 7.30 | 2.3 |
| PMMA-NSS 7% | 10 | 57 | 42 | 69 | 9.52 | 3.0 |
Table 6: Descriptive statistics for Surface hardness test.
| Group | N | Mean | Minimum | Maximum | S.D. | S.E. |
| Control | 10 | 77.15 | 73.30 | 83.60 | 4.58 | 2.29 |
| PMMA-NS 3% | 10 | 80.43 | 79.50 | 81.74 | 1.07 | 0.53 |
| PMMA-NS 5% | 10 | 81.43 | 79.26 | 82.96 | 1.58 | 0.79 |
| PMMA-NS 7% | 10 | 81.70 | 79.72 | 83.00 | 1.34 | 0.67 |
| PMMA-NSS 3% | 10 | 83.15 | 84.22 | 84.22 | 1.10 | 0.63 |
| PMMA-NSS 5% | 10 | 81.60 | 83.42 | 83.42 | 1.64 | 0.94 |
| PMMA-NSS 7% | 10 | 80.92 | 82.44 | 82.44 | 1.64 | 0.94 |
Table 7: ANOVA Table for all Tests.
| Sum of Squares | df | Mean Square | F | Sig. | ||
| Transverse Flexural Strength | Between Groups | 2388.765 | 6 | 398.127 | 3.184 | .022 |
| Within Groups | 2626.167 | 21 | 125.056 | |||
| Total | 5014.931 | 27 | ||||
| Surface Hardness | Between Groups | 81.106 | 6 | 13.518 | 3.159 | .023 |
| Within Groups | 89.861 | 21 | 4.279 | |||
| Total | 170.967 | 27 | ||||
| Impact Strength | Between Groups | 24.230 | 6 | 4.038 | 3.787 | .019 |
| Within Groups | 14.928 | 14 | 1.066 | |||
| Total | 39.158 | 20 | ||||
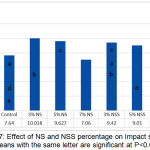 |
Figure 7: Effect of NS and NSS percentage on Impact strength (means with the same letter are significant at P<0.05)
|
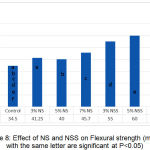 |
Figure 8: Effect of NS and NSS on Flexural strength (means with the same letter are significant at P<0.05)
|
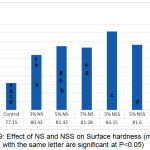 |
Figure 9: Effect of NS and NSS on Surface hardness (means with the same letter are significant at P<0.05)
|
Conclusions
The present investigation was lead to assess and compare the impact of in corporation of (Nano silica sand (crystalline) and Nano silica (amorphous) to PMMA on mechanical properties of acrylic denture base.
The reinforced denture base with silica nano particles fillers enhances their mechanical properties (including impact strength, flexural strengths, and surface hardness) when compared with conventional PMMA heat cured acrylic resin (control mixtures).
Within the dosage ranges and particle size examined for NS fillers, the strengths generally increased, the optimum percentage of NS is (3%) at 50nm particle size for Impact strength and (7%) for Flexural strength, at 50 nm particle size which gives the highest strengths.
The optimum percentages that gives the highest strengths for NSS is (3%) at 70nm particle size for Impact strength and (5%) at 70nm particle size for Flexural strength.
The results of incorporating NS fillers showed an improvement in impact strength of 23.737% under optimum conditions (3%,50 nm) while for NSS fillers impact strength was improved by 18.821% under optimum conditions (3%,70 nm).
The results of incorporating NS fillers showed an improvement in flexural strength of 24.507% under optimum conditions (7%,50 nm) while for NSS fillers flexural strength was improved by 42.5% under optimum conditions (5%,70 nm).
Acknowledgements
The authors would like to thank everyone who has helped to complete this work, especially, Mr.Muaed F. Abd Al majed from the University of Technology, Baghdad-Iraq, for his contribution to testing and measurement.
Compliance with Ethical Standards
Conflict of Interest
The authors declare that they have no conflict of interest.
References
- Balos S., Balos T., Sidjanin L., Markovic D., Pilic B & Pavlicevic J. Study of PMMA biopolymer properties treated by microwave energy. Materialeplastice. 2011;48(2):127-131.
- Avila-Herrera C. A., Gomez-Guzman O., Almaral-Sanchez J. L., Yanez-Limon J. M., Munoz-Saldana J & Ramirez-Bon R. Mechanical and thermal properties of SiO 2–PMMA monoliths. Journal of non-crystalline solids. 2006;352(32):3561-3566.
CrossRef - Atai M., Pahlavan A & Moin N. Nano-porous thermally sintered nano silica as novel fillers for dental composites. Dental materials. 2012;28(2):133-145.
CrossRef - Lazzara G & Milioto S. Dispersions of nanosilica in biocompatible copolymers. Polymer degradation and stability. 2010;95(4):610-617.
CrossRef - Zhu A., Cai A., Zhou W & Shi Z. Effect of flexibility of grafted polymer on the morphology and property of nanosilica/PVC composites. Applied surface science. 2008;254(13):3745-3752.
CrossRef - Sun L., Gibson R. F., Gordaninejad F & Suhr J. Energy absorption capability of nano composites a review. Composites Science and Technology. 2009;69(14):2392-2409.
CrossRef - Esmael S. K. Effect of Zirconium silicate nano-powder reinforcement on some mechanical and physical properties of heat cured polymethylmethacrylate denture base materials. M.Sc. thesis the college of dentistry university of Baghdad. 2015.
- Jagger D. C., Harrison A & Jandt K. D. The reinforcement of dentures. Journal of Oral Rehabilitation. 1999;26(3):185-194.
CrossRef - Chen Z. cience of Dental Material, People’s Publishing, Beijing. 2005;25-42.
- Yang F & Nelson G. L. PMMA silica nanocomposite studies: synthesis and properties. Journal of applied polymer science. 2004;91(6):3844-3850.
CrossRef - Saladino M. L., Zanotto A., Martino D. C., Spinella A., Nasillo G & Caponetti E. Ce: YAG nanoparticles embedded in a PMMA matrix: preparation and characterization. Langmuir. 2010;26(16):13442-13449.
CrossRef - Saleh N. J., Ibrahim R. I & Salman A. D. Characterization of nano-silica prepared from local silica sand and its application in cement mortar using optimization technique. Advanced Powder Technology. 2015;26(4):1123-1133.
CrossRef - Saleh J. N., Abdulrahman A. A.,Yousif A. Z. Preparation, Characterization of Nanosilica from Iraqi Rice Husk and its Application in oil well cement. wulfenia journal. 2015;22(4):233-249
- Council on Dental Materials and Devices. Revised American Dental Association specification No. 12 for denture base polymers. The Journal of the American Dental Association. 1975;90(2):451-458.
CrossRef - Song R., Jiao X & Lin L. Improvement of mechanical and antimicrobial properties of denture base resin by nano-titanium dioxide and nano-silicon dioxide particles. Pigment & Resin Technology. 2011;40(6):393-398.
CrossRef - Singhal S. Effect of different percentages of silica nanofibers filler loads on mechanical and physical properties of flowable composite resins (Doctoral dissertation, The University of Alabama at Birmingham). 2011.
- Nanocomposites New Trends and Developments. 1st ed., JanezaTrdine 9 ,Croatia. 2010.
- Swarn A. Fabrication and Characterization of Silica Nanofiber Reinforced Dental Composite Resins (Doctoral dissertation, The University of Alabama at Birmingham). 2009.
- Alnamel H. A & Mudhaffer M. The effect of Silicon di oxide Nano-Fillers reinforcement on some properties of heat curepolymethyl methacrylate denture base material. Journal of Baghdad College of Dentistry. 2014;26(1):32-36.
CrossRef - Fatihallah A. A & Jani G. H. Evaluation the Effect of Adding Silanized Silicon Dioxide Nano Filler and Carbon Nanotube Composite on Some Properties of Heat Cured Acrylic Denture Base Material.Journal of Al Rafidain University College. 2016;38:1-15.
- Fatihallah A. A. Comparison of Some Mechanical Properties of Silanated SiO2 and Polyester Fiber Composite Incorporation into Heat Cured Acrylic Resin. Iraqi Dent J. 2015;37(3):90-96.
CrossRef

