
Manuscript accepted on :July 24, 2017
Published online on: --
Plagiarism Check: Yes
Saji P1, Raza Mohamed1, Noufal P. K2, P. Sesha Reddy3, Ashish R. Jain4 and Revathy Gounder4
1Department of Prosthodontics, Pariyaram Dental College, Pariyaram, Kannur, Kerela, India.
2Department of Prosthodontics, Al Azhar Dental College, Perumpillichira, Thodupuzha, Kerela, India.
3Department of Prosthodontics, Goverment Dental College, RIMS, Putlampali, Kadapa, India.
4Department of Prosthodontics, Saveetha Dental College and Hospitals,Chennai, India.
Corresponding Author E-mail: dr.ashishjain_r@yahoo.com
DOI : https://dx.doi.org/10.13005/bpj/1261
Abstract
To evaluate and compare the effectiveness of Dental Cast Hardening Agents on the Surface Abrasion, Surface Hardness and Surface Detail reproduction of Dental Refractory investment materials. This study utilised two commercially available refractory materials: RemaexaktDentaurum (Germany), X20 chrome investment whip mix corporation (U.S.A). The samples were divided into four groups: Group I- Untreated samples, Group II- Samples treated with paraffin wax, Group III- Samples treated with bees wax, Group IV- Samples treated with okodur cold hardener. Surface abrasion test was done by electrically operated abrading tool, surface hardness by Mohs’ scale, surface details with Galai scan array 2 image system. Mean difference were statistically analysed using students t test. For Surface abrasion test, all groups showed statistically significant difference (<0.01) except Group 2 samples of X20 chrome refractory investment material compared with Group 3 and 4 (>0.05). Mohs’ Scale value for the Group 4 samples were the hardest with a value of five. Results of the surface reproducibility showed that both untreated and treated samples showed a reduced width of the groove, when compared with the steel model. Results of test for surface abrasion and surface hardness indicated that hardening agents do improve the surface abrasion resistance and abrasion values of treated samples.
Keywords
Surface roughness; Surface hardness; Surface details; Refractory Investment
Download this article as:| Copy the following to cite this article: Saji P, Mohamed R, Noufal P. K, Reddy P. S, Jain A. R, Gounder R. Comparative Evaluation of the Influence of Cast Hardening Agents on Surface Abrasion, Surface Hardness and Surface Detail Reproduction Properties of Refractory Investment Materials. Biomed Pharmacol J 2017;10(3). |
| Copy the following to cite this URL: Saji P, Mohamed R, Noufal P. K, Reddy P. S, Jain A. R, Gounder R. Comparative Evaluation of the Influence of Cast Hardening Agents on Surface Abrasion, Surface Hardness and Surface Detail Reproduction Properties of Refractory Investment Materials. Biomed Pharmacol J 2017;10(3). Available from: http://biomedpharmajournal.org/?p=16138 |
Introduction
The Dental refractory investments are used to achieve working refractory model by duplicating the master cast which has a definite disadvantage of providing an easily abradable and roughened surface for the model. This can be attributed to the larger particle size of the refractory material used in the investment. To prevent the surface of the duplicated master model from being abraded and to preserve the duplicated details and to provide a smooth and harder surface for working, the refractory models are treated with Dental hardeners.1-2 These hardeners get readily absorbed in to the surface of the refractory models and also seal the surface pores. Cast hardeners are thus said to improve the surface hardness, preserve surface details and bring about better adherence and adaptability of pattern wax on the refractory models. The various properties of die materials investments, casting alloys and various techniques have been evaluated, perfected, and reported.3-7 The variations in binder content, refractory agents and heat treatment may lead to changes in strength properties and also the various hardening agents available commercially claim to improve the working characteristics of the refractory models along with surface abrasion resistance and hardness.8-11 This study was therefore proposed with following objectives
To evaluate and compare the surface abrasion resistance of refractory cast investment materials before and after cast hardening.
To determine and compare the surface hardness of refractory cast investment materials before and after cast hardening.
To compare the surface reproduction property of refractory cast investment materials before and after cast hardening.
Materials and Methods
Various different brands of investment materials are in use for constructing refractory models.Commercially available refractory materials and hardeners used in the study are shown in Table I.
Table 1: Investment Materials AndHardners
| REFRACTORY MATERIALS | DENTAL CAST HARDENERS |
| 1. RemaExaktDentaurum (Germany)
2. X20 Chrome Investment Whip Mix Corporation (U.S.A). |
1. Paraffin wax
2. Beeswax 3. Okodur cold hardener |
Preparation of Samples of Refractory Investment Materials
An acrylic block measuring 5x2x1cms was used to prepare the silicon mold (Reprosilputty consistency , Dentsply ) (Figure 1). Twenty rectangular blocks (Figure 2) each measuring 5x2x1cms of both, the refractory investment materials were prepared following the recommended powder liquid ratio.
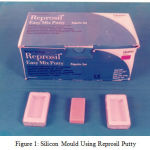 |
Figure 1: Silicon Mould Using Reprosil Putty
|
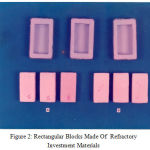 |
Figure 2: Rectangular Blocks Made Of Refractory Investment Materials
|
Remaexkat 400 grams : 56ml
X20 chrome investment 400 grams : 44ml
The required amount of powder and liquid were transferred into a mixing flask and hand spatulated for 15 seconds and then vaccum mixed following manufracturers instructions. The vaccum mixed refractory investment material was then invested into preformed putty consistency molds.A steel disc of 4 cm in diameter with three lines 147.1580 microns width (Figure 3) engraved on it was duplicated using light body polysiloxane impression material (Reprosil, DentsptyU.S.A). Both the refractory investments were vaccum mixed following manufacturer instructions and were then invested in to these duplicated molds. After the lapse of thirty minutes, twenty samples were separated from the molds and were subjected to drying in a furnace and hardening treatment (Figure.4).
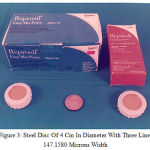 |
Figure 3: Steel Disc Of 4 Cm In Diameter With Three Lines 147.1580 Microns Width
|
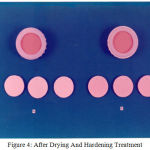 |
Figure 4: After Drying And Hardening Treatment
|
All twenty rectangular blocks and twenty round discs each of both the refractory investments were prepared for testing abrasion resistance, surface hardness and surface detail reproduction. The samples were then divided into four groups of five samples each: Group I- Untreated samples, Group II- Samples treated with paraffin wax, Group III- Samples treated with bees wax, Group IV- Samples treated with okodur cold hardener. Samples to be treated with paraffin wax were dipped in liquid paraffin for 10 seconds and drip dried. Bees wax was heated to 138-148 c and samples were dipped till the wax fumed and then drip dried. Samples treated with okodur cold hardener were dipped in cold hardener for 10 seconds and then returned to the furnance and heated at 170 c for 5 mins.
Testing For Surface Abrasion, Surface Hardness and Surface Detail Reproduction
Electrically operated metal shaping instrument with abrading tool contacting the samples 2 mm short of the borders and moved for a length of one and half inches (Figure 5).A sharp pointed tool made of high speed steel was used to abrade the samples. A force of 250 gram and depth of abrasion was maintained constant for all the samples. Twenty samples each of both the refractory investment material were numbered and then weighed using an electronic balance (precise 205A) which was sensitive to a weight of upto 0.01 mg. Each samples was subjected to an abrasion of four strokes of the abrading point at difference sites abraded samples were then carefully removed from the wise and the specimens were reweighed using the same electronic balance. The difference in the weight of all the samples before and after abrasion resistances testing was calculated.Hardness values for twenty samples of four groups of both the refractory investment materials used in the study were determined using Mohs’ scale of scratch hardness(Figure 6).
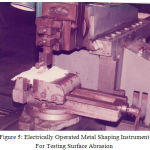 |
Figure 5: Electrically Operated Metal Shaping InstrumentFor Testing Surface Abrasion
|
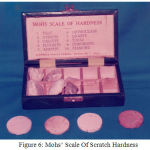 |
Figure 6: Mohs’ Scale Of Scratch Hardness
|
Surface detail reproduction capacity of the untreated as well as hardened samples weredetermind by measuring the width of the duplicated groove in microns. This study utilized Galaiscan array 2 image system with a block and white change coupled device video camera and reflected type optical microscope attached to a computer (Figure 7).The instrument is provided with a grid and smallest division in the grid corresponds a dimension of 6.689 microns. A mean of five readings made was taken as width of each groove. The differences in width was calculated by substracting the width of the groove on the steel model (147.1580 microns). This difference was used to calculate mean and standard deviation for statistical analysis.
 |
Figure 7: GalaiScan Array Image System
|
Results
The mean of difference in weight of untreated samples before and after scraping range from 0.023-0.027gms for Remaexakt refractory investment and 0.023-0.27gms with x 20 chrome investment. The mean difference in weight of treated sample ranges from 0.012 – 0.022gms with Remaexaktreffractoryinvestment and 0.014 – 0.019gms with x 20 chrome investment.Statistical analysis of the mean values of weight loss for different groups ofRemaExakt and X20 chrome investment refractory material is shown in Table II and III.Hardness test for the samples of both the refractory investment materials, group I showed the least value of 3, Samples of group II and III were more harder than group I with a value of 4 and group IV was the hardest, with a value of 5 on Mohs’ scale (Table IV).
Table 2: Comparison of means of differences in weight of RemaExakt Refractory investment material in grams of groups
| S.No | Groups | Mean | Standard Deviation | T-Value | P-Value | Significance |
| 1 | I
II |
0.0250
0.020 |
0.001591
0.002121 |
3.7713 | <0.01
|
Significant
|
| 2 | I
III |
0.0250
0.0156 |
0.001591
0.00288 |
5.7134 | <0.01 | Significant |
| 3 | I
IV |
0.0250
0.0142 |
0.00268 | 6.9299 | <0.01 | Significant |
| 4 | II
III |
0.020
0.0156 |
0.002121
0.00288 |
2.4602 | <0.05 | Significant |
| 5 | II
IV |
0.020
0.0142 |
0.002121
0.00268 |
3.3939 | <0.05 | Significant |
| 6 | III
IV |
0.0156
0.0142 |
0.00288
0.00268 |
0.7169 | >0.05 | Non significant |
Table 3: Comparison of means of differences in weight of X20 chrome investment Refractory investment material in grams of groups
| S.No | Groups | Mean | Standard Deviation | T-Value | P-Value | Significance |
| 1 | I
II |
0.0238
0.0166 |
0.002588
0.001516 |
4.8007 | <0.01 | Significant |
| 2 | I
III |
0.0238
0.0160 |
0.002588
0.002121 |
4.6619 | <0.01 | Significant |
| 3 | I
IV |
0.0238
0.0154 |
0.002588
0.001673 |
5.45121 | <0.01 | Significant |
| 4 | II
III |
0.0166
0.0160 |
0.001516
0.002121 |
0.46025 | >0.05 | Non significant |
| 5 | II
IV |
0.0166
0.0154 |
0.001516
0.001673 |
1.0629 | >0.05 | Non significant |
| 6
|
III
IV |
0.0160
0.0154 |
0.002121
0.001673 |
0.4418 | >0.05 | Non significant |
Table 4: MOH’s Scale of hardness testing
| Sample No. | Hardness Number
(RemaExakt Refractory Investment material.) |
Hardness Number
(X20 chrome investment) |
|
| Unreated samples (Group I) | 1
2 3 4 5 |
3
3 3 3 3 |
3
3 3 3 3 |
| Treated with paraffin (Group II) | 1
2 3 4 5 |
3
3 3 3 3 |
4
4 4 4 4 |
| Treated with Beeswax (Group III) | 1
2 3 4 5 |
4
4 4 4 4 |
4
4 4 4 4 |
| Treated with Okodur (Group IV) | 1
2 3 4 5 |
5
5 5 5 5 |
5
5 5 5 5 |
The mean difference in width of the samples with the width of the steel model were tabulated (Table V and VI) and statistically analysed using students t test.Significant difference was obtained (P<0.01) with Group I samples of Remaexakt refractory investment materials when compared to Group II (t-value6.0469) and III (t-value 6.9716). Significant difference (p<0.01) was obtained with samples of Group II (t-value 6.8289) and Group III (t-value 7.8360)of the same refractory investment materials when compared with Group IV.Significant difference was observed on comparing Group I samples of x20chrome investment material with Group II (t-value 10.1164) and Group III (t-value 6.2146). Comparing mean difference in width of group II(t-value 4.4501)and Group III (t-value 3.6635) with values of group IV samples result obtained was significant difference (p<0.01).
Discussion
Being very brittle and fragile in nature, the set phosphate or gypsum bonded refractory investment model may be abraded during handling, wax pattern preparation and investing. Though the phosphate bonded investment attains adequate strength when heated during burnout, the refractory model should be protected from the surface being abraded.12-15
Abrasion resistance of the hardened samples were more than untreated samples. The thin layer of hardener formed on the surface of the samples seals the pores between the larger and coarser particles of investment material and there by prevents the direct contact of the abrading tool and resisting the removal of particles from the samples surface. The untreated samples on the other hand gets exposed to the tool and the pores present between the investment particles brings about easy removal of the investment from the samples surface.16-21
Hardness values can be considered to be related to the abrasion resistance and the values obtained shows that the hardness values on Mohs’ scale was the highest for Group IV (hardness no.5) sample of both the refractory investment materials tested. Group II and Group III samples showed a higher value of hardness (Hardness no.4) when compared to untreated samples among both Remaexakt and X20 chrome investment materials. The values of hardness were the least for untreated samples (Hardness no.3) of the investments studied (Table V and VI).
Table 5: Comparison of difference in mean of width of the duplicated groove in Remaexakt refractory investment material.
| S.No | Groups | Mean In Microns | Standard Deviation | T-Value | P-Value | Significance |
| 1 | I
II |
0.5351
2.5873 |
0.4623
0.6018 |
6.0469 | <0.01 | significant |
| 2 | I
III |
0.5351
2.9431 |
0.4623
0.6187 |
6.9716 | <0.01
|
significant |
| 3 | I
IV |
0.5351
0.5350 |
0.4623
0.2991 |
0.00032 | >0.01 | Non significant |
| 4 | II
III |
2.5873
2.9431 |
0.6018
0.6187 |
0.9219 | >0.01
|
Non significant
|
| 5 | II
IV |
2.5873
0.5350 |
0.6018
0.2991 |
6.8289 | <0.01 | Significant |
| 6 | III
IV |
2.9431
0.5350 |
0.6187
0.2991 |
7.8360 | <0.01 | Significant |
Table 6: Comparison of Difference in Mean of Width of the Duplicated Groove in X20 Chrome Investment Refractory Investment Material.
| S.No | Groups | Mean In Microns | Standard Deviation | T-Value | P-Value | Significance |
| 1 | I
II |
1.0703
3.3954 |
0.3664
0.3605 |
10.1164 | <0.01 | significant |
| 2 | I
III |
1.0703
3.2743 |
0.3664
0. 7033 |
6.2146 | <0.01 | significant |
| 3 | I
IV |
1.0703
1.2487 |
0.3664
0. 0168 |
0.3691 | >0.01 | Non significant |
| 4 | II
III |
3.3954
3.2743 |
0.3605
0. 7033 |
0.3435 | >0.01 | Non significant |
| 5 | II
IV |
0.3605
1.2487 |
0.3605
0. 0168 |
4.4501 | <0.01 | Significant |
| 6 | III
IV |
3.2743
1.2487 |
0.7033
0.0168 |
3.6635 | <0.01 | Significant |
The higher value of hardness among Group IV samples can be due to the inclusion of harder wax in the reduced water powder ratio, thereby increasing the density of the material and also the mixture on vibration, the liquid content moves to surface leaving more amount of powder on the surface in apposition with the mold. This method of hardness testing has its limitations in being a relative measure of the hardness of the materials.
The measurements of the width of the groove reproduced showed that both the untreated and treatd samples gave a reduced values of width of the grooves when compared with the steel model. the difference in width of the duplicated grooves of untreated samples with steel model can be attributed duplicating material, and inability of investment material itself, concentration of the liquid, and heat treatment procedure.22-25
Samples treated with hardeners also showed a difference in the width of the duplicated grooves, this can be due to the factors affecting the untreated samples and also because of the film of hardening agent being coated on the walls of the grooves, when the duplicating procedure and heat treatment is kept constant for both of the investment materials tested under similar conditions.
Conclusion
Comparing the available values it can be said that hardening agents do improve surface abrasion resistance and surface hardness of refractory investment materials, but these agents did mask the surface reproduction of the duplicated refractory model. However the practical implacability is not clear as partial dentures are being almost successfully constructed after treating with hardening agents.
References
- Dootz E. R., Graig R. G and Peyton F. A. Influence of investments and duplicating procedures on the accuracy of partial denture castings. The Journal of prosthetic dentistry. 1965;4:679-690.
CrossRef - Paul E. H., et al. Alterations of surface hardness with gypsum die hardeners. The Journal of prosthetic dentistry. 2004;1:35-38.
- Terry J. L.,Stanford M. C and Knox E Influence of surface hardener on gypsum abrasion resistance and water sorption. The Journal of prosthetic dentistry. 2003;5:441-446.
- William D. G. Laboratory procedures for fitting removable partial denture frameworks.The Journal of prosthetic dentistry. 1978;2:227-229.
- Peyton F. A., Leibold J. P and Ridgley G. V. Surface hardness, compressive strength, and abrasion resistance of indirect die stones. The Journal of Prosthetic Dentistry. 1952;3:381-389.
CrossRef - Andrzej S. J., Radford R. D and Curtis V. R. Sensitivity of a disc rupture strength test to air bubble pores in phosphate-bonded investment materials at elevated temperatures. Dental Materials. 2002;3:255-262.
- Kyung-Soo J., Suk-Jin Y and Yung-Soo K. Comparison of castability and surface roughness of commercially pure titanium and cobalt-chromium denture frameworks. The Journal of prosthetic dentistry. 2001;1:93-98.
- Hisao F., Lacy M. A and Jendresen D. M. Effectiveness of hardening films on die stone. The Journal of prosthetic dentistry. 1980;1:57-63.
- Nikolaos V. Accuracy detail reproduction and hardness of gypsum casts produced from silicone impressions treated with glow discharge. The Journal of prosthetic dentistry. 1993;5:457-464.
- Lyon H. E., Mitchell R. J and Patterson T. A comparison of abrasion resistance of dental stones.Dental Materials. 1987;2:49-51 .
CrossRef - Peter R. L., Radford R. D and Juszczyk S. A. The surface of investments poured against different duplicating media. International Journal of Prosthodontics. 1996;6.
- Shereen S. A., Kerby E. R and Knobloch A. L. Effect of mixing methods on the physical properties of dental stones. Journal of dentistry. 2008;9:736-744.
- Derrien G.,Menn G. L. Evolution of detail reproduction for three die material by using scanning electron microscopy and two dimensional profilometry. J. Prosthet Dent. 1995;74:1-7.
CrossRef - Mannezhad G.,Mohammed E. S.,Steward P. G.,Weinberg R. Effects of cyanoacrylates on die stones. J. Prosthet Dent. 1983;49(5):639-646.
CrossRef - Fukui H.,Lacy M. A., Jendresen D. M. Effectiveness of hardening films on die stones .J. Prosthet Dent. 1980;44(1):57-63.
CrossRef - Lund R. M., Shryock F. E. Castings made directly to refractory dies. J. Prosthet Dent. 1967;18(3):251-256.
CrossRef - Calverly J. M., Moergeli R. J. Effect on the fit of removable partial denture frameworks when master casts are treated with cyanoacrylate resin. J. Prosthet. Dent. 1987;58(3):327-329.
CrossRef - Moser J. B.,Stone D. G.,Willough G. M. Properties and characteristics of a resin dye material. J. Prosthet. Dent. 1975;34(3):297-304.
CrossRef - Peyton F. A.,Leibold J.P.,Ridgley G. V. Surface hardness, Compressive strength,and abrasion resistance of indirect die stones. J. Prosthet Dent. 1952;2(3):381-389.
CrossRef - Schneider R. L.,Taylor T. D. Compressive strength and surface hardness of type IV die stones when mixed with water substitutes. J. Prosthet Dent. 1984;52(4):510-514.
CrossRef - Vermilyea G. S., Huget F. E,Wiskoski J. Evaluation of resin die materials. J. Prosthet. Dent. 1979;42(3):304-307.
CrossRef - Toreskog S., Philips W. R.,Schnell J. R. Properties of die materials .J. Prosthet Dent. 1966;16(1):119-131.
CrossRef - Lund T. Comparision of techniques for reinforcing stone models used to construct facial prosthesis .J. Prosthet Dent. 1996;76:297-301.
CrossRef - Finger W.,Dent M.,Ohsawa M. Accuracy of caste restorations produced by a refractory die investing technique. J. Prosthet. Dent . 1984;52(6):800-803.
CrossRef - Eames E. W., Edwards R. C., Buck H. W. Scraping resistance of dental die materials a comparision of brands. Operative Dentistry. 1978;3:66-72.

