
Manuscript accepted on :January 02, 2017
Published online on: --
Plagiarism Check: Yes
N. B. Prakash1 and D. Selvathi2
1Department of Electrical and Electronics Engineering National Engineering College, India.
2Department of Electronics and Communication Engineering, Mepco Schlenk Engineering College, India.
Corresponding Author E-mail: nbprakas@gmail.com
DOI : https://dx.doi.org/10.13005/bpj/1130
Abstract
Glaucoma is the retinal disorder which leads to irreversible vision loss. The main root cause of this disorder is hyper tension, which affects the optic nerves in retinal image. In this paper, an efficient diagnosis system is proposed for screening the Glaucoma disorder using retinal images of the patients. The Optic Disc (OD) and Optic Cup (OC) are segmented from retinal image and further Neuro retinal rim region is detected. The features such as Effective Local Binary Pattern (ELBP), Grey Level Coocuurence Matrix (GLCM) and Optic Band features are extracted from this neuro retinal rim region. These features are trained and classified using Support Vector Machine (SVM) classifier.
Keywords
Glaucoma; Optic Disc; Optic Cup; features; retinal images
Download this article as:| Copy the following to cite this article: Prakash N. B, Selvathi D. An Efficient Detection System for Screening Glaucoma in Retinal Images. Biomed Pharmacol J 2017;10(1). |
| Copy the following to cite this URL: Prakash N. B, Selvathi D. An Efficient Detection System for Screening Glaucoma in Retinal Images. Biomed Pharmacol J 2017;10(1). Available from: http://biomedpharmajournal.org/?p=13333 |
Introduction
Diabetic Retinopathy (DR) and Glaucoma are two irreversible disorders related with human retina. DR is caused by diabetes of the patients and the diabetic patients may or may not have the Glaucoma disorder. Screening both retinal disorders are important to prevent earlier vision loss. The number of ophthalmologists required for evaluation by direct examination becomes a limiting factor due to ageing, population growth, physical inactivity and obesity which contributes to increase the risk of vision loss.However, in large-scale screening scenario, these manual assessments are not precise, mostly in developing countries due to the insufficiency of trained experts and scarce modern imaging equipments. Hence, an automatic recognition system which automatically identifies the characteristics of these pathological disorders may be of great advantage for the disease identification.Glaucoma is the primary cause for blindness and the detection of glaucoma is essential in preventing visual loss. This vision loss disease can be caused by either diabetes or hyper tension. Glaucoma is a complication occurring in the eye leading to blurred or reduced capability of vision in diabetic or hypertension patients. Detection of Glaucoma minor indications is very indispensable as Glaucoma can occur without any major known symptoms.
At once the disease is detected through retinal examinations; immediate treatment is essential which includes laser surgery, glycemic and blood pressure control to prevent the earlier vision loss. Glaucoma can be identified by detecting the optic cup (OC) and optic disc (OD) from the retinal image and analyzing the rim area between OC and OD in the retina. OD is the brightest or higher intensity pixel region especially in the shape of circle in the retinal fundus photographs. Optic cup is the inner circular bright region of optic disc. The area between the OD and OC is necessary to diagnose glaucoma disease. Due to diabetes or hypertension, the neuro rim between optic cup and optic disc are either swelled or shrunken. By analyzing the swelling or shrinking of neuro rim in retina, the glaucoma disease is diagnosed. The severity of glaucoma is assessed depending on cup to disc ratio (CDR), which is the ratio of the optic cup, optic disc and neuro retinal rim surface areas in retinal image. CDR is an important structural indicator for evaluating the occurrence of the disease and its progression.Fig.1 shows the retinal image affected by Glaucoma disorder. The retinal blood vessels originated from the center of the optic disc are severely affected by its nature.
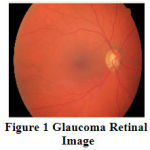 |
Figure 1: Glaucoma Retinal Image |
The organization of this paper is as follows. Section 2 details about various conventional techniques for Glaucoma detection and diagnosis.Section 3 proposes a novel methodology for Glaucoma detection using cup-to-disc ratio. Section 4 discusses the experimental results.Section 5 depicts the conclusion of this paper.
Literature Survey
Ahmed Almazroa et al (2015) proposed cup to disc ratio based Glaucoma detection methodology using the segmentation of OD and OC from the retinal image. The authors compared various methodologies for OD and OC screening for Glaucoma detection and diagnosis process. SrinivasanAruchamy et al. (2015) used circular Hough Transform to detect and localize the optic nerve head center in retinal images. The authors achieved an average OD segmentation accuracy of 97.5% for the retinal images available in publicly available dataset. The authors tested their proposed segmentation and Glaucoma classification algorithms on DSP processor to analyze its time consumption. KurnikaChoudhary et al. (2015) used artificial neural network for the detection and classification of Glaucoma disorder in diabetic patients. The authors used feed forward back propagation neural network for training and testing the retinal images for Glaucoma classifications. Prasad N. Maldhure et al. (2015) used the technique of OD and OC segmentation for Glaucoma detection and diagnosis process. The super pixel classification approach was used to segment the OD and OC regions in retinal images. The severity of Glaucoma was classified based on Cup to disc ratio. The authors achieved 96% of average Optic disc segmentation for Glaucoma detection.
G.Jayanthi et al. (2014) proposed Glaucoma screening technique on retinal images using level set approach. This method failed to give the optimum result on high resolution retinal images. The authors achieved average precision of 90% and Recall parameter of 96.6% for the optic disc segmentation in low resolution retinal images. Muthu Rama Krishnan et al. (2013) used trace transform for Glaucoma detection in retinal images. The Discrete Wavelet features were extracted from the retinal image and SVM classifier was used to train and classify these features. The authors achieved 91.67% as average classification accuracy for Glaucoma disorder classifications.
Materials and Methods
Materials
In this paper, the publicly available dataset HRF (High Resolution Fundus) is used to detect and diagnose Glaucoma disorder [14]. This dataset contains 45 retinal images, where 15 are categorized into normal and where 15 are categorized into DR images and where 15 images are categorized into Glaucoma images. In this paper, 15 images from both normal and Glaucoma retinal images are considered. Each retinal image was taken with a Canon CR-1 fundus camera with a field of view of 45° and different acquisition setting. This dataset also contains Ground truth or Gold standard images for OD segmentation by expert Ophthalmologist.
Methods
The proposed methodology for Glaucoma detection using retinal images in training and Classification mode are shown in Fig.2 and Fig.3, respectively. This proposed method consists of OD and OC segmentation using Morphological operations, Neuro retinal rim detection, Feature extraction and Classification.
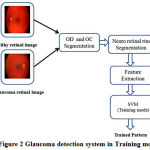 |
Figure 2: Glaucoma detectionsystem in Training mode
|
Fig.2 details the training mode of the SVM classifier which extracts and trains the features from both healthy and Glaucoma retinal images in HRF dataset. Fig.3 details the classification mode of the SVM classifier which extracts and classifies the features from test retinal image into either normal or abnormal. The healthy retinal images are categorized as normal and Glaucoma retinal images are categorized as abnormal.
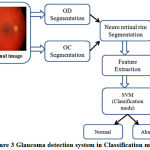 |
Figure 3: Glaucoma detection system in Classification mode |
OD segmentation
The OD region in retinal image as shown in Fig.4 (a)has the lower intensity pixels than the pixels in OC region. The OD and OC regions are extracted using binary mathematical morphology operations as follows. Initially, the retinal RGB image is separated into red, green and blue channels. The OD region is clearly visible in Red channel image[15] as shown in Fig.4 (b) and hence it is further used for OD and OC region extraction. The morphologically closing function with disc shaped structuring element 10 (pixels) is now applied on the red channel image and further morphologically opening function with disc shaped structuring element 20 (pixels) is applied on the same red channel image. The morphologically closed and opened image is shown in Figure 4 (c) and Figure 4 (d).
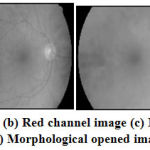 |
Figure 4: (a) Retinal Image (b) Red channel image (c) Morphological closed image (d) Morphological opened image |
Now, the absolute subtraction is performed between morphologically closed and opened images and the subtracted image will clearly shows the OD region which is shown in Figure 5a and its is overlaid on the retinal RGB image as shown in Fig.5b.
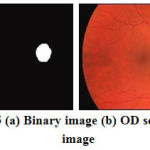 |
Figure 5: (a) Binary image (b) OD segmented image |
OC Segmentation
The OC region has higher intensity pixels than the OD region pixels and located inside the OD region as shown in Fig.6 (a). The segmentation of OC is a difficult task due to its boundary between OD and OC region. The Red channel is separated from RGB retinal image, which also shows the OC clearly. The independent component analysis method [10] has been employed on this red channel image to locate the OC region pixels with some redundant pixels. Next, the morphological opening function is applied on this image in order to remove the redundant pixels and locate the OC pixels exactly as shown in Fig.6 (b). Finally, the binary image is constructed from this morphologically processed image. The pixels with white in color are marked as OC pixels in the RGB retinal image. The OC segmented image is now subtracted from OD segmented image to extract the rim area as shown in Fig.6 (c) between OD and OC and it is further used for glaucoma severity classifications.
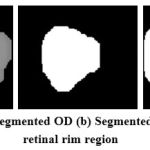 |
Figure 6: (a) Segmented OD (b) Segmented OC (c) Neuro retinal rim region |
Feature Extraction
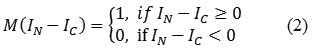
Features are the characteristics of the object which is used to differentiate one object from another object using its properties as morphological and texture. In this paper, Enhanced Local Binary Pattern (ELBP) and Grey Level Co-occurrence Matrix (GLCM) features are extracted from the neuro retinal rim region and these extracted features are given as input to SVM classifier. The ELBP feature is given as,
![]()
where, IN denotes the neighboring pixel in a square window (3×3), IC is the center pixel in the square window, ‘p’ denotes number of neighboring pixels around center pixel noted as 8 in 3×3 square window, ‘M’ denotes specific function and M (IN – IC ) is marked as the threshold value and it is estimated as,
The features Energy, correlation, homogeneity and contrast are used as GLCM features which are extracted from Neuro retinal rim region.
Optic Band features are also extracted from the neuro retinal image. The segmented neuro retinal rim region is divided into top band, bottom band, left band and right band. These four extracted bands are used as feature set for classifier. The extracted optic band feature images are shown in Fig.7.
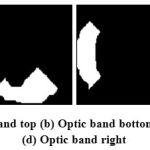 |
Figure 7: (a) Optic band top (b) Optic band bottom (c) Optic band left (d) Optic band right |
Classification
In this paper,SVM classifier is used for the classification of extracted feature patterns form neuro retinal rim region from both healthy and Glaucoma retinal images. In training mode of the SVM classifier, the features are extracted from both healthy and Glaucoma retinal images which are obtained from HRF open access dataset to derive the trained pattern. This trained pattern consists of feature patterns of both healthy and Glaucoma cases. In classification mode of the SVM classifier, the features from test retinal image is compared with the trained feature pattern to classify the test retinal image into either healthy or Glaucoma retinal image.
Results and Discussion
The proposed optic disc and cup segmentation algorithm have been applied for a set of images available in HRF database and the segmentation results were compared with their respective ground truth images given by specialized ophthalmologists.The performance parameters obtained after the segmentation of optic disc and optic cup region for a few set of images are tabulated and is given in Table 1.To measure the performance of the proposed method in detecting the optic cup and optic disc region on the fundus image, the proposed segmentation method is compared to its corresponding ground truth images. The ground truth fundus images used for our experimentation were obtained from the publicly available HRF database. The performance of optic disc segmentation is analyzed with the following parameters:
Sensitivity (Se=TP/(TP+FN))
Specificity (Sp=TN / (TN+FP))
Positive predictive value (Ppv=TP / (TP+FP))
Negative predictive value (Npv=TN / (TN+FN))
Accuracy (Acc=(TP+TN) / (TP+FN+TN+FP))
Precision=TP / (TP+FP)
False positive rate (FPR)=FP / (FP+TN)
False negative rate (FNR)=FN / (TP+FN)
Likelihood ratio positive (LPR)=Sensitivity / (1-Specificity)
Likelihood ratio negative (LNR)=(1-Sensitivity) / Specificity
These performance parameters are evaluated and listed in Table 1, where, TP denotes true positive, FP denotes false positive, FN is false negative and TN is true negative. True Positive refers to the correctly identified optic disc pixels, True Negative refers to the wrongly identified optic disc pixels, False Positive refers to the correctly identified background pixels and False Negative refers to the wrongly identified background pixels.The entire algorithm was run on the HRF database and results for optic disk and optic cup detection and segmentations were obtained. The MATLAB code takes 9 seconds per image on an average to run on a 2.1 GHz Intel Pentium Corei3 machine with 4GB of RAM.
Table 1: Optic Disc Segmentation Results
| Image | Se | Sp | Ppv | Npv | Acc | Pr | FPR | FNR | LPR | LNR |
| 1 | 81.60 | 98.96 | 80.41 | 99.76 | 98.74 | 50.41 | 1.04 | 18.40 | 7841.65 | 18.59 |
| 2 | 46.07 | 99.97 | 95.11 | 99.28 | 99.16 | 95.11 | 0.03 | 53.93 | 145290.73 | 53.95 |
| 3 | 73.34 | 99.95 | 96.53 | 99.52 | 99.48 | 96.53 | 0.05 | 26.66 | 154692.34 | 26.67 |
| 4 | 82.25 | 99.72 | 81.51 | 99.73 | 99.46 | 81.51 | 0.28 | 17.75 | 29266.43 | 17.80 |
| 5 | 65.17 | 99.82 | 83.44 | 99.53 | 99.36 | 83.44 | 0.18 | 34.83 | 37187.97 | 34.89 |
| 6 | 39.65 | 99.99 | 98.73 | 99.11 | 99.11 | 98.73 | 0.01 | 60.35 | 523320.18 | 60.36 |
| 7 | 99.17 | 99.45 | 72.09 | 99.99 | 99.44 | 72.09 | 0.55 | 0.83 | 17883.81 | 0.84 |
| 8 | 84.97 | 99.75 | 82.70 | 99.79 | 99.54 | 82.70 | 0.25 | 15.03 | 33457.09 | 15.07 |
| 9 | 64.90 | 99.81 | 81.26 | 99.57 | 99.39 | 81.26 | 0.19 | 35.10 | 34985.91 | 35.17 |
| 10 | 65.47 | 99.77 | 79.15 | 99.55 | 99.33 | 79.15 | 0.23 | 34.53 | 28964.76 | 34.61 |
| Average | 70.25 | 99.71 | 85.09 | 99.58 | 99.30 | 82.09 | 0.281 | 29.73 | 101289.08 | 29.79 |
The proposed methodology for OD segmentation provides 70.25% sensitivity, 99.71% specificity and 99.30% accuracy. Table 2 shows the extracted optic band features from neuro retinal rim region.
Table 2: Optic band features from Neuro retinal rim area
| Images | OBt | OBb | OBl | OBr |
| 1 | 1166 | 1038 | 1128 | 775 |
| 2 | 502 | 558 | 552 | 511 |
| 3 | 923 | 735 | 1120 | 680 |
| 4 | 1114 | 981 | 690 | 1042 |
| 5 | 894 | 1004 | 750 | 899 |
| 6 | 409 | 399 | 314 | 320 |
| 7 | 1481 | 1067 | 1785 | 1083 |
| 8 | 842 | 962 | 652 | 1145 |
| 9 | 587 | 655 | 550 | 649 |
| 10 | 921 | 788 | 699 | 783 |
OBt= Optic band top; OBb= Optic band bottom; OBl= Optic band left; OBr=Optic band right
Table 3 shows the performance comparisons of the proposed OD segmentation methodology with conventional methodologies as Koprowski et al (2014), Kavitha et al (2013) andMuthu et al (2012). The proposed OD segmentation methodology achieves 99.3% average accuracy while the conventional methodology Koprowski et al (2014) achieves 86% of an average accuracy, Kavitha et al (2013) achieves 93.5% of an average accuracy and Muthu et al (2012) achieves 93.4% of an average accuracy for OD segmentation. The reason behind the proposed OD segmentation methodology is that it detects and segments inner and outer boundary of the OD region more accurately when compared with other conventional techniques for OD segmentation. This proposed OD segmentation methodology also provides low and high resolution retinal images.
Table 3: Performance comparison of the OD segmentation in HRF dataset
| Methodologies | Year | Accuracy (%) |
| Proposed work | 2016 | 99.30 |
| Koprowski et al [6] | 2014 | 86.0 |
| Kavitha et al [8] | 2013 | 93.5 |
| Muthu Rama Krishnan et al [9] | 2012 | 93.4 |
Conclusion
In this paper, an automated efficient system for screening Glaucoma disorder is proposed through the segmentation of optic disc and optic cup region in retinal images. The optic disc and optic cup regions are segmented using Morphological operations as erosion followed by dilation. The features are extracted from neuro retinal rim region and these features are trained and classified using SVM classifier. The proposed OD segmentation methodology achieves 99.3% average accuracy while the conventional methodologies.
Acknowledgement
In this moment I would like to thank the institution National Engineering College and MEPCO Schlenk Engineering College for providing me the facilities to carry out this research work. I also extend my thanks to Head of Department, colleagues, family members and friends for their support and encouragement.
References
- Ahmed Almazroa, Ritambhar Burman, Kaamran Raahemifar, and Vasudevan Lakshminarayanan. Optic Disc and Optic Cup Segmentation Methodologies for Glaucoma Image Detection: A Survey.Journal of Ophthalmology., 2015; 1-28.
- Srinivasan Aruchamy, Partha Bhattacharjee and Goutam Sanyal. Automated Glaucoma Screening in Retinal Fundus Images. International Journal of Multimedia and Ubiquitous Engineering., 2015; 10(9): 129-136.
- Kurnika Choudhary and Shamik Tiwari. ANN Glaucoma Detection using Cup-to-Disk Ratio and Neuroretinal Rim. International Journal of Computer Applications., 2015; 111(11): 8-14.
- Prasad N. Maldhure, V.V.Dixit. Glaucoma Detection Using Optic Cup and Optic Disc Segmentation. International Journal of Engineering Trends and Technology., (2015); 20(2): 52-55.
- Jayanthi, G.Mary Amirtha Sagayee, and S.Arumugam. Glaucoma Detection in Retinal Image using Medial Axis Detection and Level Set Method. International Journal of Computer Applications., 2014; 96(3): 42-48.
- Koprowski, R, Rzendkowski, M and Wrobel, Z. Automatic method of analysis of OCT images in assessing the severity degree of Glaucoma and the visual field loss. Bio Medical Engineering Online., 2014., 13(16): 3-18.
- M Muthu Rama Krishnan and Oliver Faust. Automated Glaucoma Detection Using Hybrid Feature Extraction In Retinal Fundus Images. Mech. Med. Biol.,2013; 13(1): 1-21.
- Kavitha, S and Duraiswamy, K. An automatic retinal optic disc segmentation algorithm using differential windowing in the polar coordinate domain. Australian Journal of Electrical and Electronics Engineering., 2013; 10(1): 33-44.
- Muthu Rama Krishnan, M, Chua Kuang Chua and Lim Choo Min. Application of intuitionistic fuzzy histon segmentation for the automated detection of optic disc in digital fundus images. Proceedings of the IEEE–EMBS International Conference on Biomedical and Health Informatics., 2012; 444-447.
- Dominic Langlois, Sylvain Chartier, and Dominique Gosselin. An Introduction to Independent Component Analysis InfoMax and FastICA algorithms. Tutorials in Quantitative Methods for Psychology., 2010; 6(1): 31-38.
- Koen A Vermeer, Frans M Vos, Barrick Lo, Qienyuan Zhou, Hans G Lemij, Albert M Vossepoel and Lucas J van Vliet. Modeling of Scanning Laser Polarimetry Images of the Human Retina for Progression Detection of Glaucoma. IEEE Transactions on Medical Imaging., 2006; 25(5): 517-528.
- Kwokleung Chan, Te–Won Lee, Pamela A Sample, Michael H Goldbaum, Robert N Weinreb and Terrence J Sejnowski. Comparison of Machine Learning and Traditional Classifiers in Glaucoma Diagnosis. IEEE Transactions on Biomedical Engineering., 2002; 49(9): 963-974.
- Lalonde, M, Beaulieu, M and Gagnon, L. Fast and robust optic disc detection using pyramidal decomposition and hausdorff–based template matching. IEEE Transactions on Medical Imaging., 2011; 20(11): 1193-1200.
- Thomas Köhler, Attila Budai, Martin Kraus, Jan Odstrcilik, Georg Michelson, Joachim Hornegger. Automatic No-Reference Quality Assessment for Retinal Fundus Images Using Vessel Segmentation. 26th IEEE International Symposium on Computer-Based Medical Systems., 2013;
- Nur Ayuni Mohamed,Mohd Asyraf Zulkifley, Aini Hussain, Aouache Mustapha. Local Binary Patterns and Modified Red Channel for Optic Disc Segmentation. Journal of Theoretical and Applied Information Technology., 2015; 81(1): 84-91

