Sadeghi Limanjoob Reza1, Farzam Mohsen2, Jamali Houshang3, Syahmard Nahid4 , kargar Jahromi Hossein5 and Farzam Mohammad2
1Department of Aquatic Animal Health, Veterinary School, Kazerun Branch, Islamic Azad University, Kazerun, Iran.
2Department of Physiology, Veterinary School, Kazerun Branch, Islamic Azad University, Kazerun, Iran.
3Department of Microbiology, Jahrom Branch, Islamic Azad University, Jahrom, Iran.
4Department of Physiology, Medical School, Kazerun Branch, Islamic Azad University, Kazerun, Iran.
5Zoonoses research center, Jahrom University of Medical Sciences, Jahrom, Iran.
DOI : https://dx.doi.org/10.13005/bpj/498
Abstract
The growth rate of fish is an important parameter in fish farms that influenced by environmental factors, including the amount and frequency of feeding is feeding. It is stated that the growth rate of fish is considerably dependent on the weight and age of the fish. In this study the possible effects of the amount and frequency of feeding on weight changes and growth rate of rainbow trout was examined. For this project, six pools with a capacity of 6,200 rainbow trout of 10 g was transferred, that 3 pools were fed with 2% of body weight (treatment 1) and 3 pools were fed with 4% of body weight (treatment 2) and biometry were done in a monthly basis until reaching to weight. Data obtained were analyzed using a statistical method of Paired t-test and SPSS considering P <% 5 for levels of significance. Results obtained indicated that the treatment 2 pools in the weight range 10-25 g and water temperature 14-16 ° C show more weight lower feed conversion coefficient compared to treatment 1 pools. The results indicate that the use of treatment 2 resulted in better growth of fish, therefore this diet is recommended.
Keywords
rainbow trout; biometry; feed conversion coefficient; growth rate
Download this article as:| Copy the following to cite this article: Reza S. L, Mohsen F, Houshang J, Nahid S, Hossein K. J, Mohammad F. Comparison of the Daily Diet by Weight in Rainbow Trout (Onchorhynchus mykiss) with Concentrate Feed to Achieve a Minimum FCR and Effective Period of Growth in Beyza Regional Climate. Biomed Pharmacol J 2014;7(1) |
| Copy the following to cite this URL: Reza S. L, Mohsen F, Houshang J, Nahid S, Hossein K. J, Mohammad F. Comparison of the Daily Diet by Weight in Rainbow Trout (Onchorhynchus mykiss) with Concentrate Feed to Achieve a Minimum FCR and Effective Period of Growth in Beyza Regional Climate. Biomed Pharmacol J 2014;7(1). Available from: http://biomedpharmajournal.org/?p=2992 |
Introduction
Fish farming has been the human interest for long from 2000 years before Christ. In Greek and Roman fish were caught from natural pond and grew in artificial pools. Most remarkable is that Aristotle in his writings writes of fish farming as a lucrative profession. Fish farming began in China and the history of farming in the country goes far more than three thousand years ago to about 460 BC and in the (Waring Kingdom) area was developed. Fan Li was the first person who formulated the principles of freshwater fish farming. According to the history of fish farming in the world, the activity started in 1922 in Iran and rainbow trout farming has started since 1959 (1).
Animal protein plays a very important role in the growth and health in human nutrition. Fish is one of the sources of animal protein. Increasing protein supply for this type by fishing and fish populations decline is one of the challenges ahead. Farmed fish should grow fast and reach normal expected weight by breeding, they should suit the taste of the region and marketable. In addition to normal food, they should be fed by inexpensive artificial food. They should be resistant to the physicochemical conditions of water regime changes. They should tolerate illnesses and manipulations and tolerate dense living conditions well with the capability of mass reproduction. There should be possibility of food preparation and other needs in the region (1).
Rainbow trout (Onchorhynchus mykiss) is a kind of farmed fish that is domesticated since late nineteenth century and is grown for consumption and is marketable. Rainbow trout farming industry is now developing and is especial in countries able to provide a nurturing environment for freshwater or saltwater (2).
Very high consistency and easy to grow and reproduce have introduced the fish to different parts of the world and is farmed in most parts of the world with different climates.
Iran has little experience in Rainbow trout farming but in recent years, remarkable progress has been made in its breeding and growing, so that the rate of production of 440 tons in 1989 increased to 45,000 tons in 2006 (1).
In Aquaculture activities the cost of food is about 40 to 70 percent of total raising cost, therefore there is a constant need to know the best food alternation since the best food alternation reduces the farming costs to achieve the highest growth performance and feed conversion ratio (3). In addition to the quality and quantity of food, thus feeding methods are among optimal utilization of food. Fish is fed manually or by automatic devices in various frequencies (4).
Also because of the differences in sizes of fish and weighted average error food ratio calculation will not be accurate.
Smaller fish is not successful to compete with larger fish, so fails to grow or grows very slowly. (5) If the diet is high in protein, the body uses it for energy, and this is not economical because the diet cost increases (15). In studies on (Morone chrysops × M. saxatilis) bass fish that were fed twice a day show higher final weight and weight gain percentage than fish fed once per day, respectively. (6) Also, Teshima et al (1984) in research on the Channs channs found that feeding two times a day shows more growth than feeding once a day. Maximum FCR in fish with an initial weight of 10 grams was for dietary treatment of 2 times per day. (7)
It was stated that the most important and most expensive part of fish farming is feeding. Without any doubt, any change in diet that can meet the production process to reduce costs and increase revenue will be welcomed by the manufacturers. This study aimed to investigate possible changes in the diet of rainbow trout to harvest earlier and reduce some of the costs and effects on feed conversion of fish.
Methods
The experiment was conducted in the Beyza village area, Sepidan in Shiraz road. This region in located in northern latitudes between 29/48 degrees 15 minutes 30 seconds east along the geography of between 52 degrees and 52 degrees, 37 minutes, 7 minutes and 30 seconds. Fish farm area of 2 acres and 48 based on the system “Reese’s” were linked to each other. For this experiment, six pools close to each other (1, 2, 3,4,5,6 pools) were considered. Farm water was supplied from Mahsarom oliya springs with a temperature of 14-16 ° C. rate of 600 liters per second, E.coli average dissolved oxygen in water 7, outlet oxygen out 5.7 with microbial cultures in water 7.9 PH, respectively. There was 62 kg of fish with nearly the same average weight within each pool. Pools 1, 2 and 3 were fed based on factory 21 Beyza feeding table (Table 1) and pools, 4,5,6 were fed based on factory 21 Beyza feeding table 2.
Table 1: Rate of daily feeding 1, based on fish weight at a temperature of 16-14 ° C
| Over 300 gr | 150-300 gr | 150-75gr | 25-75gr | 10-25gr | Temperature 14-16
Weight |
| 42/1 | 45/1 | 65/1 | 76/1 | 6/2 | Feeding table 1 |
Table 2: Rate of daily feeding 1, based on fish weight
| Over 300 gr | 150-300 gr | 150-75gr | 25-75gr | 10-25gr | Weight |
| 88/2 | 94/2 | 38/3 | 76/3 | 4 | Feeding table 2 |
The first biometric test was performed on February 15, 2013. For this purpose, a plastic container with dimensions 40 Í 60 cm and 20 cm depth, with some water (no fish) was weighted as baseline weight. The two following formulas were used to determine the diet:
Fish biomass= number × average weight of the fish: Formula 1
The total amount of fish food in g = Fish biomass × percentage of fish daily feeding: Formula 2
In explaining the ferrule it is noteworthy that the total weight of pool fish was calculated based on sampling and their total number in g (biomass). Then, using Tables 1 and 2 temperature column and weight row of diet % were determined.
Two days before the days of disinfecting the pools, the fish fed were cut and the food cut days are also calculated. Tested treatments were based on two types of feeding table. Pools 1, 2, 3 were feeding based on Table 1 and pools 4, 5, 6 were feeding on Table 2.
Increased average weight of fish in each monthly period represents the natural growth of the fish in both diets. As can be seen in Figure 1, the weight of fish in the diet 2 is more compared to diet 1 (p <% 5). On the other hand average fish weighing in a total period of 6 months (Figure 1) indicate a significant difference at 5% level between the two diets (82.6 compared to 119.2 g)
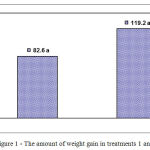 |
Figure 1: The amount of weight gain in treatments 1 and 2
|
Pools fed Biomass for diet 2 at 5% level was more that fed diet 1 pools. The weight difference between the two diets was also observed in the mean biomass per pool. (Figure 2)
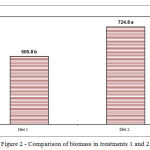 |
Figure 2: Comparison of biomass in treatments 1 and 2
|
Fish mortality in both diets was tested. This value is not significant. Therefore, increased biomass and average weight was also directly correlated (Figure 3).
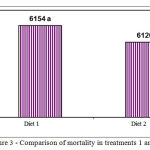 |
Figure 3: Comparison of mortality in treatments 1 and 2
|
Feed conversion ratio to fish weight and feeding in pools fed by diet 2 is significantly more than pools fed by diet 1, respectively (Figure 4 and 5).
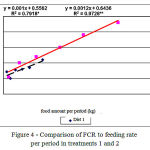 |
Figure 4: Comparison of FCR to feeding rate per period in treatments 1 and 2
|
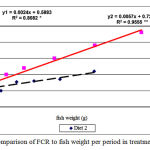 |
Figure 5: Comparison of FCR to fish weight per period in treatments 1 and 2
|
Discussion
Due to the fact that little research regarding the daily feeding rate based on weight to achieve minimum FCR and effective growth has been conducted, issues related to the results of the research will be discussed. The results of the FCR statistical analysis of the different treatments tested showed (p <% 5) that the treatment 1 in terms of feed conversion is better than treatment 2. And the difference is significant in this context.
In fish, unlike warm-blooded animals, the body temperature varies with ambient temperature and the animal does not need energy to keep it. This is why compared to warm-blooded animals, the amount of energy spent on anabolism or material will be higher and vice versa, the energy consumed for catabolic activities (biological activity except growth) is less. Thus the amount of meat produced compared to the amount of livestock and poultry foods is more; FCR in fish is usually influenced by several factors such as species, breed, genetics, gender and environmental conditions such as water temperature, oxygen, water flow rate and food quality. In this experiment, all factors other than food for the two treatments are the same, so we can say that such factors other than food quantity can cause significant differences in the amount of feed conversion between the two dietary treatments. On the other hand, human error in creating the differences in feed conversion ratio is effective.
These factors are
Lack of sufficient accuracy in the estimation of live weight of fish in the pool or nurturing environment
feeding when dissolved oxygen is less than perfect
Error calculating the daily feeding
Error in weighing food
Error in feeding less than the amount required
Inappropriate feeding times
improper feeding pellets
given that this test tries its best prevent any of the errors listed above in calculating the amount of feed conversion, therefore we can say that the only factor in making a significant difference in FCR dietary treatments 1 and 2, is the quantity food consumed. This means that the amount of food directly affected on improving FCR.
In nutrient studies the average growth rate of a group or population is the most important parameters for the specific growth rate (SGR). The growth rates must be measured in the same way in order to compare groups or populations in different treatments. Similar growth expression is taking into account only when the time value is given. Growth is expressed in specific growth rate, or SGR. These values are estimated by applying the following formula:

In this project, the specific growth rate for each pool of both treatments was measured on a monthly basis using the above formula. Given that the weight 10 to 25 g in treatment 2 fcr is less than treatments 1 and sgr is greater treatment 1, one can suggest that breeders in weighing 10 to 25 g with water temperature 14 to 16 ° C instead of 2% of body weight diet better to use the amount of 4% body weight diet. In 10 g weight, increased feeding frequency is associated with improved some growth parameters such as final weight, daily weight gain and growth, but with reduced FCR and SGR. This means that the amount of feed used in this experiment have a direct impact on the growth of fish and fish with higher diets (treatment 2) has a higher weight than treatment 1.
Conclusions
The results of the statistical analysis of average weighted of the different treatments tested showed despite identical growth factors such as (temperature, oxygen, water, food quality, density, lighting conditions, fish size and water content) the two treatment significant difference is due to different treatments and the amount of used food. This means that the amount of feed used in this experiment have a direct impact on the growth of fish and fish with higher diets (treatment 2) has a higher weight than treatment 1.
References
- NafisiBahabadai, , FalahatiMarvast,A., (1378): Principles ofrainbow troutreproduction, BushehrUniversity ofthe Persian Gulf.
- Abdullah Mashaei, , (1379) Guidelines salmonbreedingand reproduction, Nourbakhsh Publication,.
- Kenneth, R.t., carl, D.W., Ann, M.M., Ebony, J.G., (2000): Effect of different feeding frequecies on growth, body composition, cuel fillet composition of juvenile sunshine bass, Morone chrysopsxM. Sazatilis, growh Indoors. Journal of Applical Aqvaculture, 10(2),55-62.
- Galano, T.G., Pevez, J.C., Gaxieola, G. Y.A., (2003): Effect of feeding frequency on food intake, gastric Evacuation and growth in juvenile snook, centropomus undecimalis (Bloch). Rev. Invest. Mar 24(2), 145-154.
- Turker, A., Dernekbasi, S.Y., 2006. Effects of restricted feeding on performances of rainbow trout (Oncorhynchus mykiss). J. of Fac. of Agric., OMU, 21(2), 190-194.
- Lazo, J.p., Davis, D.A., Arnold, C.R., (1998): The effects of dietavy protein level on growth, feed efficiency and survival of juvenile florid pompano (Trachnotus carolinus). Aquaculture 169(3-4), 225-232.
- Yone, Y., (1976): Nutritional stvdies of red sea bream. In proceedings of tufirst.


