
Kirti1 , Harsh Sohal2, Shruti Jain3
Electronics and Communication Engineering Department, JaypeeUniversity Information Technology, Solani, H.P India.
Corresponding Author E-Mail: kirtitripathifzk@gmail.com
DOI : https://dx.doi.org/10.13005/bpj/1556
Abstract
Heart Rate Variability (HRV) is an important criterion to check the cardiac health. Sudden HRV signifies the unhealthy condition of the heart, particularly when the person is suffering from a cardiac disease. HRV parameters on different patients of different ages, gender and health conditions are observed using time domain, geometrical domain and frequency domain. Statistical comparison is done on three different databases MIT/BIH Normal Sinus Rhythm (NSR), MIT/BIH Arrhythmia (AR) and MIT/BIH Atrial Fibrillation (AF) using Analysis of Variance (ANOVA) technique. We have extracted twenty HRV features from all the three domains, which show weak, moderate or strong significant changes as per the relation during comparison with respective databases. Out of twenty only nine features are selected which shows noticeable difference between three databases. Later, the selected features will be used for classification in future.
Keywords
Analysis of Variance; Finite Impulse Response; Heart Rate; Heart Rate Variability
Download this article as:| Copy the following to cite this article: Kirti K, Sohal H, Jain S. Comparative Analysis of Heart Rate Variability Parameters for Arrhythmia and Atrial Fibrillation using ANOVA. Biomed Pharmacol J 2018;11(4). |
| Copy the following to cite this URL: Kirti K, Sohal H, Jain S. Comparative Analysis of Heart Rate Variability Parameters for Arrhythmia and Atrial Fibrillation using ANOVA. Biomed Pharmacol J 2018;11(4). Available from: http://biomedpharmajournal.org/?p=24826 |
Introduction
Electrocardiography (ECG) is a non-invasive method to extract electrical signals produced by Sino-Atrial (SA) node in the heart. By monitoring the ECG of a patient, prediction can be made which helps the doctor to take effective steps clinically.1,2 A significant decrease in the mortality rate of sudden heart attack cases can be achieved by regularly monitoring the ECG. ECG signal consists of several features delineating from P, QRS and T wave. Among all these features Heart Rate (HR) is an important feature to diagnose the cardiac.2,3 HR is calculated using the RR interval (the difference between two consecutive R-peaks). RR interval is the most prominent feature of the Heart Rate Variability (HRV) while other features are directly or indirectly dependent on it. HRV is a measure of fluctuation in between two heartbeats with respect to time.
HRV is controlled by the primary part of our brain which is Autonomic Nervous System (ANS). It guides the working of HR, blood pressure, breathing and digestion despite from our desire. Nowadays, HRV is used to provide the information about our mental and physical health by observing one’s lifestyle.4,5 HRV parameter assists clinicians to monitor sleep, stress, physical activity, emotion, thought, feelings etc. features on their patients. Low HRV signifies poor cardiac health that leads towards anxiety, high blood pressure and cardiac arrest, whereas high HRV represents a healthy heart. HRV components can be calculated in the time domain, geometrical domain and frequency domain.6
Various platforms are available nowadays for the collection of the database (offline and online).7 Firstly, pre-processing is done on the database to eliminate the undesired signal from the useful signal.8,9 Two types of unwanted signals are present which are Power Line Interference (PLI) and Baseline.
Wander (BLW). To remove these noises, Finite Impulse Response (FIR) or Infinite Impulse Response (IIR) digital filters are used. IIR Butterworth filter is used by authors to diminish these noises.10 The same filter of 4th order is used by R. J. Ellis et al. for pre-processing.11
Butterworth filter is an IIR filter and it is not hardware implementable due to its unstable nature. A. M. A. Hassan used FIR filter to remove these unexpected signals due to ease of its hardware implementable nature.12 Secondly, feature extraction is done by F. Shaffer & J. Ginsberg to extract the parameter of HRV for different duration and domains.13 There are various statistical tests which are used for the comparison in between and within groups like t-test, f-test, ANOVA etc. If the comparison is in between two groups then the t-test or f-test is used, while if more than two groups are there then ANOVA test is preferred.14 If we use the t-test or f-test on more than two groups, Type-I error will be introduced, which is unacceptable during statistical test performance. ANOVA test is a statistical test used for comparison or finding a relationship between or within features. Z. Qin et al. extract time and frequency domain features of HRV for the stress level evaluation.15 He also executed the ANOVA test for the statistical comparison among different level of stress. S. Agarwal and A. Wadhwani use ANOVA test on HRV features for the evaluation between meditative state and non-meditative state of a person.4 In this paper we have used three online databases: MIT/BIH Normal Sinus Rhythm (NSR), MIT/BIH Arrhythmia (AR) and MIT/BIH Atrial Fibrillation (AF). From these databases of ECGs, removal of artifact is done by using digital FIR Kaiser Window filter because it has better frequency response than other conventional windows. Later from the filtered ECG signal, we have extracted time domain, geometrical domain and frequency domain HRV features. In the end, comparison of different databases on the basis of best features is done by using ANOVA test.The paper is structured as: Section 2 describes the different processing steps to be applied on different databases like MIT/BIH NSR, MIT/BIH AR and MIT/BIH, Section 3 discusses the results of the different processing steps which is concluded in the last section.
Methodology
The process for the statistical analysis of feature processing consists primarily of pre-processing, feature extraction, feature selection and classification phase.16-18 In this paper, we are concentrating on the first three steps.19 Figure 1 illustrates the block diagram of HRV feature processing.
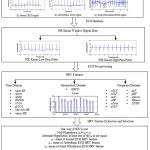 |
Figure 1: Block diagram of methodology of HRV Feature processing
|
Database Collection
The online platform of Physionet is used for database collection. These databases are MIT/BIH Normal Sinus Rhythm (NSR), MIT/BIH Arrhythmia (AR) and MIT/BIH Atrial Fibrillation (AF) with 18 records each.7 The sampling frequency of NSR, AR and AF database are 128 Hz, 360 Hz, and 250 Hz respectively. The database contains measurable data of the interval scale. Which helps in apply statistical parameter.
ECG Pre-processing
Several noises in ECG signals are introduced during the acquisition of the signal from the patient body. Among them, Power Line Interference (PLI) and Base Line Wander (BLW) are of main concern.20 These two unwanted signals create hindrance while extracting the useful information from the ECG wave. Pre-processing is done using a digital filter to diminish these undesirable signals.21 In this paper, FIR digital filters are used due to its simplicity in hardware implementation. Among various FIR filters, FIR Kaiser Window is used because it gives better frequency response as compared to other windowing technique. Useful bandwidth of ECG signal lies in between 0.5 Hz to 50 Hz. PLI is a high-frequency noise introduced due to the biomedical instrument used for the acquisition of ECG signal. PLI is eliminated using FIR Kaiser Low Pass Filter (LPF) having cut off frequency (‘fc’) of 50 Hz. Respiration during signal acquisition is the main cause of BLW containing low-frequency noise. Removal of BLW can be done be using FIR Kaiser High Pass Filter (HPF), having ‘fc’ of 0.5 Hz. Later, we have obtained a denoised/filtered signal which is used for HRV parameter extraction.
R-peak Detection
ECG signal consists of mainly three waves P, QRS and T. Among these QRS wave is the prime focus, which can be further divided into three sub-waves Q, R and S. R wave is the most prominent feature of QRS due to its high positive peak. In this paper, the Pan-Tompkins Algorithm for QRS and R peak detection is used.22 For QRS detection, squaring and moving window integration is used. Since R wave is a positive peak, so squaring is done to eliminate all the negative peaks. Adaptive Thresholding is used for extraction of the R-peak from QRS wave after eliminating abnormal beats.
HRV Feature Extraction
Feature extraction from the R-peak of a filtered signal is the essential part for HRV feature processing.23 HRV features are divided into three domains: time domain, geometric domain and frequency domain. Spectrum for RR interval in time and frequency domain is demonstrated in Figure 2. Table 1 represents the explanation of HRV features of different domains with their related formulas.
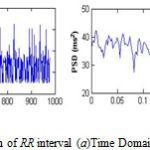 |
Figure 2: Spectrum of RR interval (a)Time Domain(b) Frequency Domain |
HRV Feature Selection
A number of HRV features are present in various domains as defined but only some of them shows a noteworthy effect. That’s why correlation among different HRV features of various domains expressed at two significance levels (95% and 99%) is shown in this paper. HRV parameters which show high correlation factor get selected while others are discarded. For the comparison of three groups of ECG databases, ANOVA test is used in different domains. ANOVA test demonstrates the variation among the mean of HRV parameters for different databases.
Result and Discussion
The input signal of ECG from different databases is used in this work which is demonstrated in figure 3. Fig. 3a represents the NSR ECG wave, Fig. 3b shows the AR ECG wave and Fig. 3c illustrates the AF ECG wave.
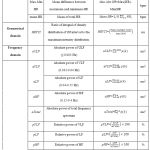 |
Table 1: HRV measures of time, geometrical and frequency domain2 |
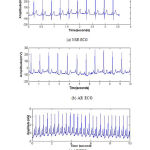 |
Figure 3: ECG signal of (a) Normal Sinus Rhythm ECG (b) Arrhythmia ECG (c) Atrial Fibrillation
|
In Pre-processing stage FIR Kaiser Window is used to denoise the signal from unwanted noises like PLI and BLW using LPF and HPF respectively. Fig. 4a shows the removal of PLI using LPF and Fig. 4b represents the removal of BLW using HPF.
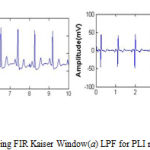 |
Figure 4: Filtered ECG signal using FIR Kaiser Window(a) LPF for PLI removal (b) HPF for BLW removal |
After getting filtered output, the Pan-Tompkins algorithm is used for real-time QRS detection. This algorithm is used for extracting the R-peak of QRS wave. R-peak is the most important feature to calculate various HRV parameters. Figure 5 demonstrates the R-peak from different QRS waves.
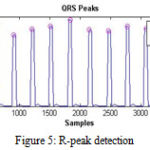 |
Figure 5: R-peak detection
|
Detection of R-peak helps in calculating various HRV features for different domains as described in Table 1. Time domain HRV feature describes the temporal variability of heart rate whereas the frequency domain of HRV feature defines the frequency distribution in a different frequency range. The geometric distribution gives the basic measurement to calculate the width of the RR interval histogram. Before doing any statistical test for comparing, the data must be normalized ( the ‘p’ value should be greater than 0.05). After a normality check, ANOVA test for comparison is used.
In the ANOVA test, hypothesis testing is done on HRV features for different databases as mentioned earlier. In this paper, we have considered two hypothesis, null hypothesis (Ho) and alternative hypothesis (H1). Ho means no variation and H1 signifies at least one of the mean is unequal.11 For ANOVA average case
Ho:µ1=µ2=µ3
H1=at least one of the mean is unequal
where, µ1 = Mean of NSR HRV feature
µ2 = Mean of AR HRV feature
µ3 = Mean of AF HRV feature
Table 2 depicts the comparative results of the ANOVA test, which represents the significant variation among parameters of different datasets. The table illustrates the value in Mean ± Standard Deviation (SD) form. On the basis p-value significance level can be illustrated as.
p> 0.05 = Weak Significance (WS)
0.05<p ≤ 0.10 = Moderately Significance (MS)
p ≤ 0.05 = Strongly Significance (SS)
Table 2: Comparison of HRV features using ANOVA
| Domain | HRV Features |
MIT/BIH NSR Database |
MIT/BIH AR Database |
MIT/BIH AF Database |
p-value |
|
Time Domain |
mean RR | 6.63E2±6.72 | 6.71E2±14.40 | 6.77E2±25.96 | p >0.05 |
| SDNN | 1.44E2±3.89 | 1.42E2±17.20 | 1.46E2±9.17 | p >0.05 | |
| SDSD | 1.98E2±5.53 | 1.84E2±20.76 | 1.97E2±13.47 | p <0.05 | |
| RMSSD | 1.98E2±5.64 | 1.84E2±20.75 | 1.97E2±13.47 | p <0.05 | |
| NN50 | 7.88E2±19.23 | 5.37E2±28.54 | 8.09E2±50.45 | p<0.05 | |
| pNN50 | 52.28±0.89 | 55.51±2.65 | 54.80±3.12 | p <0.05 | |
| Max-Min HR | 61.11±0.76 | 61.78±1.00 | 61.28±1.18 | p >0.05 | |
| mean HR | 97.05±1.83 | 93.78±4.05 | 94.89±5.32 | 0.01< p ≤0.05 | |
| Geometrical Domain | HRVTI | 22.24±3.63 | 26.92±5.23 | 21.49±6.50 | p <0.01 |
| Frequency
Domain |
aULF | 0.07±0.008 | 0.073±0.007 | 0.76±0.008 | p <0.05 |
| aVLF | 1.34±0.03 | 1.33±0.058 | 1.37±0.041 | p <0.05 | |
| aLF | 4.08±0.60 | 4.01±0.11 | 3.95±0.66 | p >0.05 | |
| aHF | 9.34±0.082 | 9.13±0.25 | 8.89±1.90 | p <0.05 | |
| aTotal | 14.76±0.14 | 14.47±0.37 | 14.81±0.29 | p <0.05 | |
| pVLF | 9.07±0.18 | 9.17±0.28 | 9.27±0.30 | p >0.05 | |
| pLF | 27.64±0.27 | 27.72±0.47 | 27.72±0.36 | p >0.05 | |
| pHF | 63.28±0.21 | 63.04±0.58 | 63.06±0.57 | p >0.05 | |
| Lfnorm | 0.30±0.002 | 0.30±0.005 | 0.30±0.004 | p >0.05 | |
| Hfnorm | 0.70±0.002 | 0.69±0.005 | 0.69±0.004 | p >0.05 | |
| LF/HF | 0.44±0.005 | 0.44±0.01 | 0.44±0.009 | p >0.05 |
The feature values can be affected by the sampling frequency and waveform duration of the database taken while processing. In this paper, we have generated the results at 1000 Hz sampling frequency for a long-term database. After observing the results of ANOVA test for these specifications, it is interpreted that some HRV features like SDSD, RMSSD, NN50, pNN50, HRVTI, aULF, aVLF, aHF, and aTotal gives a strong indication to reject Ho. It represents that these features show a significant variation in their mean value. While, all other parameters show weak evidence against to reject Ho, except mean HR which represents moderate significant change. Mostly HRV feature represents a strong significant change which denotes that there is a substantial difference occurring among different databases. After analyzing the p-value of ANOVA which signifies the noticeable variation among different databases, we have selected the best HRV features. Best selected features are SDSD, RMSSD, NN50, pNN50, mean HR aULF, aVLF, aHF and aTotal which we will be used for further classification in the future.
Conclusion
This paper presents the statistical comparison among HRV features of different domains (time, geometrical and frequency) and databases (NSR, AR and AF). In the pre-processing stage FIR Kaiser digital filter is used to eliminate noise from different database. Then, twenty HRV features are extracted from different domain & feature selection is done with correlation test. For the comparison between three databases, ANOVA test has been used to yield the best features. Only 9 out of 20 features show noteworthy difference between three databases. In future, these selected features will be used for classification. Later, hardware implementation of HRV feature processing will be done using VIVADO tool on FPGA.
References
- Parashar N., Jain S., Sood M and Dogra J. Review of biomedical system for high performance applications. International Conference on Signal Processing. Computing and Control. 2017;300-304
CrossRef - Shaffer F and Ginsberg J. An overview of heart rate variability metrics and norms. Frontiers in public health. 2017;5:258.
CrossRef - Li Y., Tang X.,Xu Z and Yan H. A novel approach to phase space reconstruction of single lead ECG for QRS complex detection. Biomedical Signal Processing and Control. 2018;39:405-415.
CrossRef - Agarwal S and Wadhwani A. Analysis of Heart Rate Variability During Meditative and Non-Meditative State Using Analysis of Variance. International Journal of Advanced Biological and Biomedical Research. 2013;1:728-736.
- Parashar N., Jain S., Sood M. Semiautomatic Detection of Cardiac Diseases employing Dual Tree Complex Wavelet Transform. Periodicals of Engineering and Natural Sciences (PEN). 2018;6:129-140.
- Dhiman A., Dubey S.,Jain S. Design of Lead II ECG Waveform and Classification Performance for Morphological features using Different Classifiers on Lead II. Research Journal of Pharmaceutical. Biological and Chemical Sciences. 2016;7:1226-1231.
- Goldberger A. L., Amaral A., Glass L.,Hausdorff J. M., Ivanov P. C., Mark R. G., et al. PhysioBank, PhysioToolkit and PhysioNet: components of a new research resource for complex physiologic signals Circulation. 2000;101:e215-e220.
CrossRef - Acharya U. R., Fujita H., Adam M., Lih O. S., Sudarshan V. K.,Hong T. J., et al., Automated characterization and classification of coronary artery disease and myocardial infarction by decomposition of ECG signals: A comparative study. Information Sciences. 2017;377:17-29.
CrossRef - Jain S. Implementation of marker proteins using standardised effect. Journal of Global Pharma Technology. 2017.
- Kambo T.,Avtarjaswal R. De-noising and statistical feature extraction of the ecg signal using wavelet analysis. International Journal Of Electrical, Electronics And Data Communication. 2016;4
- Ellis R. J., Zhu B., Koenig J., Thayer J. F and Wang Y. A careful look at ECG sampling frequency and R-peak interpolation on short-term measures of heart rate variability. Physiological measurement. 2015;36:1827.
CrossRef - Hassan A. M. A. FPGA Realization for Baseline Wander Noise Cancellation of ECG Signals using Wavelet Transform. International Journal of Computer Applications. 2017;168.
- Urooj M., Pillai K.,Tandon M., Venkateshan S and Saha N. Reference ranges for time domain parameters of heart rate variability in indian population and validation in hypertensive subjects and smokers.Int J Pharm Pharm Sci. 2011;3:36-39.
- Jain S. Regression analysis on different mitogenic pathways. Network Biology. 2016;6:40.
- Qin Z., Li M., Huang L and Zhao Y. Stress level evaluation using BP Neural network based on time-frequency analysis of HRV. IEEE International Conference on Mechatronics and Automation. 2017;1798-1803.
CrossRef - Bhusri S and Jain S. Analysis of breast lesions using laws’ mask texture features. Fourth International Conference on Parallel, Distributed and Grid Computing. 2016;56-60.
CrossRef - Jain S. Classification of Protein Kinase B using discrete wavelet transform. International Journal of Information Technology. 2018;10:211-216.
CrossRef - Rana S., Jain S and Virmani J. Classification of focal kidney lesions using wavelet-based texture descriptors. International Journal of Pharma and Bio Sciences. 2016;7:646-652.
- Sharma S., Jain S and Bhusri S. Two Class Classification of Breast Lesions using Statistical and Transform Domain features. Journal Of Global Pharma Technology Methodology. 2017;9:18-24.
- Parashar N., Jain S., Sood M. Removal of electromyography noise from ECG for high performance biomedical systems. Network Biology. 2018;8:12.
- Singh G and Prakash N. R. FPGA Implementation of Higher Order FIR Filter. International Journal of Electrical and Computer Engineering. 2017;7:1874-1881.
CrossRef - Pan J and Tompkins W. J. A real-time QRS detection algorithm. IEEE Trans. Biomed. Eng. 1985;32:230-236.
CrossRef - Gupta R.,Singh S., Garg K and Jain S. Indigenous Design of Electronic Circuit for Electrocardiograph. International Journal of Innovative Research in Science, Engineering and Technology. 2014;3.

