
Manuscript accepted on :19-Nov-2018
Published online on: 04-12-2018
Plagiarism Check: Yes
Reviewed by: Vijay Kumar
Second Review by: Lex Toet
Final Approval by: Dr. H Fai Poon
Nancy Mehta and Sumit Budhiraja
ECE, UIET, Panjab University Chandigarh, 160014, India.
Corresponding Author E-mail: nancymehta186@gmail.com
DOI : https://dx.doi.org/10.13005/bpj/1566
Abstract
Multimodal medical image fusion aims at minimizing the redundancy and collecting the relevant information using the input images acquired from different medical sensors. The main goal is to produce a single fused image having more information and has higher efficiency for medical applications. In this paper modified fusion method has been proposed in which NSCT decomposition is used to decompose the wavelet coefficients obtained after wavelet decomposition. NSCT being multidirectional,shift invariant transform provide better results.Guided filter has been used for the fusion of high frequency coefficients on account of its edge preserving property. Phase congruency is used for the fusion of low frequency coefficients due to its insensitivity to illumination contrast hence making it suitable for medical images. The simulated results show that the proposed technique shows better performance in terms of entropy, structural similarity index, Piella metric. The fusion response of the proposed technique is also compared with other fusion approaches; proving the effectiveness of the obtained fusion results.
Keywords
Guided Filter; Image Fusion; NSCT; Phase Congruency; Wavelet Decomposition
Download this article as:| Copy the following to cite this article: Mehta N, Budhiraja S. Multimodal Medical Image Fusion Using Guided Filter in NSCT Domain. Biomed Pharmacol J 2018;11(4). |
| Copy the following to cite this URL: Mehta N, Budhiraja S. Multimodal Medical Image Fusion Using Guided Filter in NSCT Domain. Biomed Pharmacol J 2018;11(4). Available from: http://biomedpharmajournal.org/?p=24550 |
Introduction
With advancement in technology, lot of improvement has been seen in the clinical applications and their has been tremendous increase in the number of modality images. Each imaging modality used for medical purposes provides unique information which is not present in any other modality. For proper diagnosis of a disease, doctors require information from more than one modality. CT images provide information regarding the dense structures of bone for proper radiation dose estimation but it does not provide much insight about the soft tissues. MRI images highlight the soft tissue contrast but lack the information about the bones. Hence, due to the incapability of a single image to provide all the information, radiologists require fusion of more than two modalities. Using image fusion, it is possible to combine information from more than one modalities in a better way by using several techniques.1 CT and MRI image fusion permits concurrent visualization of the soft tissue information given by the MRI image and bony anatomy given by the CT image which helps the doctors in diagnosing the disease and providing better treatment.
Image fusion aims at combining the required information from both the images producing a single image and while fusing, care should be taken of not introducing any artifacts in the image. Image fusion can be classified into three categories based on merging stage-pixel level,decision level and feature level. Among these pixel level fusion is mostly used in multimodal image fusion on account of its easy implementation and its capability to retain the original information.2 In this paper, the focus is on pixel level fusion. Image fusion can be applied in spatial and transfom domain. The basic spatial domain methods include averaging, IHS, Brovey method, max-min. But these techniques are not very efficient to fuse the relevant information of the source images and leads to certain artifacts.3 The human visual system is able to better preserve the features that exist in different scales.Hence Multiscale Transform domain methods help to solve these shortcomings of spatial domain methods.
In multiscale decomposition methods, the first step requires the decomposition of the image into low and high-frequency subbands at different resolution and then combining the coefficients of different subbands by different fusion rules. Toet et al.4 introduced various pyramidal techniques for multisensor image fusion. Different pyramidal techniques like gradient pyramid, morphological pyramid, Laplacian pyramid have been used a lot in previous years but they lead to loss of spatial information.5 The wavelet transform is another transform method for image fusion. The work of Yang et al.,6 shows wavelet along with maximum energy based selection rule was implemented but it was not able to capture the border line in the fused image. Wavelet decomposition does not give good results while capturing edges and contour in the image.7 Moreover, it gathers limited directional information in vertical, diagonal and horizontal directions.8 Dual tree complex wavelet transform9 that is enhancement of DWT was proposed by N.G. Kingsbury but it caused artifacts around the edges.
In order to overcome this shortcoming, number of other multiscale methods has been proposed like shearlet, curvelet, ripplet, contourlet.10-13 But the main problem in all these multiscale methods was they lack shift variance which leads to difficulty in capturing the contours and edges in the image. NSCT introduced by Cunha et al. is multidirectional, shift invariant and multiscale decomposition transform.14-15 It provides good results in geometric transformations by discarding the sub-sampling operation during decomposition and reconstruction of images and thus can effectively reduce pseudo-Gibbs phenomenon. In the proposed method, wavelet transform along with NSCT is used for image fusion.
Since fusion rule plays a very important part in deciding the quality of an image, hence different fusion rules have been used for the low and high-frequency coefficients. Phase congruency is the fusion rule selected for the low frequency coefficients and guided filter is used for the high frequency coefficients.
The rest of paper is organized as follows: an overview of NSCT along with phase congruency and guided filter is explained in Section II and in Section III it is explained the proposed multimodal image fusion framework. Section IV contains the results and discussions and conclusion is given in part V.
Preliminaries
Non Subsampled Contourlet Transform
NSCT uses the theory of contourlet transform and consists of two stages including non-subsampled directional filter bank (NSDFB) and non-subsampled pyramid (NSP). The former performs directional decomposition and the latter performs multidirectional decomposition. Firstly, the image has been decomposed into several scales by NSP which results at each decomposition level a low frequency and a high-frequency image. The number of decompositions at each level can differ making NSCT flexible and valuable for image fusion. The low-frequency component at each NSP level is iteratively decomposed to capture all the singularities. Thus NSP outputs k+1 sub-images consisting of one low frequency and k high-frequency images and the other images produced are having the size similar to the source image where k represents the number of decomposition levels. Fig.1 shows the NSP decomposition with k=3 levels. NSDFB ensures directional decomposition of the high-frequency images obtained from NSP at each level and as a result, produces 2l directional images at each scale. A four channel NSDFB built from two-channel filter banks is shown in Fig. 2d.
Non-Subsampled Pyramid
The non sub-sampled pyramid consists of two-channel filter bank without any down samplers which help in removing the frequency aliasing.The frequency response of the filter is shown in Fig. 2b, where Hk(z) (k=(0,1)) are the analysis filters and Gk(z), are the synthesis filters and are the building block of the Non subsampled pyramid. Each stage of NSP produces a low-pass filtered image and a band pass filtered image. In next level all the filters are upsampled by 2 in both dimensions. NSP has a redundancy of k+1 where k is the number of decomposition levels. Figure 1 represents NSP with k=3 levels.
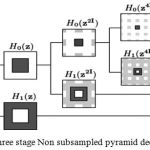 |
Figure 1: Three stage decomposition using Non sub sampled pyramid.
|
![Figure 2: Non-subsampled contourlet transform a) NSFB structure that uses NSCT b) Two channel NSP filter bank c) Two channel NSDFB d) Four channel NSDFB e) Frequency partitioning with NSCT [14].](https://biomedpharmajournal.org/wp-content/uploads/2018/12/Vol11No4_Mul_Nan_fig2-150x150.jpg) |
Figure 2: Non-subsampled contourlet transform a) NSFB structure that uses NSCT b) Two channel NSP filter bank c) Two channel NSDFB d) Four channel NSDFB e) Frequency partitioning with NSCT [14].
|
Non-Subsampled Directional Filter Bank
Bamberger and Smith constructed directional filter bank16 by combining the resampling operations and critically sampled two-channel filter banks and as a result, a tree-structured filter bank that decomposes the 2d frequency plane into directional wedges is obtained. The L level NSDFB results in 2l directional subbands which results in directional decomposition of the images. Fig. 2c is showing frequency response of filter bank of NSDFB. It is constructed by iterating this filter bank in order to obtain the directional decomposition. The filters at the next level as shown in Fig. 2d are obtained by upsampling all the filters by a Quincunx matrix that is given by:
Frequency divisions obtained with NSCT is shown in Fig. 2e. The number of frequency division depends upon the number of directional images we want at each level.
Phase Congruency
Phase congruency is a contrast invariant feature extraction method that is derived from local energy model which follows the principle that main features can be found in an image where we are having the Fourier components are maximally in phase with one another. Moreover, it is insensitive to different pixel intensity mapping. It is not very sensitive to changes in light and contrast which assure its suitablity for use in multimodal image fusion.17 It provides improved frequency localization which is a good feature for medical image fusion. Hence it is employed as a fusion rule for the low frequency coefficients in the proposed method.
Guided Filter
Guided filter is an edge-preserving linear translation-invariant filter which produces an image in the output by considering the contents of the input image. It outputs a result that is distortion free by removing the gradient reversal artifacts. It is a neighborhood operation and consists of an input image t, an output image Q and a guidance image I. The guided filter18 has an assumption that the Q is a linear transformation of the guidance image I in a window wk centered at pixel k and the output image at pixel i can be expressed as.
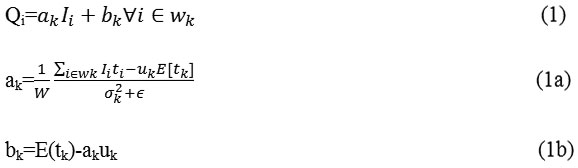
where ak and bk are the coefficients that are constant in wk. The coefficients ak and bk can be found using equations 1a and 1b. E (tk) represents the mean of input image in window wk. The variance and mean of the image in a window wk is represented by uk and σk2. Guided filter has been used a lot for image fusion and provides good results for multimodal medical image fusion.19 In the proposed technique we have used the guided filter with modified weight maps for the fusion of high frequency NSCT coefficients which preserves the edges and helps in information preservation.
Proposed Fusion Framework
Fusion is performed on registered source images A and B using wavelet transform and NSCT shown in Fig. 3 and Fig. 4. Firstly wavelet decomposition is used to decompose the registered source images then NSCT decomposition is performed on the wavelet reconstructed coefficients. Phase congruency has been used for the fusion of low frequency coefficients and for the high frequency coefficients we have used guided filter. The complete method is shown in several steps. Step 1is divided into two stages in which the first stage discusses wavelet decomposition and the second stage discusses about NSCT decomposition. Step 2 explains about the fusion rule used for low frequency coefficients and in step 3 the fusion rule for high frequency coefficients is used.
Step 1. Stage 1-Firstly the registered source images are passed through wavelet transform and the approximate and detail coefficients obtained after wavelet decomposition are fused through averaging and maximum selection rule respectively as shown in Fig.3 to obtain two fused images. Haar wavelet on account of its fast implementation has been used for wavelet decomposition and reconstruction.
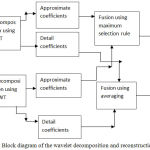 |
Figure 3: Block diagram of the wavelet decomposition and reconstruction (Stage 1).
|
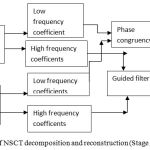 |
Figure 4: Block diagram of NSCT decomposition and reconstruction (Stage 2).
|
Stage 2. After NSCT is performed on the wavelet reconstructed images A and B which are decomposed into one low frequency and a series of high-frequency images at each level and direction θ, i.e A:{ClA Cl,θA}, B:{CLB CL,θB }. Here CL represents the low-frequency images and CL θ are the high frequency images at level L and orientation θ.15 The number of decomposition levels in the method is2,10 which represents 4 directional images in the first level, 2 directional images in the second level and 1 directional image in the third level. A table comparing the different decomposition levels with different directional sub images has been shown in the Table 1.
Step 2. Fusion of low-frequency coefficents: The low frequency sub-image coefficients represent the average information of the image and determine the outline of images. In order to construct the approximate information mostly averaging method is used but it results in reduced contrast in the image and thus reducing the quality of the image. In this method phase congruency is used as a fusion rule in which the features are first extracted using from PClA and PClB and then fusion is done according to
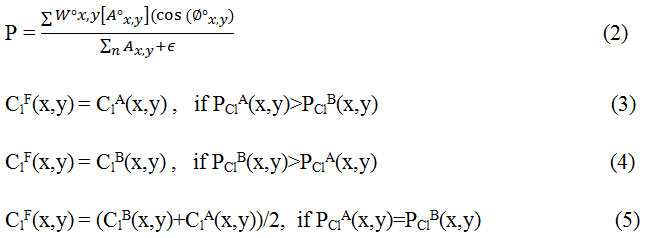
Step3. Fusion of high frequency coefficients: The detail component of source images is contained in the high frequency images. Basically they contain information related to detail and features of an image like texture. Noise also has a relation with high frequencies and may lead to introduction of certain artifacts hence we need to choose a fusion rule which is better for dealing with noisy images.21 In this paper guided filter has been used to fuse the high frequency components.
![]()
In this approach, guidance image is the high-frequency coefficient of image A CL,θA and input image is the high frequency coefficient of image B CLθB to produce an output image at each level. Then all the high frequency images are fused together by simple averaging to produce ClF θ.
Step 4. Inverse NSCT is performed on the ClF and Cl, θF to get the fused image F.
Results and Discussions
To ful fill the requirements of fusion algorithm of being robust, simple and effective the results has been evaluated subjectively as well as objectively. The subjective evaluation is based on human visual characteristics and knowledge of the observer and the objective evaluation is done according to certain statistical parameters.
Performance Parameters for Evaluation of Image Fusion
Normalized Mutual Information22 QMI: It is a quantitative measurement of the dependence of the fused image on the input source images. It is desirable to have large values of MI.
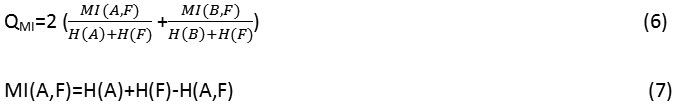
where H(A), H(B),H(F) are the marginal entropies of image A, image B, and image F respectively. MI(A, F) represent the mutual information between image A and image F.H(A, F) represents the joint entropy between image A and F.
Structural Similarity Index (SSIM)QY: It signifies the capability of the fused technique to capture the structural information in an image.
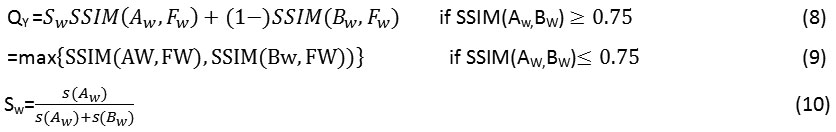
Here s(Aw) and s(Bw) are the variances of the source input images A and B of size [77] and w is a sliding window which moves through all the pixels and Sw is the local weight that is obtained from local image variance. The detailed implementation of the above technique is given in.23
Entropy: It predicts the amount of information content in an image.
![]()
Here p(u) gives the marginal probability distribution.
Piella and Heijman’s metric(QP)24: It provides the structural and edge information in an image.
![]()
Here Q0 (A, F|w) and Q0 (B, F|w) are the local quality indexes calculated in a sliding window w and Swis defined as:
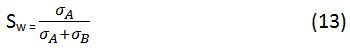
Here σA and σB represents the variance of source images A and B.
Cvejic’s metric(QC)[25]: It indicates how by minimizing the distortion information is preserved in the output image. It is calculated as:
![]()
Where u(Aw, Bw, Fw) is calculated as:
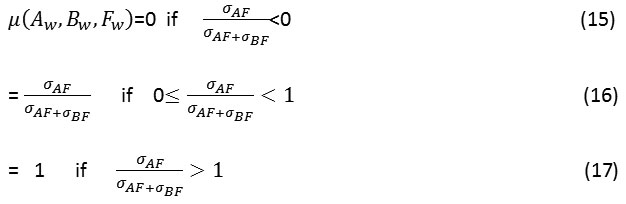
Here σAF represents the covariance between image A and F and σBF represents the covariance between images B and F.UIQI is the universal image quality index.26
Simulation Results on CT and MRI Images
The registered images of size 256*256 are taken from med.harvard.edu/aanlib/home.html. To evaluate the performance of the proposed technique an image database consisting of CT and MRI images shown in Fig. 5 is used. The corresponding pixels of the source images have been registered. The images are of size 256*256 with 256-level gray scale. The results of the proposed fusion framework are compared with traditional PCA, Wavelet with 1 level decomposition, Wavelet with 3 level decomposition, NSCT2 in which averaging for low-frequency coefficients and maximum selection rule for high-frequency coefficients has been used, NSCT1 in which phase congruency for low and guided filter for high frequency components is used but without wavelet decomposition. The level of decomposition for NSCT is 3. The reason for using 3 level of decomposition is shown in table 1. For wavelet-based method averaging is used for the approximate coefficients and maximum fusion rule is used for high-frequency coefficients. For implementing NSCT maximally flat filters is used for pyramid decomposition and diamond maxflat filters are used for directional decomposition. The guided filter implemented in the technique has modified by using different levels for the weight maps.
Window radius and epsilon value for the guided filter is set to r= 0.01 and.18 Comparison of the objective parameters for different values of epsilon and radius has been shown in Fig 9. The wavelet decomposition method used in the implemented technique has levels=3.Haar wavelet has been used for wavelet decomposition.
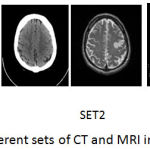 |
Figure 5: Different sets of CT and MRI images.
|
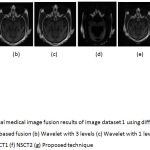 |
Figure 6: Multimodal medical image fusion results of image dataset 1 using different techniques (a) PCA based fusion (b) Wavelet with 3 levels (c) Wavelet with 1 level (d) Guided filter (e) NSCT1 (f) NSCT2 (g) Proposed technique.
|
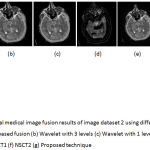 |
Figure 7: Multimodal medical image fusion results of image dataset 2 using different techniques (a) PCA based fusion (b) Wavelet with 3 levels (c) Wavelet with 1 level (d) Guided filter (e) NSCT1 (f) NSCT2 (g) Proposed technique
|
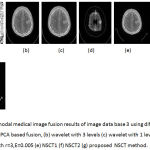 |
Figure 8: Multimodal medical image fusion results of image data base 3 using different techniques : (a) PCA based fusion, (b) wavelet with 3 levels (c) wavelet with 1 level (d) Guided filter with r=3,E=0.005 (e) NSCT1 (f) NSCT2 (g) proposed NSCT method.
|
From the figure 6 it is clear that the proposed technique is able to preserve the details as well as lead to better quality image. Figure 7 represents the fused image of CT and MRI showing multiple embolic infarctions and the proposed technique is able to retain most of the information. Figure 8 represents the fused CT and MRI image showing acute substroke of speech arrest.
Table 1: Simulation results for proposed technique using different decomposition levels.
| Decomposition level | Entropy for dataset 1 |
Piella metric for dataset 1 |
Time in seconds |
| [21] | 6.2860 | 0.9872 | 59 |
| [210] | 6.4686 | 0.9893 | 64 |
| [211] | 6.40 | 0.9889 | 70 |
| [321] | 6.4297 | 0.9878 | 178 |
| [2211] | 5.7848 | 0.9862 | 117 |
| [42] | 5.621 | 0.9859 | 474 |
| [422 ] | 5.609 | 0.9850 | 507 |
Table 1 shows the values of entropy and Piella metric for different decomposition levels. From the table it is clear that less number of levels takes less computation time. Increasing the number of directional decompositions at each scale also lead to higher computation time and the image quality is also affected by increasing the number of levels. Level21 takes the least time but the value of QP metric is less. he decomposition level2,10 provides better results for entropy, computation time and Piella metric. Hence in the proposed methodology the decomposition level is.2,10
Table 2: Simulation results for proposed technique using different data sets.
| Image dataset | Entropy | QP | SSIM | MI |
| 1 | 6.4686 | 0.9893 | 0.9967 | 0.6192 |
| 2 | 5.5322 | 0.9865 | 0.997 | 0.567 |
| 3 | 5.1273 | 0.9854 | 0.9972 | 0.589 |
Table 2 represents the values of different metrics for datasets 1, 2 and 3 using the proposed technique. Entropy represents the information content and its value should be high .QP value should be close to 1 which represents the edge information and SSIM should also be close to 1 to represent the structural similarity.
Table 3: Performance of the proposed technique by varying the window radius.
| Window radius | entropy | QP | SSIM | MI |
| 0.01 | 6.4274 | 0.9892 | 0.9967 | 0.6192 |
| 0.1 | 5.965 | 0.9776 | 0.9865 | 0.546 |
| 1 | 5.2514 | 0.9629 | 0.9667 | 0.432 |
| 10 | 2.8315 | 0.6181 | 0.651 | 0.345 |
From the Table 3 it is clear that increasing the value of window radius leads to reduced value of entropy, SSIM, Qp as it leads to loss of edge information. Hence the value for window radius is set to 0.01.
Table 4: Evaluation Indices for Medical Images of dataset 1 using different techniques.
| Technique | Entropy | QP | SSIM | QMI |
| Wavelet level 1 | 6.05 | 0.5605 | 0.665 | 0.5294 |
| Wavelet level 3 | 6.039 | 0.6607 | 0.685 | 0.6384 |
| NSCT2 | 6.105 | 0.9970 | 0.9958 | 0.580 |
| Guided filter | 4.368 | 0.4276 | 0.8070 | 0.670 |
| PCA | 3.67 | 0.3031 | 0.458 | 0.781 |
| NSCT1 | 5.73 | 0.745 | 0.876 | 0.591 |
| Proposed method | 6.4686 | 0.9893 | 0.9967 | 0.6192 |
The comparison of statistical parameters for the fused image by using different techniques for the image dataset 1 has been shown in Table 2. It is clear that the implemented technique performs better by preserving the spectral and spatial information. PCA based results are not so good as compared to other techniques as it does not provide information at different scales. Guided filter technique is better in preserving the edges but it leads to reduced spatial information. Wavelet techniques are not able to preserve information at the edges hence the value of statistical parameters decreases for them. NSCT 1 method in which wavelet decomposition is not done prior to NSCT has low value of entropy and QP hence proving the need of using wavelet before NSCT. NSCT2 also has low value of the objective parameters.
Proposed NSCT performs better in terms of entropy, SSIM,QP and thus showing the effectiveness of the method on account of its capability to capture the point regularities in an image. Though the value of mutual information is not as good.
Conclusion
In this paper, modified fusion framework for multimodal medical images based on nonsubsampled contourlet transform and guided filter has been proposed. Wavelet decomposition is done prior to NSCT for visually better results. For low-frequency bands of NSCT phase congruency and for high-frequency bands guided filter is used. Further, in order to prove the practical applicability of the proposed method, two sets of images of human brain affected with cerebrovascular diseases of acute stroke with speech arrest and multiple embolic infarctions is taken. The visual analysis reveals that the proposed method is able to preserve the soft tissue details of MRI and bony structure of CT image. Though mutual information is not so good but it can be improved by further modifications. Further, the proposed method can be applied to fuse the functional medical images and anatomical medical images that are represented by color and grayscale images respectively. The guided filter used for high frequency coefficients fusion can be made adaptive for further improvement in results.
References
- Amdur R. J., Gladstone D., Leopold K. A., Harris R. D. Prostate seed implant quality assessment using MR and CT image fusion. Int J Radiat Oncol Biol Phys. 1999;43:67–72. doi: 10.1016/S0360-3016(98)00372-1.
CrossRef - Redondo R.,Sroubek F., Fischer S and Cristobal G. Multi focus image fusion using the log-Gabor transform and a multi size windows technique. Inf. Fusion. 2009;10(2):163–171.
CrossRef - James A. P and Dasarathy B. V. Medical image fusion: A survey of the state of the art. Inf Fusion. 2014;19:4-19.
CrossRef - Toet A., van Ruyven L. J., Valeton J. M. Merging thermal and visual images by a contrast pyramid. Opt Eng. 1989;28:789–792. doi: 10.1117/12.7977034.
CrossRef - Petrovic V. S and Xydeas C. S. Gradient-based multiresolution image fusion.IEEE Trans. Image Processing. 2004;13(2):228-237.
CrossRef - Yang Y., ParkD. S., Huang S and Rao N. Medical image fusion via an effective wavelet-based approach. EURASIP Journal Advanced Signal Processing. 2010;20(10)1–13.
- Liu Z., Yin H., Chai Y and Yang S. X. A novel approach for multi modal medical image fusion. Expert Systems with Applications. 2014;41:7425–7435.
CrossRef - Ali F. E., El-Dokany I. M., Saad A. A and Abd El-Samie F. E. Curvelet fusion of MR and CT images. Progr. Electromagn. Res. C. 2008;3:215–224.
CrossRef - Selesnick I. W., Baraniuk R. G., Kingsbury N. G. The dual-tree complex wavelet transform. IEEE Signal Process Mag. 2005;22:123–151. doi: 10.1109/MSP. 2005.1550194.
- Serikawa S., Lu H., Li Y and Zhang L. Multi modal medical image fusion in modified Sharp frequency localized contourlet domain. in Proc. IEEE Computer Society 13th ASIC Int. Conf. Software Engg. Artificial Intelligence, Networking and Parallel/ Distributed Computing . 2012;33-37.
- Choi M. J., Kim R. Y and Kim M. G. The curvelet transform for image fusion. ISPRS. 2004;35:59-64.
- Zhou X., Wang W and Liu R. Compressive sensing image fusion algorithm based on directionlets. EURASIP J. Wireless Communication and Networking. 2014.
CrossRef - Wang L., Li B and Tian L. EGGDD: AN explicit dependency model for multi_modal-medical image fusion in the shift-invariant shearlet transform domain. Information Fusion. 2014;19:29-37.
CrossRef - Bhatnagar G., Wu Q. M. J and Liu Z. Directive contrast based multimodal medical image fusion in NSCT domain. IEEE Trans. Multimedia. 2013;15(5):1014-1024.
CrossRef - da Cunha A. L.,Zhou J and Do M. N. The nonsubsampled contourlet transform: Theory design and applications. IEEE Trans. Image Process. 2006;15(10):3089–3101.
CrossRef - Bamberger R. H and Smith M. J. T. A filter bank for the directional decomposition of images: Theory and design. IEEE Trans. Signal Process. 1992;40(4):882–893.
CrossRef - Kovesi P. Image features from phase congruency. Video. A Journal of Computer Vision Research. 1999;1(3):2-26.
- Li S., Kang X and Hu J. Image fusion with guided filtering. IEEE Transactions on Image Processing. 2013;22:7.
- Jameel A., Ghafoor A. and Riaz M. M. Improved guided image fusion for magnetic resonance and computed tomography imaging. Hindawi The Scientific World Journal. 2014.
- Wang N., Ma Y., Zhan K and Yuan M. Multi modal medical image fusion framework based on simplified PCNN in nonsubsampled contourlet transform domain. Multimedia. 2013;8(3):270–276.
- He C., Qin Y., Cao G and Lang F. Medical image fusion using guided filtering and pixel screening based weight averaging scheme. Academics J. Inc.Journal of Software Engineering. 2013;7(2):77- 85.
CrossRef - Hossny M., Nahavandi S and Creighton D. Comments on information measure for the performance of image fusion. Electronics Letters. 2000;36(4):308-309.
CrossRef - Yang C., Zhang J., Wang X and Liu X. A novel similarity based quality metric for image fusion. Inf. Fusion. 2008;9:156–160.
CrossRef - Piella G and Heijmans H. A new quality metric for image fusion. in Proceedings of the International Conference on Image Processing(ICIP’ 03). 2003;173-176.
- Cvejic N., Loza A., Bull D and canagarajah N. A similarity metric for assessment of image fusion algorithms. Inf.Fusion. 2008;9(2):156-160.
CrossRef - Wang Z and Bovik A. A universal image quality index. IEEE Signal Process. Letters.2002;9(3):81–84.
CrossRef

