
S. Thiruvengadam , K. S. Shreenidhi and B. S. Mohan Kumar
Department of Biotechnology, Rajalakshmi Engineering College, Chennai, TN, India.
Corresponding Author E-mail: thiruvengadam.s@rajalakshmi.edu.in
DOI : https://dx.doi.org/10.13005/bpj/1595
Abstract
Cardiospermum halicacabum commonly known as Balloon plant or Love in a puff, a climbing plant often found in tropical and subtropical Africa and Asia. It is widely used in homeopathic medicine for the treatment of arthritis, purulent discharge and others. This particular plant species is becoming endangered due to their extensive use for commercial purposes and genetic diversity at inter-species level arises due to geographical distribution, climate changes and environmental stress. As an initiative for conservation of this species, the present contemplation was done by collecting DNA samples from leaves of the above mentioned plant which were grown in five different locations in and around Chennai and the investigation of their diversity was done using genetically reliable DNA markers like OPA 5, OPA 9, OPA 10, OPB 18, OPC 7, OPN 7 and OPN 12. RAPD PCR was performed. It provided providing information at molecular level and the total number of bands formed, designate the presence of genetic variations among species in different location. Dendrogram was constructed using scoring methods found the differences among the same species arising from evolution, it could be environmental change and technological developmental impacts.
Keywords
Arthritis; C.halicacabum; Dendrogram; Genetic Diversity; PCR
Download this article as:| Copy the following to cite this article: Thiruvengadam S, Shreenidhi K. S, Kumar B. S. M. Genetic Diversity and Dendrogram of Cardiospermum Halicacabum- An In Vitro Study. Biomed Pharmacol J 2018;11(4). |
| Copy the following to cite this URL: Thiruvengadam S, Shreenidhi K. S, Kumar B. S. M. Genetic Diversity and Dendrogram of Cardiospermum Halicacabum- An In Vitro Study. Biomed Pharmacol J 2018;11(4). Available from: http://biomedpharmajournal.org/?p=24435 |
Introduction
Plants have been used since ancient times for the treatment of various ailments. Out of about 15,000 species of higher plants in India, medicinal uses have been attributed to 1500 species (Handa, 1998). Due to the technological advancements, the natural genetic setup of the plants experiences a drastic change. Therefore, we decided to work on genetic diversity in Cardiospermum halicacabum. Different parts of this plant are used in traditional medicine for the treatment of rheumatism, lumbago, cough, hyperthermia, nervous diseases, stiffness of limbs and snake bite (Chopra,1980). According to research work done by Krishnamoorthy Ganesan et al., 2011, C. halicacabum cures inflammation and collagen degradation. The alcoholic extract of C. halicacabum when administered orally produced significant anti-inflammatory effect in rats as tested by the granuloma pouch and cotton pellet implantation methods (Gopalakrishnan et al., 1976). The ethanol and hexane extracts of C. halicacabum found to act against pyrexia in rats (Asha et al., 1999). This plant is also used against throat infection and headache (Chellaiah Muthu et al., 2006). The ethanol extract of C. halicacabum proved to have anti-ulcer activity against ethanol induced gastric ulcer in rats (Sheeba et al., 2006) and anti-hyperglycaemic effect against streptozotocin (STZ) induced diabetic male albino Wistar rats (Veeramani et al., 2008). The ethanol extract of the C. halicacabum suppresses the production of TNF-alpha and nitric oxide in human peripheral blood mononuclear cells (Venkatesh Babu et al., 2006) This particular plant species is becoming endangered due to their extensive use for commercial purposes. This study would help in their conservation and use. Genetic diversity at inter-species level arises due to geographical distribution, climate changes and environmental stress. Genetic diversity is the reason for inter-species differences. This diversity is also observed within species, and in plants this variation can be a result of difference in climatic conditions, geographical distribution and environmental stress (Enelge Gildenhuys, 2013). The genetic diversity may not result in morphological changes to a great extent but this genetic diversity may lead to the change or disappearance in the medicinal properties present in the plant. Genetic diversity may also result in the extinction of the plant or the adaptation of the plant to existing environment which may result in the plant to produce some toxic components instead of the medicinal components so the study of the genetic diversity of the plant is very important to preserve the plants and its medicinal values and prevent them from being endangered. Genetic diversity help detect the phylogeny of a particular plant species, and experiments such as RAPD (Random Amplified Polymorphic DNA) show the extent of genetic polymorphism observed within a particular species, despite morphological similarities (Annamalai et al., 2012).
Materials and Methods
Plant Material
Young Tender leaves of Cardiospermum halicacabum were collected from Ponmar, K. K. Nagar, Ottiyambaakaam, Vengaivaasal and Pallikaranai locality and authenticated by Botanist and permitted for DNA isolation after washing with water and saline.
DNA Isolation
The procedure for DNA isolation using CTAB is a modification of Saghai-Maroof et al., (1984) method. We further slightly modified this method by adding 0.2% PVP to the CTAB extraction buffer to prevent co-isolation of phenolics and polysaccharides. 0.5g of plant material was weighed and frozen in liquid nitrogen. The frozen tissue was ground in a clean motor and pestle. To this extract 1.5ml (w/v) of preheated 4X CTAB buffer was added and incubated at 65°C for about 60 minutes. The buffer was mixed well by inversion for every ten minutes and equal volume of ice-cold Chloroform: isoamylalcohol (24:1) was added. After mixing thoroughly, the tubes were centrifuged at 10,000rpm for 15minutes. Using a wide bore tip the top aqueous phase was transferred to a new sterile microfuge tube. The volume was measured and one-tenth the volume of 3M Sodium acetate and 0.6 volume of cold isopropanol was added and mixed gently to precipitate the nucleic acids. The tubes were stored at -20 for about one hour or left overnight (optional). The nucleic acid pellet was recovered by centrifuging at 10,000rpm for 15 minutes. The pellet was washed with 70% ethanol twice and was air-dried briefly at room temperature. The pellet was dissolved in T.E buffer and stored under -20°C.
GEL Electrophoresis
DNA quality was assessed on a 0.8% Agarose Gel (Tanksle et al., 1989) (in Tris Acetate EDTA buffer) electrophoresis at 30 Volts. DNA was stained with Ethidium Bromide visualized on a UV transilluminator. Gel electrophoresis of the nucleic acids suspended in T.E. showed the presence of RNA, as well as, high molecular weight DNA. So they were subjected to RNase treatment.
DNA Estimation
A double beam Spectrophotometeric (2203) quantification of DNA was done by the procedures described by Zachleder (1984) Danovaro et al.(1993) and Danovaro (1996) with modification. 3µl of the DNA sample was diluted to 3ml with T.E buffer pH 8.0 (Dilution factor is 1000 times). Concentration was calculated using the formula
Concentration of DNA=O.D at 260nm*50*Dilution factor
The purity of the DNA samples was checked by the ratio of absorbance 260nm to 280nm. (The ratio approximately 1.8 indicates that the samples are free from protein and RNA contamination). This concentration of the DNA samples and their ratio are listed.
RNAse Treatment
DNA extracts were treated with RNase in order to remove Ribonucleic Acids (Fara et al.,1996). RNaseA in the concentration of 10µg/ml was added to the diluted DNA sample to final concentration of 10µg/ml and incubated at 37°C for 1 hour. Equal volume of Phenol: Chloroform: Isoamylalcohol (25:24:1) was added and mixed well by inversion (equilibrated Phenol was used). The aqueous phase was recovered by centrifugation at 10,000rpm, 4°C for 2-5 minutes. Aqueous layer was transferred to a new microfuge along with one-tenth volume of 3M Sodium acetate and 2.5 volumes of ice-cold 99% ethanol. The tubes were then incubated at -20°C for about 1 hour and centrifuged at 12,000rpm for 10minutes. The supernatant was discarded and the pellet was washed with 70%ethanol. Ethanol was then aspirated by air-drying the samples. The pellet was then redissolved in 50 microlitre of 1X T.E buffer and stored under -20°C.
Pcr-Polymerase Chain Reaction and Visualisation of Products
PCR involves multiple cycles of denaturation, renaturation and polynucleotide synthesis that amplifies a particular DNA sequence. DNA samples were diluted to 50ng/µl concentration.
PCR Standardization
| PCR Parameter | Tested range | Optimum conditions | Remarks |
| DNA concentration (ng) | 25ng & 50ng | 50ng | Absence of amplification with lower concentration and presence of smear at higher concentration Affected the repeatability. |
| Magnesium chloride (mM) | 2, 2.5 & 3 | 2.5mM | Excess/lower concentration
increases the non specificity and yield of the product. |
| Primer concentration (μM) | 0.3, 0.4 & 0.5 | 0.4μM | Lower and higher concentrations
lead to absence of amplification and Primer dimer formation, respectively. |
| Taq polymerase (units) | 2.5, 2& 1 | 2.5U | Lower concentration did not show Proper amplification. High concentration showed decreased Specificity. |
PCR conditions were standardized by varying the concentration of its components. The variations and the remarks were tabulated (Table No.1 and Table No.2).
PCR was carried out in an Eppendorf Mastercycler Personnel Thermocycler (Germany).
Table 1&2: PCR Standardization.
| Milli Q water | 10.83µl |
| 10X Buffer | 2.0µl (1X) |
| 50mM Magnesium chloride | 1.0µl(2.5mM) |
| 2mM DNTP’s | 2.0µl 0.2mM) |
| DNA (50ng/µl) | 1.0µl (50ng) |
| Taq polymerase (5U/µl) | 0.5 (2.5U) |
| 3µM Primer | 2.67(0.4µM) |
RAPD – PCR
Primer Screening
Ten Random primers were used to screen the genomic DNA samples. Ponmar sample was used for screening.
Table 3: Primer screening for Cardiospermum halicacabum.
| S.No | Primer | No. of Bands |
| 1. | OPC7 | 5 |
| 2. | OPC10 | 4 |
| 3. | OPB 18 | NIL |
| 4. | OPB 19 | NIL |
| 5. | OPB 20 | NIL |
| 6. | OPA 18 | NIL |
| 7. | OPA 19 | NIL |
| 8. | OPA 20 | NIL |
| 9. | OPA 11 | NIL |
| 10. | OPA 5 | 3 |
Analysis on Agarose GEL
PCR product 25µl as loaded into 1.5% agarose gel along with a 1kb DNA ladder (Biotools, as a reference). Samples were run at 75volts for 30-60 minutes hours till bromophenol blue present in the gel loading dye reaches 3/4th of the length of the gel. Gel was visualized on a UV transilluminator/gel documentation unit and the bands were scored.
Construction of Dendrogram
The presence and absence of bands between samples was scored and data was transcribed into binary format. That is, a score of 1 was given for the presence of the particular band and 0 given for its absence. From this data, a statistical analysis was done using commercial software SPSSv16. Difference matrix was calculated using UPGMA based analysis. The obtained values were used to construct the dendrogram.
Result and Discussion
From the RAPD PCR primer screening, 3 primers were selected to develop a fingerprint of Cardiospermum samples.
Table 4: Primer under study.
| S.No | Primer | Sequence 5’-3’ | GC% |
| 1. | OPC7 | GTCCCGACGA | 70 |
| 2. | OPC10 | TGTCTGGGTG | 60 |
| 3. | OPA5 | AGGGGTCTTG | 60 |
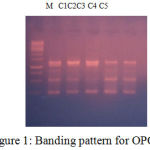 |
Figure 1: Banding pattern for OPC7.
|
Table 5: Scoring for Primer OPC7.
| LOCI | C1 | C2 | C3 | C4 | C5 |
| 250 | 1 | 1 | 1 | 1 | 1 |
| 500 | 1 | 1 | 0 | 1 | 1 |
| 850 | 1 | 0 | 0 | 1 | 1 |
| 1300 | 1 | 1 | 1 | 1 | 1 |
| 1400 | 1 | 1 | 1 | 1 | 1 |
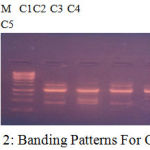 |
Figure 2: Banding Patterns For OPC 10.
|
Table 6: Scoring for Primer OPC 10.
| LOCI | C1 | C2 | C3 | C4 | C5 |
| 450 | 1 | 1 | 1 | 1 | 1 |
| 500 | 0 | 1 | 0 | 0 | 0 |
| 600 | 1 | 0 | 0 | 1 | 1 |
| 1000 | 1 | 1 | 1 | 1 | 1 |
| 1500 | 1 | 0 | 1 | 1 | 1 |
| 1700 | 0 | 1 | 1 | 0 | 1 |
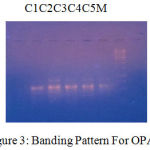 |
Figure 3: Banding Pattern For OPA 5.
|
Table 7: Scoring for Primer OPA5.
| LOCI | C1 | C2 | C3 | C4 | C5 |
| 250 | 0 | 1 | 1 | 1 | 0 |
| 350 | 1 | 1 | 1 | 1 | 1 |
| 500 | 0 | 1 | 1 | 1 | 1 |
C1 Ponmar ;C2 K.K.Nagar;C3Ottiyambaakaam;C4Vengaivaasal; C5 Pallikaranai
Dendrogram
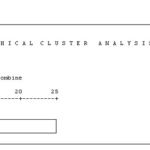 |
Graph 1
|
The banding pattern for OPC7 and OPC10 appeared smeared as shown in the figure 1 and figure 2 whereas the banding pattern for OPA 5, appeared convex shaped and smeared. These banding pattern was found similar to the work done by Annamalai et al., 2012. The researcher had chosen random primers and the banding pattern observed was smeared. However the dendrogram constructed showed genetic distances proving the fact that the environment/conditions in which the plant grows, show genetic level differences. In other another work carried out in shodhganga, the C.halicacabum collected from the western ghats and forest regions of India showed less genetic variation. The UPGMA dendrogram for five selected populations of C. halicacabum collected from five different regions of kerala showed two clusters. Accessions from Trivandrum, Kanyakumari and Kollam were grouped in one cluster whereas populations from Alappuzha and Palakkad in the other cluster (M.S. Sheeba et al., 2014).
Conclusion
Environmental pollution leads to change in the environment in which the plant survives so it adapts itself to the existing environment which is caused due the mutation of genes which causes decrease in the medicinal quality of plant so its a call of the hour to protect and preserve these medicinal plants from the environmental changes
References
- Asha V. V and Pushpangadan P. Antipyretic activity of Cardiospermum halicacabum. Indian J Exp Biol. 1999;37:411–4.
- Annamalai A., Christina V. L and Lakshmi P. T. V. Evaluation of Genetic Diversity in Cardiospermum halicacabum based on Geographical Variation Using RAPD Markers. Pharmacognosy Communications. 2012;2(1):62-65.
CrossRef - Muthu C., Ayyanar M., Raja N and Ignacimuthu S. Medicinal plants used by traditional healers in Kancheepuram District of Tamil Nadu. India J Ethnobiol. Ethnomed. 2006;2:43-53.
CrossRef - Chopra R. N., Nayar S. L and Chopra I. C. Glossary of Indian Medicinal plants. New Delhi. 1956.
- Danovaro R. Detritus-bacteria-meiofauna interactions in a seagrass bed (Posidonia oceanica) of the NW Mediterranean. Mar. Biol. 1996;127:1–13.
CrossRef - Danovaro R., Fabiano M and Croce N. D. Labile organic matter and microbial biomasses in deep-sea sediments (Eastern Mediterranean Sea). Deep-Sea Res. 1993;40:953–965.
CrossRef - Gildenhuys E., Ellis G. A., Carroll P. S and Roux J. J. L. The ecology, biogeography, history and future of two globally important weeds: Cardiospermum halicacabum Linn. and C. grandiflorum Sw. Neo. Biota. 2013;19:45–65.
CrossRef - Fara A., Berdalet and Arin L. Determination of RNA and DNA concentrations in natural plankton samples using Thiazole Orange in combination with DNase and RNase digestions. J. Phycol. 1996;32:1074–1083.
CrossRef - Gopalakrishnan C., Dhananjayan R and Kameswaran L. Studies on the pharmacological actions of Cardiospermum halicacabum. Indian J Physiol. Pharmacol. 1976;20:203–6.
- Handa S. S. Indian efforts on standardization and quality control of medicinal plants using scientific parameters. Amruth (The Traditional Healthcare Magazine). 1998;2:10.
- Ganesan K., Sehga K. P., Mandal B. A and Sayeed S. Protective Effect of Withania somnifera and Cardiospermum halicacabum Extracts Against Collagenolytic Degradation of Collagen. Applied Biochemistry and Biotechnology. 2011;165(3–4):1075–1091.
CrossRef - Sheeba M. S and Asha V. V. Effect of Cardiospermum halicacabum on ethanol-induced gastric ulcers in rats. J Ethnopharmacol. 2006;106:105–10.
CrossRef - Tanksley S. D., Young N. D., Paterson A. H and Bonierbale M. W. RFLP mapping in plant breeading: New tools for an old sciences. Biotechnology. 1989;7:257-264.
- Veeramani C., Pushpavalli G and Pugalendi K. V. Antihyperglycaemic effect of Cardiospermum halicacabum Linn. leaf extract on STZ induced diabetic rats. J Appl Biomed. 2008;6:19–26.
- VenkateshBabu K. C and Krishnakumari S. Car diospermum halicacabum suppresses the production of TNF-alpha and nitric oxide Anti-arthritic activity of the Indian leafy vegetable Cardiospermum halicacabum by human peripheral blood mononu clear cells. Afr. J.Biomed Research. 2006;9:95–99.
- Zachleder V. Optimization of nucleic acids assay in green and blue green algae: extraction procedures and the light-activated diphenylamine reaction for DNA. Arch. Hydrobiol. 1984;67:313–328.

