
Ida Ayu Raka Astiti Asih1 , Ida Bagus Putra Manuaba2, Ketut Berata3 and Bagus Komang Satriyasa4
1,2Departement of Chemistry, Faculty of Mathematic and Natural Sciences Udayana University, Indonesia.
3Faculty of Veterinary Medicine of Udayana University, Indonesia.
4Faculty of Medicine Udayana University, Indonesia.
Corresponding Author E-mail: astiti_asih@unud.ac.id
DOI : https://dx.doi.org/10.13005/bpj/1593
Abstract
The Kintamani community in Bali uses the Solanum betaceum as a vegetable or herbal medicine to treat sprue disease. This study aims to isolate flavonoid glycosides and prove the activity of flavonoid glycoside extract of n-butanol, as an antioxidant. The separation of n-butanol extracts was carried out by column chromatography and then identified by FTIR, UV-Vis and LC-MS/MS spectrometry. Three flavonoid glycosides were isolated and identified from 5 and 6 fractions of n butanol extract namely Quercetin 3-O rhamnoside, Routine and Kaempferol 3-O rutinoside. The three flavonoid glycoside compounds have strong antioxidant activity with DPPH Test. These results indicated the potential of terong belanda fruit as a source of natural antioxidants for health management.
Keywords
Antioxidant; Flavonoid glycosides; Solanum Betaceum Cav
Download this article as:| Copy the following to cite this article: Asih I. A. R. A, Manuaba I. B. P, Berata K, Satriyasa B. K. The Flavonoid Glycosides Antioxidant from Terong Belanda (Solanum Betaceum). Biomed Pharmacol J 2018;11(4). |
| Copy the following to cite this URL: Asih I. A. R. A, Manuaba I. B. P, Berata K, Satriyasa B. K. The Flavonoid Glycosides Antioxidant from Terong Belanda (Solanum Betaceum). Biomed Pharmacol J 2018;11(4). Available from: http://biomedpharmajournal.org/?p=24259 |
Introduction
There is currently great demand for natural antioxidants to minimize cell damage. An antioxidant is a substance that can stop or inhibit oxidative damage to a target molecule.1 Oxidative damage is caused by free radicals and reactive oxygen species that are largely endogenous. Oxidative damage caused by free radicals has implications in various pathological conditions, namely damage to cells, tissues and organs such as liver, kidneys, heart in both humans and animals. This damage can end in cell death resulting in the acceleration of various degenerative diseases2,3
Some vitamins that act as antioxidants include vitamins A, C and E (tocopherol). In addition to vitamins, flavonoid compounds are also one of the secondary antioxidants. Flavonoids contained in the fruit of terong belanda attract attention of numerous scientists because of its potential as an antioxidant in the body. 4
Terong belanda is a fruit that contains nutrients and vitamins that are very important for the health of the human body such as anthocyanin, carotenoids, vitamins A, B6, C, and E, and rich in iron, potassium, fiber, and minerals.5 Anthocyanin is a flavonoid glycoside in the form of a red dye found in flowers, fruits, and leaves. It has been shown to be an antioxidant and protect against damage to liver cells.6 Terong belanda (Solanum betaceum) is widely cultivated in Bali, especially in the area Bedugul and Kintamani. The fruit is traditionally used in Kintamani to treat sprue disease. Terong belanda has a complete nutritional content, but not much is known, thus its health benefits need to be explored. One is the activity of antioxidants to inhibit the aging process and degenerative diseases caused by oxidation reactions, which needs to be proven scientifically. In this study, in vitro tracings used the DPPH test as a marker for antioxidant activity.
Materials and Methods
Plant Material
Ten kilogram of Solanum betaceum Cav was collected from Penelokan Village, Kintamani Subdistrict, Bangli Regency. Taxonomic identity of the plant was examined in LIPI Eka Karya Bali Botanical Garden.
Instruments and chemicals
1,1 Diphenyl-2-pycrylhidrazyl (DPPH) radical scavenging assay was done using a UV–visible spectrophotometer (Pharmaspec-1700, Shimadzu, Japan). Separation of various fractions was carried out on silica gel (Merck, 230–400 Mesh). TLC was done on a precoated silica plate (GF254 Merck). HPLC analysis was done by Agilent 1200 Preparative High-Pressure Liquid Chromatographic system equipped with prep pump, a Rheodyne injector, Diode Array Detector in combination with Chem32, Chemstation software. LC-ESI-MS analysis was conducted on Agilent 6520 precise mass Q-TOF LC/MS coupled with Agilent LC 1200 prepared with Extend- C18 column of 1.8 m, 2.1 × 50 mm.
DPPH Radical Scavenging Activity
Extracted ethanol, ether and n-butanol were partitioned for their radical scavenging activity using DPPH. The evaluation of radical scavenging activity using DPPH method followed the procedure carried out by Shimada,1992.7
Extraction and Fractionation
The samples of Solanum betaceum Cav were macerated with 70% ethanol in a glass jar immersed in the solvent for ± 24 hours. The filtrate is then filtered, and the dregs are re-macerated for 2-3 times with ethanol until the compounds contained within are extracted. The filtrate was collected and evaporated with a rotary vacuum evaporator until a concentrated extract of ethanol was obtained. The ethanol extract was precipitated with an ether solution. The glycoside deposition of flavonoids was dissolved in water and then fractionated with n-hexane repeatedly until water and n-hexane fractions were obtained. The hexane fraction was evaporated with a vacuum rotary evaporator to obtain a concentrated extract of n-hexane (EH). Furthermore, water extract, fractionated repeatedly with chloroform, to obtain water and chloroform extract. The water fraction was reextracted with n-butanol repeatedly to obtain n-butanol and water extracts. The chloroform and n-butanol extracts were concentrated to obtain a concentrated extract of chloroform (EK) and n-butanol (EB). Furthermore, concentrated extract of n-hexane, chloroform, and n-butanol was tested for flavonoids and antiradicals.
Separation of n-Butanol Extract
The aqueous etanolic extract was partitioned into hexane chloroform and butanol. The preliminary chemical analysis of butanol extract was done using thin layer chromatography on a precoated silica gel (GF254) (Merck) using ethyl acetate: n-butanol: acetic acid 10% (7:3:1), as mobile phase. The chromatogram was developed in a saturated chromatographic chamber and evaluated under UV at 254 and 366 nm. Butanol extract was separated on a silica gel (230-400 mesh) eluting with ethyl acetate: n-butanol: acetic acid 10% (7:3:1), to yield seven subtractions (Fr 1-7). The fraction of subsequent column yield in TLC returns is sprayed with sitroborate stain, and 6 fractions contained positive flavonoids. Of the 6 fractions, fractions 5 and 6 were relatively pure. Fractions 5 and 6 were further identified by spectrophotometry, IR, UV-vis and LCMS/MS spectrometry.
FTIR Identification
The isolates were crushed and then mixed with potassium bromide (KBr). The mixture was prepared into solid form and in a waterless condition using a mold. The mixture was further measured by an infrared spectrophotometer.
UV-Vis Identification
Total of 1 mg of butanol fraction was dissolved into 100 mL methanol (10 ppm) as the dosage solution, then the uptake of the fraction was measured by UV-Vis spectrophotometer at 200-500 nm wavelength.
LC/MSMS Identification
Liquid Chromatography Electrospray Ionization Mass Spectrometry (LC-ESI-MS) analysis followed the procedure carried out by Sulaiman ,2014.8
Results
The aqueous ethanol extract precipitated by ether was partitioned into hexane, chloroform and butanol. Furthermore, all the extracts were tested flavonoid. Flavonoid test results are presented in Table 1.
Table 1: The results of the flavonoid test from the partitioned extract.
| Extract | Control | Mg-HCl
(Willstatter test) |
H2SO4 p
(Bate-Smith Metcalfe test) |
NaOH 10 % |
| Ethanol | Yellow | Pink | Dark red | Dark yellow |
| n-hexane | Green | Green | Green | Green |
| Chloroform | Brownish yellow | Brownish yellow | Brownish yellow | Brownish yellow |
| n-Butanol | Brown | Pink | Red | Yellow |
1,1 Diphenyl-2-pycrylhidrazyl (DPPH) radical is one of the free radicals widely used for testing the preliminary radical scavenging activity of plant extracts9 as it is a direct and reliable method for determining radical scavenging activity.10 The sub extract was screened for their radical scavenging activity in vitro using DPPH. Radical scavenging activity for all extract are shown in Table 2.
Table 2: Test Results of IC50 Ethanol extract, ether and butanol extract.
| Extract | Concentration
(ppm) |
Absorbance | %
inhibition |
Linear regression |
|
Ethanol |
10 | 0,474 | 4,05 | y = 0,2434x + 0.9136
R² = 0,9925 IC50 = 201,66 ppm |
| 25 | 0,490 | 7,311 | ||
| 50 | 0,428 | 13,372 | ||
| 75 | 0,401 | 18,777 | ||
| Ether | 10 | 0,462 | 6,478 | y = 0.1761x + 2,4617
R² = 0,9019 IC50 = 269,95 ppm |
| 25 | 0,458 | 7,287 | ||
| 50 | 0,435 | 11,943 | ||
| 75 | 0,421 | 14,777 | ||
| n-Butanol | 10
25 50 75 |
0.425
0.358 0.308 0.244 |
13,967
27,530 37,651 50,607 |
y = 0,6311x + 5,7572
R² = 0,9495 IC50 = 70,11 ppm |
Infrared analysis was carried out to determine functional groups of compounds contained in butanol n extract. The infrared spectra of the active fraction are shown in Figure 1.
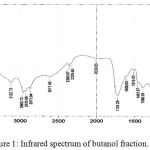 |
Figure 1: Infrared spectrum of butanol fraction.
|
Identification of the butanol fraction with UV-Vis spectrophotometer with methanol solvent gave maximum absorbance at wavelength 262,80 nm (band II), and 331,00 nm (band I).
The identification of the same was performed by LC-ESI-MS/MS analysis in positive mode. The results showed that flavonoid glycoside compounds appeared at retention times of 5.6, 6.045 and 6.2. The spectra of the three flavonoid glycosides are presented in the figure 2,3 and 4.
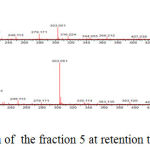 |
Figure 2: Mass spectrum of the fraction 5 at retention time is 5,628.
|
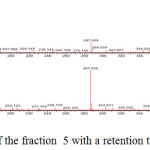 |
Figure 3: Mass spectrum of the fraction 5 with a retention time of 6.211.
|
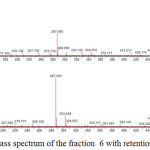 |
Figure 4: Mass spectrum of the fraction 6 with retention time is 6.045.
|
Discussion
Phytochemical analysis of ethanol extract was positive in with pink change in Willstatter test, dark red on Bate-Smith Metcalfe test, and dark yellow on 10% NaOH test. The same is shown for extract n-butanol. The n-hexane and chloroform extracts showed negative results for flavonoid test as it did not show any specific color change when reacted with the flavonoid test reagent. The result of glycoside test with Lieberman Burchard reagent, green ring formed showed that the extract contained glycoside which means n-butanol extract of terong belanda contained flavonoid glycosides. Flavonoid glycoside extracts were then tested for in vitro antioxidant activity.
The results of the measurements show that the flavonoid glycosides contained in n-butanol extract of the terong belanda have an IC50 value of 70.11 mg /L. So, to absorb 50% free radicals it takes 70.11 mg /L antioxidants. Compounds with IC50 values ranging from 50-100 mg /L are strongly active antioxidants.11 Thus, the n-butanol extract of the terong belanda has strong antioxidant activity. This is in line with Asih12 who obtained IC50 value of 68.14 mg /L from peels of terong belanda n-butanol extract.
Infrared analysis of the butanol fraction (Fig. 1) showed that the compounds in the butanol fraction contained several functional groups such as the vibration of the -OH group-bound to a widened and amplified wavelength 3518.16 cm-1 in the presence of vibrations at 1211.30 cm– 1 with a weak intensity indicating the presence of a CO-group stretch. The presence of aromatic CH groups is indicated by the absorption of 3122.75 cm-1 wave numbers reinforced by the aromatic acceptance resulting from the C-H outflow of the fields in the absorption of 887.26 cm-1. The aromatic C = C uptake indicates the presence of an aromatic ring indicated by absorption at wave numbers 1608.63 cm-1, 1516,05 cm-1 and 1463,97 cm-1. In addition to the presence of aromatic CH uptake, it also implies that there are CH aliphatic uptake with absorption at wave numbers 2960,73 cm-1, 2935,66 cm-1 and 2873,94 cm-1. This assumption is supported by the absorption of wave number 1398,30 cm-1. The carbonyl group or C = 0 in the compound is shown by the presence of approval with sharp bands and strong intensity at the wave number 1726,29 cm-1. Based on the identification of infrared spectra, the active fraction is believed to contain OH, CH aromatic, CH aliphatic, C -O, C = C aromatic, and C = O functional groups. The presence of aromatic CH groups is indicated by the absorption of 3122.75 cm-1 wave numbers reinforced by the aromatic interest resulting from the C-H outflow of the fields in the absorption of 887.26 cm-1. The aromatic C = C uptake indicates the presence of an aromatic ring indicated by absorption at wave numbers 1608.63 cm-1, 1516,05 cm-1 and 1463,97 cm-1. In addition to the presence of aromatic CH uptake, it also implies that there are CH aliphatic uptake with absorption at wave numbers 2960,73 cm-1, 2935,66 cm-1 and 2873,94 cm-1. This assumption is supported by the absorption of wave number 1398,30 cm-1. The carbonyl group or C = 0 in the compound is shown by the presence of uptake with sharp bands and strong intensity at the wave number 1726,29 cm-1. Based on the identification of infrared spectra, n butanol fraction is believed to contain OH(3550-3200 cm-1), CH aromatic (3150-3050 cm-1), CH aliphatic(2950-2800 cm-1), C -O (1273,02 cm-1), C = C aromatic (1650-1400 cm-1), and C = O (1850-1730 cm-1) functional groups.
Compounds with a UV-Vis spectrum in band II with a range of λ max 250-280 nm and band I with a range λmax of 310 – 350 nm belong to the flavone group, or flavonol (3-OH substituted). The presence of flavonoid compounds in the butanol fraction is also reinforced through a study by13 who isolated the active cytotoxic flavonoid compound from the yellow leaf (Murraya panicullata). The identified flavonoid compounds were from flavones that gave maximum absorption at wavelengths of 273.10 nm (band II), and 347.20 nm (band I).
The presence of compounds in the butanol fraction is supported by the study of14 who identified flavonoid compounds from tempuyung herbs (Sonchus arvensis.) with maximum absorption at λ 343 nm (band I) and λ 254 nm (band II). Identified flavonoid compounds by15 in the Taraxacum officinale n-butanol fraction (Asteraceae) with maximum absorption at λ 337.00 nm (band I) and λ 265.5 nm (band II). Based on these data, the active fraction in the terong belanda n-butanol extract is believed to contain flavone or flavonol (3-OH substituted). The maximum absorption occurring at the wavelength shown by the band II is caused by the benzoyl group in the presence of an electronic transition of n-π* indicating the presence of a single chromophore group such as the C = O bond.16 While the maximum absorption occurring at the wavelength indicated by the band I is caused by the cinnamoyl group in the presence of electron excitation of π-π * indicating the presence of the conjugated C= C chromophore group.17
The spectra in Figure 2 with retention time of 5.628 appeared peak of precursor ions with (M+H) + 611,162 (C27H31O16) (Routine). and product ions at m/z 465 (C21H21O12), 447 (C21H19O11), 303 (C15H11O7) (base peak), 163 (C9H7O3) and 86 (C3H2O3). The peak emerging at m/z 465 [(M + H) 146] + due to the release of the C6H10O4, m/z 447 [(M + H) 146-18] + the release of one water molecule, m/z 303 [(M + H) 146- 18-144] +, loss of C6H10O5, m/z 163 [(M + H) 146-18-144-104-36] + and m/z 86 [(M + H) 146-18- 144-104-36-77] + release of C6H5 radical. At retention time 6.211, Figure 3 the peak of precursor ions with (M+H)+ 503,287 (C25H26O11) (Quercetin 3-O rhamnoside) and product ions at m/z 449,107 (C21H21O11), 287,056 (C15H11O7) (base peak) and 163,040 (C9H7O3) may point to glucoside quercetin compound. The peak at m/z = 449,107 [(M + H) -54] + raised from the release of C4H6, m/z = 287,056 [(M + H) -54-162] + release of one molecule C6H11O5, m/z = 163 [ (M + H) -54-162-16-108] release of C6H4O2.
Peak with (M+H)+ 595,1651 (C27H30O15) Figure 4 (Kaempferol 3-O rutinoside) with 6,045 retention time and product ion at m/z 449,1070 (C21H21O11), 287,0550 (C15H11O6) base peak. Peak at m/z 449 [(M + H) -146], m/z 287 [(M + H) -146-162].
Three flavonoid glycoside compounds (routine, quercetin 3 O rhamnoside, Kaempferol 3-O rutinoside) have been identified as flavonoid glycoside compounds, groups of flavonol (3 OH substituted). All compounds show a base peak at C15 which is a characteristic peak for the basic structure of flavonoids compounds.
Conclusion
Based on the research results, the following can be concluded:
The flavonoid glycoside compound in the n-butanol extract belongs to a powerful antioxidant with IC50 = 70.11 mg/L. Flavonoid glycoside compounds contained in the 5 and 6 fraction of n-butanol extract of terong belanda are predicted flavonoid compounds namely Quercetin3-O rhamnoside(C25H26O11), Routine (C27H31O16) and Kaempferol 3-O rutinoside (C27H30O15).
Acknowledgments
The Author would like to thank the Directorate General of Higher Education and Center of Research and Community Service Udayana University for funding this study through Hibah Doktor Scheme 2017.
References
- Wresdiyati T., Astawan M., Fithriani D., Adnyane I. K. M., Novelina S and Aryani S. Effect of α-Tocopherol on Superoxide Dismutase and Malondialdehyde Profiles in Rat Liver Under Stress Conditions. Veterinary Journal. 2013;2:2-9.
- Kevin C., Kregel H. J and Zhang. An Integrated View of Oxidative Stress in Aging: Basic Mechanisms, Functional Effects and Pathological Considerations. Am J. Physio Regul Integer Comp Physiol. 2006;292:R18-R36.
- Valko M., Leibfritz D., Moncol J., Cronin M. T. D., Mazur M and Telser J. Review: Free Radicals and Antioxidant in Normal Physiological Functions and Human Disease. Inter J. Biochem Cell Biol. 2007;39:44-84.
CrossRef - Syariah W. O., Usmar S. R. Effect of Tamarillo Fruit Juice (Cyphomandra betaceum) on Cholesterol Levels of Total White Rat (Rattus norvegicus) Male. Pharmacy and Pharmacology Magazine. 2011;15(2):95-98.
- Kumalaningsih S. Antioxidants Natural Free Radical Antidotes, Sources, Benefits, Ways of Provision and Processing. Surabaya: Trubus Agrisarana. 2006.
- Su S and Chien P. J. Antioxidant activity anthocyanins and phenolics of rabbit eye blueberry (Vaccinium ashes) fluid products as affected by fermentation. Food Chemistry. 2007;104(1):182-187.
CrossRef - Shimada K., Fujikawa K., Yahaira K., Nakamura T. Antioxidative properties of xanthone on the auto oxidation of soybean in cyclodextrin emulsion. J Agric Food Chem. 1992;40:945–8.
CrossRef - Sulaiman C., Sivadasan P. G., Balachandran I. Identification of phenolic antioxidants in Ipomoea mauritiana using spectrophotometric and mass spectroscopic studies. Avicenna J Phyto med. 2014;4:89–96.
- Deshpande S., Kewatkar S. M., Paithankar V.V. In-vitro antioxidant activity of different fraction of roots of Cassia auriculate Linn. Drug Invent Today. 2013;5:164–8.
CrossRef - Aksoy L., Kolay E., Ilonu Y., Aslan Z., Kargıog lu M. Free radical scavenging activity, total phenolic content total antioxidant status, and total oxidant status of endemic Thermoses turcica. Saudi J Biol Sci. 2013;20:235–9.
CrossRef - Jun M. H. Y., Fong J., Wan X., Yang C. S and Ho C. T. Comparison of Antioxidant Activities of Isoflavones Form Kudzu Root (Pueraria labara O). Journal Food Science Institute of Technologist. 2003;68:2117-2122.
- Asih I. A. R. A., Puspawati N. M., Wiwik S. R., Devi S. D. Isolation and Identification of Fenol Group Compounds from Tamarillo peel (Solanum betaceum Cav.) which is active as an Antioxidants. SENASTEK Proceedings “The role of science and technology that is environmentally sound in improving human welfare Jimbaran:Udayana University. 2014.
- Adfa M. Isolation of Cytotoxic Active Flavonoid Compounds from Kemuning Leaves (Murraya Panicullata L. Jack). Gradient Journal. 2007;3(2):262-266.
- Sriningsih., Adji H. W., Sumaryono W., Wibowo A. E., Firdayani C., Kusumaningrum S and Kartakusuma P. Compound Flavonoids Analysis of Tempuyung Herba (Sonchus arvensis L.). Center for P2 of Pharmaceutical Technology and Medical Deputy for BPPT TAB. Jakarta: Pancasila University. 2014.
- Winarsi H. Natural Antioxidants and Free Radicals, Kanisius, Yogyakarta. 2007.
- Sastrohamidjojo H. Yogyakarta: UGM Press. 2001.
- Fessenden R. J and Fessenden J. S. Organic Chemistry. (Aloysius H. A., Pentj). Third Edition. Jakarta: Airlangga. 1995;I.

