
Ayan Chatterjee1 and Uttam Kumar Roy2
1Research Associate, Master of Engineering, Department of IT Jadavpur University, Kolkata, India.
2Department of IT Jadavpur University, Kolkata, India.
Corresponding Author E-mail: ayan1.c2@gmail.com
DOI : https://dx.doi.org/10.13005/bpj/1561
Abstract
Health Monitoring has become one of the most important task of this century with a change in population demography to build a smart healthcare system to give proper treatment to the correct patient with reduced cost, more consistently for better living. Heart & it's related parameters are very important for good health condition. Statistics from Centers for Disease Control and Prevention, in 2008, around 616K people died of heart disease and 25% cause of total death and in 2010 the percentage grew up to 31%. High blood pressure, high cholesterol, diabetes, smoking, overweight are some of the real cause of heart disease. To determine heart state, ECG is a proven and well accepted system. But, the device is expensive and requires training. ECG sensor measures the bio-potential generated by the electrical signals that is responsible to control the expansion and contraction of heart chambers. In this article, we have focused literature review on Non-Invasive cardiovascular monitoring researches undertaken so far to provide new possibilities and research trends so that we can monitor our health better and take precautions earlier with the use and advancement of Computer Science & Technology. Here we have primarily focused on PPG signal and its application to measure important blood parameters like Glucose, HB, SP02 that indirectly or directly can provide us a status of our health when required. Recent report suggests that PPG is very useful for measuring heart rates, arterial age (with PPG derivatives), blood pressure, oxygen saturation, emotion detection, respiratory rate etc. Accurate measurement of PPG can open up new possibilities in non-invasive computer aided cardiac research for smart care-giving.
Keywords
ECG; FPS; FFT; Filter; HRV; ICA; Machine Learning; PPG; Sampling; SPO2; Spectometry; Wavelet
Download this article as:| Copy the following to cite this article: Chatterjee A, Roy U. K. Non-Invasive Heart State Monitoring an Article on Latest PPG Processing. Biomed Pharmacol J 2018;11(4). |
| Copy the following to cite this URL: Chatterjee A, Roy U. K. Non-Invasive Heart State Monitoring an Article on Latest PPG Processing. Biomed Pharmacol J 2018;11(4). Available from: http://biomedpharmajournal.org/?p=24177 |
Introduction
Cardiovascular problem is one of the major concern in these days as majority of the people die from this problem annually. In 2015, it was responsible for 31% of the total death and estimated around 17.7 million people. The number is increasing alarmingly and sources claimed that total estimated global cost of cardiovascular disease was $863 billion in 2010 and it might likely to increase by 2030 to $1044 billion. Heart disease including Coronary Heart Disease, Hypertension, and Stroke claims the top rank in most of the countries to end a life. Meanwhile, medical science has improved a lot to stand by the patients and therefore, new possibilities are opening up. Early diagnosis can prevent the life threat by continuous monitoring of heart parameters and it’s assessment with Machine Learning Algorithms.
So, the target is to develop a Smart Accurate Cardiovascular Health Monitoring Application with the help of Smart Mobile Camera and other Sensors available to capture video, movements, temperature and further analysis on feature extraction in the form of image & signal processing and collecting necessary health related data of the patient and taking advance steps with machine learning / training the system.
ECG Signal
ECG [5]
It is used to assess the electrical and muscular functions of the heart. The frequency range for ECG is 0.05 – 150 Hz (diagnostic) and 0.5 – 40 Hz (monitoring).
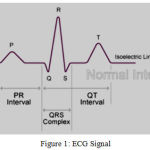 |
Figure 1: ECG Signal.
|
P-R interval: 0.12 – 0.20 sec
QRS width: 0.08 – 0.12 sec
Q-T interval: 0.35 – 0.43 sec
The first wave (p wave) represents atrial depolarization. Due to gravity, 70% of blood falls from Atria to Ventricle and remaining 30% by this force so little spike. Then a flat line to transfer the stimuli to bundle of His and all blood transfer completion from Atria to Ventricle. Force closes the valves. Then QRS Wave complex.
Q. wave is due to depolarization of septum from left to right. It separates two bundle branches and carries an opposite conduction.
R. wave is due to contraction of muscular ventricular wall as more muscle means more cells. More cells means more electricity. More electricity leads to a bigger wave. It is ventricular depolarization.
S. wave represents depolarization of the Purkinje fibers.
T. wave represents repolarization of the Ventricle.
There is a brief period between the end of the QRS complex and the beginning of the T wave where there is no conduction and the line is flat. This is known as the ST segment and it is a key indicator for both myocardial ischemia and necrosis if it goes up or down.
From the Fourier transform of human ECG signal it has been found that P and T wave frequency generally lie between 0.5 and 10Hz and QRS complex frequency ranges between 4 and 20Hz. The P or T wave sometimes coincides with the baseline noise having a low frequency range of 0–0.8Hz.
ECG suffers from noises like power line interface, electric contact noise, motion artifact, muscle contraction, baseline wander, and Gaussian noise and for that different types of filters are used like adaptive filter, Kaiser filter, Butterworth filter, Elliptic filter, Chebysev Type I, Chebysev Type II, NRFIR etc.
Low frequency: 0.5 Hz. Using filter, frequency > 0.5 Hz is not removed. So, it is the cutoff frequency.
High frequency: It is QRS component and value is 20 Hz. Upper cutoff is 21 Hz. 5-15 Hz Energy and Band pass Filter is used for QRS detection.
High pass filter is used to cut the lower frequency components. Cutoff frequency is chosen in a way, not to distort original signal. Normal heart rate range: 40 bpm à 0.67 Hz so minimal cutoff 0.5 Hz. A filter with linear phase is used to avoid phase distortion.
PPG Signal [1,2,3,4,11]
Mobile camera uses convex lens that has few properties like focal length, aperture, sensor size etc. It detects Electro Magnetic radiation at 350-1000nm wavelengths & in that wavelength range, 700-1000nm is IR radiation. IR is a special form of invisible electromagnetic wave. Invisible radiation can be felt by heat.
Mobile camera have a photo emitting diode and a photo detector. Light source illuminates the tissue and photo-detector calculates the small variation in light (at 900 nm wavelength) intensity associated with blood volume change in the vessels (of mainly fingertips, toes, forehead and ear lobe). Research has shown that PPG obtained from fingertip & ear lobe gives better accuracy and consistency than others.
For better picture, IR radiation is blocked by film or filter (camera glass). If no IR filter, pictures will not be as good as digital camera. Challenges remain how to handle ambient light, patient motion, blood-pulsation effects, and the general subtleties of human physiology!.
Average pixel intensity/frame on Red plane,
if > 200: ‘Placed Properly’
Else ‘not placed properly’
Contact and Non-Contact fingertip image and PPG
Contact PPG is clear
Non-contact pulse rate is low
More Contact Pressure
Deforming arterial wall leads to wrong reading.
Block micro circulation in the capillary.
FPS or frame rate is a property of digital camera to capture video of an object. Standard FPS rate is considered to be 30 fps to have a clear smooth video. Example TV, mobile camera. In some experiment, FPS of the video has been considered as Sampling Rate of the PPG signal.
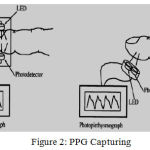 |
Figure 2: PPG Capturing.
|
PPG Signal Capturing
PPG is used to determine variation in blood flow/volume in the body which occur with each heartbeat. It reflects the blood movement in the vessels that travels from heart to fingertips and toes through the vessels in the wave like motion and it is measured optically with the help of light intensity (as amplitude of the signal over time). From light source/camera, light is sent to the tissue and part of it is absorbed (DC part/Fixed Absorbance) and some part is backscattered which corresponds to variation of blood volume (AC part/Modulated Absorbance). This light is invisible and falls in the wavelength range of IR. Its average intensity variation graph gives us the heart beat graph over time.
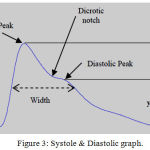 |
Figure 3: Systole & Diastolic graph.
|
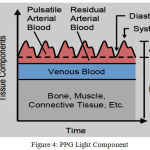 |
Figure 4: PPG Light Component.
|
The Process Can Be Summarized As
Camera → Finger Touch Non-Focused Video → Data Receive → filtering/Smoothing → Resampling with cubic spine interpretation (for low resolution of signal) → Peak detection → Artifact removal & feature extraction → HR & SPO2.
Assumption
For age/condition/physical activity: 60-200 bpm is in general.
Experimental purpose: 40 – 230 bpm =. 667 to 3.833 Hz.
Sampling Frequency = 2* 3.833 Hz = 7.667 Hz (Nyquist).
PPG Signal & Higher Order Derivatives
It shows us how steep the tangent line to the graph will be and some parts of the graph becomes flatter, and some parts slope up more steeply. It gives more accurate inflection point and thus makes interpretation of PPG Wave easier. We want to find derivatives of signal without increasing the noise. It can be done with using ‘diff’ in MATLAB but in higher derivatives, there is a chance of noise amplification and that might lead to inaccuracy. To fix this, a differentiator filter to be used.
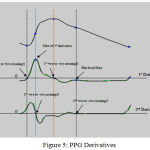 |
Figure 5: PPG Derivatives.
|
1st Order Derivative
Used for calculating Stiffness index = Height of the person / (Delta T)
In 1st Oder Derivative, Systolic peak becomes early systolic peak and second peak is the Inflection point. At inflection point dPPG/dt → 0 and at diastolic peak (in 1st order): dPPG/dt = 0
Reflection Index (RI): (b/a) * 100%
b: Amplitude of second peak / Inflection Point (DM)
a: Amplitude of first peak / systolic peak (PM)
N.B: second peak is clearly visible for young person and less prominent or unseen in most cases of old subjects.
Importance of RI: Changes with age group. With age increment RI varies as, PM amplitude reduces and DM amplitude increases.
Augmentation Index (AI): (Ps – Pd) / (Pi – Pd)
Pi: Pressure at systolic peak
Ps: Pressure at inflection point (beginning up stroke)
Pd: Min diastolic pressure
Importance of AI: To determine arterial stiffness. AIR & AIL has a correlation of 0.892 and P < 0.000 and PPG has been calculated from middle finger and ear.
N.B: With increased age, diastolic edge tends to come closer to systolic edge and SI, RI goes up. Increase in arterial stiffness and a faster reflected wave augmenting the forward wave the pulse becomes rounded. As age increases, pulse wave velocity increases decreasing the time taken for pressure waves reflected from the periphery of the circulation (mainly from the lower part of the body) to return to the aorta and then to the upper limb – means the pulse wave velocity increases. In addition, augmentation of the forward pressure pulse wave by a fast returning reflected wave is another key feature that can be found in subjects with arterial stiffening.
2nd Order Derivative
It is used to perform to get more clear inflection points. 4 separate systole waves (a, b, c, d) and a diastole wave (e) is measured. a, b are at early systolic phase and c, d are at late systolic phase. Ratio of b, c, d to a is measured to measure different cardiac state. The a, b, c, d and e waves represent the initial positive, early negative, re-increasing, late re-decreasing, and diastolic positive waves, respectively.
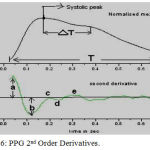 |
Figure 6: PPG 2nd Order Derivatives.
|
b/a: It used to assess aortic stiffness and wave reflection and to measure atherosclerosis. It shows increased arterial stiffness. It increases with age.-b/a in the exposure group dose dependently decreased with increases in length of working career (duration of exposure to lead) and blood lead concentration (Pb-B).
c/a: It found to reflect decreased arterial stiffness and assess the risk for the development of metabolic components. It decreases with age.
d/a: Similar to c/a ratio and -d/a ratio is a useful index for the evaluation of vasoactive agents, as well as an index of left ventricular afterload.
e/a: Same as c/a
a-a interval: The R-R interval in the ECG signal correlates closely with the a-a interval in APG signal as both represent a completed heart cycle.
Section of the APG waveform: A-G as described below.
Chaos Attractor: Check with subjects with different diseases, varying from a common cold to pneumonia, intra-cerebral hemorrhage and acute poisoning.
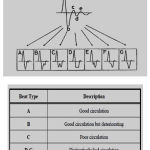 |
Figure 7: APG Waveform.
|
Comment: The first APG waveform A (far left) refers to good circulation, whereas the amplitude of b wave is lower than c wave. The last APG waveform G (far right) refers to distinctively bad circulation, whereas the amplitude of c wave is lower than b wave. (c<b: bad circulation).
Oxyzen Saturation
Artery blood image on red frame has two major components like:
Pulsatile Component (AC): Peak to Peak distance of heart beat signal.
Non Pulsatile Component (DC): Mid value between min & max peaks.
The AC signal represents the absorbance of pulsed arterial blood, and the DC signal indicates the absorbance of non-pulsed blood and tissues.
Oxygenated Blood Image: redder wavelength (bright red) → 640 nm to 660 nm. Absorbs less red light than IR. AC component of the red signal is smaller than IR signal.
De-Oxygenated Blood Image: Infrared Wavelength (dark red) → 940 nm. Absorbs more IR.
R = (AC of RED / DC of RED)/(AC of IR/DC of IR).
SP02 = 104 –28*R or 110 – 25*R.
The pulse oximetry sensor is composed of an infrared (or red) transmitter and receiver, and these two devices are mounted on both sides of the target subject (finger or ear lobe). This sensor measures a transmitted light intensity from the transmitter to the receiver, and its measured value indicates an absorbance of the light in tissue and blood. In particular, the absorption of infrared light (absorbance) is proportional to material characteristics such as molar absorptivity, molar concentration, and path length. This principle is called the Beer–Lambert law.
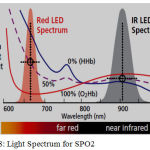 |
Figure 8: Light Spectrum for SPO2.
|
Note
Normal Healthy person’s SPO2: 94% – 99%
Mild respiratory disease’s SPO2: 90% and above
Supplementary oxygen is needed if SPO2: < 90% (88% : special medication) & <= 80% Hypoxic
Normal: 98% at sea level, 95% at 5000 ft, 90% at 10000 ft etc.
SPO2, Pulse rate and respiratory rate: three major parameters for good health & SPO2 is an important parameter to check risk of Heart Attack.
Non-Contact PPG
Mobile → Face Video → Face tracking and optic information → ICA → Decompose to independent component → FFT → HR Frequency
Based on ICA technology. ICA stands for ‘Independent Component Analysis’. It is a statistical method.
Contact problem
Disturb in daily life of a patient.
Discomfort/skin irritation.
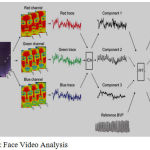 |
Figure 9: Face Video Analysis.
|
Face tracking and setting ROI (Region of Interest – full height and 60% width). OpenCV is used for face location and coordinate. ICA is used to reduce motion artifact.
Extract and process of optic information (RGB channel to CIU LUV color space to reduce fluctuation).
Video taken 0.5 m distant for 1 min. We can use Digital Camera or webcam and Front camera: 30 FPS and rear camera: 15 FPS.
PPG normal operational range (fingertip) at 0.75 to 4 Hz.
Finger reading vs. Non-Contact reading:
Still: -0.05+- 2.29 bpm.
Motion: 0.64 +- 4.59 bpm.
It can be applicable for facial expression, emotion detection, and multiple people HR detection at the same time.
Noise Removal [2, 12, 17]
PPG signal suffers from noises like Artifacts (motion, baseline drift, power line interference, low amplitude PPG, premature ventricular contraction), Gaussian wave etc. To get rid of noises filter to be used. Power line Interference is due to power sources interference, instrumentation amplifiers, the recording system picking up ambient electromagnetic signals and other artifact. In Australia, it is 50Hz or increasing harmonious frequencies. Low pass filter / band pass filter is used to filter out noise signal. Motion Artifact is due to not touching the camera properly. Variations in temperature and bias in the instrumentation amplifiers can cause baseline drift sometimes. It is low frequency signal so high pass filter is used.
Study shows the use of filters like Butterworth Filter (IIR) that is LPF, Least square polynomial for removing moving artifacts and calculate peaks from distorted signal captured, 4th Order band pass filter removes DC component (Due to finger movement & changes in venous pressure) & High frequency Noise removal (0.6 Hz to 15 Hz to remove effects of respiratory rhythms and higher frequency disturbances), Wavelet analysis for statistical data for HRV, High Pass Filter, NRFIR, WindKessel model, Kalman Filter & improved Kalman Filter for Gaussian noise, Kaiser, Elliptic, Chebysev etc. Above all, perfect filter design based on condition to retrieve accurate noise free PPG signal is still under the scanner of research.
Emotion Detection [6,9,10]
Research has been conducted on ECG with Machine Learning algorithms to detect emotion on extracted HRV (using Pan – Tompkins algorithm). Research is needed if similar thing can be done on PPG. Emotion assessment with multiple physiological signals normally increases the computational complexity including computational time and space and limits the subject’s freedom movements during the experiment. However, no study to date has yet been performed on frequency analysis of HRV signals for discrete emotion classification. Study used audio-visual stimuli (video clips) to evoke five different emotions (happiness, disgust, fear, surprise, neutral). A set of statistical features were derived using DWT over two different frequency bands (LF: 0.03– 0.12 Hz; and HF: 0.12–0.488 Hz) extracted from the HRV signal. The statistical features were extracted using the following four wavelet functions: db6, db7, sym8, and coif5. These features were classified using two simple classifiers, namely KNN and linear discriminant analysis (LDA). Finally, comparing the classification rates of these two different classifiers over different wavelet functions produces expected result.
ECG Signal → Feature Extraction → HRV → Wavelet Transform → Extract statistical feature → Map to KNN (K-nearest neighbor) & LDA (Linear discriminant analysis).
Algorithms [2,6]
In this section, we have discussed about different algorithms & techniques to process PPG signal obtained from mobile video and their assumptions. Considering age/other condition/physical activity, heart can vary in between 60bpm to 200bpm. To design the algorithm and before starting the analysis on received PPG from image processing, we need to set a range for heart beat measurement. Appropriate selection of RRI sampling rate and the number of FFT points result in good performance in real time HRV calculation. Peak detection algorithms miss minimum and maximum peaks due to upward or downward shift due to DC component or change in absorption constant.
Algorithm#1
Camera → Data Receive → Filtering/Smoothingà resampling with cubic spine interpretation (for low resolution of signal) → Peak detection → Artifact removal & feature extraction → HR & SPO2.
Fs: 30 frame/s → 30 Hz
RGB → HSV: For image processing and for separating the intensity better. (Used in hrv 4 training: Apple store).
Limited frame rate from camera: 30Hz and improved rate: 180Hz.
4th Order Band pass filter is used to remove noise.
Algorithm#2
Video Signal → Brightness calculate all in red plane → Band pass filter (butter worth filter 2nd order – IIR low pass) to remove noise → Sliding window (FFT à Peak detection → Smoothing).
Assumption
For age/condition/physical activity: 60-200 bpm.
Experimental purpose: 40 – 230 bpm = .667 to 3.833 Hz
Fs= 2* 3.833 Hz= 7.667 Hz by Nyquist Theorem.
Sliding window: 6 sec (6 sec startup delay).
FFT window = 128 (power of 2).
FFT + Peak Detection with Algorithm + smoothing → 0.5 sec repeatedly.
Fr=Fs/N=N/Tw/N=1/Tw.
If Tw goes up, better Fr / frequency resolution but reduced time accuracy.
Use Hann window on FFT magnitude and col vector to row vector representation to reduce leakage reduction.
Algorithm#3
PPG → FSM block to reduce noise → Frequency analysis for 512 good PPG samples → Feature extraction for 512 PPG samples → BP bin calculation.
FSM → Finite state machine
14 consecutive block of 64 frames each = 64*14 frames at 30 fps <=30 sec.
Algorithm#4
Reading data file → Hex to Decimal of Red & IR part → FFT → Local Maxima → HR & SPO2.
Fs=25Hz.
FFT Size=128 // default 64.
595 frames and divided into 9 parts starting from 25 to 25+128 for first and subsequent.
Window = 6 for local maxima 6 → 12 of every FFT part where 6 is the index.
Can start at index 0 but human heart rate is not of that range.
Signal range 0.5 – 2.5 Hz (FFT Theory).
Time to Frequency domain → DC signal can be seen as the magnitude of 0 Hz frequency.
Fixed 6-12 with FFT window change → No, it will vary.
We are doing in depth study to write an efficient algorithm to provide accurate result without noise artifacts and increase its acceptability with machine learning & training features.
Blood Glucose Measurement [12,13]
Now a day’s diabetes has become one of the challenging health issue. All latest blood glucose detection methods are invasive. Target is to determine a way to detect blood glucose level in non-invasive way. A lot of researches are conducted and still going but success rate is not so high. One of the method is based on the collimator and Raman spectrograph on skin images. Laser collimator narrows a beam of particles/ waves in a specific direction to make collimated light / parallel rays. It also helps to determine optical length, focal length etc. Raman spectra can be collected on smart phone by converting the camera into a low resolution spectrometer with the inclusion of a collimator and dispersive optical element in front of camera. The Raman spectra on particular laser excitation wavelength, can give us the amount of absorption spectra in the solution and helps to determine Raman shift. This property can be used to determine blood glucose level. This is complex and researches are going on. The excitation difference Raman spectrum of a human finger achieved by differentiating the Raman spectrum with less blood flowing condition from the Raman spectrum with normal blood flowing condition.
The blood glucose Raman modes, between 770-914 cm-1 and 1018-1126 cm-1 become more obvious and clear in this difference Raman spectrum. It has better SNR as the contribution of the tissue components (background) to the Raman spectrum is reduced due to the differentiation. Uniting the difference Raman technique with the excitation Raman technique can improve the detection ability of the Raman modes associated with glucose and the glucose level in blood.
A lot of things also to be addressed to achieve the goal:
Try to simulate the feature with Mobile and camera
Correlation calculation
Wavelength detection
Noise cancellation
Collimator incorporation in mobile
Miniaturization of Raman spectrometer for glucose monitoring & development of calibration free estimation for quantitative glucose measurement.
Another technique we are trying to achieve – if PPG gets affected by blood sugar level and if yes, then determine the characteristics and obtain similar type of results from multiple patients to create a data set and train the network with machine learning algorithms to attain better result.
Conclusions
Here in our study, we have focused on PPG signal that is measured from skin blood flow using IR light. It is non-invasive, inexpensive, portable and convenient diagnostic tool. Analyzing PPG, we can calculate Oxygen saturation (SPO2), blood pressure (systole/diastole), Heart Rate, Arterial age, vascular disease, Respiratory Rate & Pulmonary problems predict HB Count, RBC count prediction, circulatory and respiration monitoring etc. In addition, PPG depends on location, skin (structure, temperature), blood oxygen saturation, blood flow rate, added artifacts like motion, baseline drift, power line interference, low amplitude PPG, and premature ventricular contraction and creates noise in the signal. Proper use of filter can help to extract accurate signal and a lot of research is going on to achieve the target. Higher order derivatives of PPG sharpens the signal and helps in calculation. Sharpening PPG signal with reduced noise is also another challenge. For the whole assessment, accurate data/ noise free image/ noise free signal or test data are highly required as it is very new area and related to health or personal safety. PPG measurement with smartphone camera will add another level of flavor in the research as it is almost available to every person and it can act as a major gateway to smart healthcare design plan.
References
- Chen L.,Reisner T. A and Reifman J. Automated Beat Onset and Peak Detection Algorithm for Field-Collected Photoplethysmograms” 31st Annual International Conference of the IEEE EMBS Minneapolis, Minnesota, USA. 2009;2-6.
- Chatterjee and Roy K. U. PPG Based Heart Rate Algorithm Improvement with Butterworth IIR Filter and Savitzky-Golay FIR Filter,” 2018 2nd International Conference on Electronics, Materials Engineering & Nano-Technology (IEMENTech), Kolkata. 2018;1-6. doi: 10.1109/IEMENTECH.2018.8465225
CrossRef - Lima P., Beelen P and Bakker J. Use of a peripheral perfusion index derived from the pulse oximetry signal as a noninvasive indicator of perfusion. Crit Care Med. 2002;30(6):1210-3.
CrossRef - Shamir., Eidelman L. A., Floman Y., Kaplan L and Pizov R. Pulse oximetry plethysmographic waveform during changes in blood volume. Br J Anaesth. 1999;82(2):178-81.
CrossRef - Naddafnia H. G and Saghaei M. Evaluating the relationship between arterial blood pressure changes and indices of pulse oximetric plethysmography. Anesth Analg. 2002;95(6):1686-90.
CrossRef - Chatterjee A.,Roy K. U. Non-Invasive PPG Signal based Cardiovascular Monitoring Techniques. JECET. 2018;7(1):033-047. DOI: 10.24214/jecet.B.7.1.03347.
CrossRef - Chan M. Filtering and Signal-Averaging Algorithms for Raw ECG Signals”, Ese 482 Digital Signal Processing – Washington University In Saint Louis – Final Project, December 14. 2010.
- Jo J., Lee Y and Shin S. H. Real-time Analysis of Heart Rate Variability for a Mobile Human Emotion Recognition System. 2009;305-700.
- Lee H. S., Shin and Jo J. Development of a PPG array sensor module, Proc. Institute of Electronics Engineers of Korea (IEEK) Summer Conference, Seoul, Korea. 2010;1368-1370.
- Lee H. S., Shin., Jo J and Lee Y. K. Development of a Wristwatch-Type PPG Array Sensor Module, Proc. IEEE ICCE Berlin. 2011;170-173.
- Lee Y. K., Kwon O. W., Shin H. S., Jo J and Lee Y. Noise reduction of PPG signals using a particle filter for robust emotion recognition.Proc. IEEE ICCE-Berlin. 2011;202-205.
CrossRef - Chatterjee A., Dr. Roy K. U. Non-Invasive CardioVascular Monitoring A Review Article on Latest PPG Signal based on Computer Science Researches. Sec. B. 2018;3(10):55-061. DOI : 0.18231/2454-9150.2018.0010.
- Task Force of the European Society of Cardiology and the North American Society of Pacing and Electrophysiology, Heart rate variability. European Heart Journal. 1996;17:354-381.
CrossRef - Seung-Min P., Jun-Yeup K., Kwang-Eun K., In-Hun J and Kwee-Bo S. Real-Time Heart Rate Monitoring System based on Ring-Type Pulse Oximeter Sensor.J Electr Eng Technol. 2013;8(2): 376-384.
CrossRef - Maarten J., Scholtes-Timmerman., Bijlsma S., Fokkert J. M., Slingerland R and van Veen S. J. F. Raman Spectroscopy as a Promising Tool for Noninvasive Point-of-Care Glucose Monitoring. Journal of Diabetes Science and Technology. 2014;8(5):974–979.
CrossRef - Shao J., Lin M., Li Y., Li X., Liu J., et al. In Vivo Blood Glucose Quantification Using Raman Spectroscopy. PLoS ONE. 2012;7(10):e48127. doi:10.1371/journal.pone.0048127.
CrossRef - Chatterjee A.,Roy K. U. Algorithm To Calculate Heart Rate & Comparison Of Butterworth IIR and Savitzky-Golay FIR Filter. 2018;11(2). DOI : 10.4172/jcsb.1000268.
CrossRef

