
Wedyan Yaseen Hasan1 and Mohammed Moudhaffar Ali2
1Department of Prosthetic Dentistry, College of Dentistry, University of Baghdad, Iraq.
2Department of Prosthodontics, College of Dentistry, University of Baghdad.
Corresponding Author E-mail: dr.alkarkhi@gmail.com
DOI : https://dx.doi.org/10.13005/bpj/1516
Abstract
This study aimed to assess the effect of halloysite nanotubes(HNTS) addition into soft denture lining material on thermal conductivity and thermal diffusivity, shear bond strength, tear strength, and surface roughness of the lining material. HNTS with 0.75% and 1% concentration by weight (according to the pilot study) were added into acrylic-based heat cured soft denture liner. One hundred and twenty different specimens were prepared and divided into four groups according to the test to be performed. The thermal conductivity and thermal diffusivity of the soft liner/ HNTS composite were evaluated, shear bond strength, tear strength, and surface roughness were also measured, the results showed that there was a highly significant increase in thermal conductivity of the experimental specimens in comparison with the control specimens and a non-significant change in the thermal diffusivity of the experimental specimens. The shear bond strength between the soft liner and the acrylic denture base and tear strength showed a highly significant increase, but a non- significant difference in the surface roughness test was observed in all experimental specimens. Thus it can be concluded that the addition of HNTS can provide soft liner material with improved thermal conductivity, shear bond strength and tear strength while thermal diffusivity and surface roughness were non-significantly changed when the concentration of HNTs nanoparticles increased.
Keywords
Halloysite Nanotubes; Soft Denture Liner; Shear Bond Strength; Tear Strength; Thermal Conductivity
Download this article as:| Copy the following to cite this article: Hasan W. Y, Ali M. M. Evaluation of Thermal Conductivity and Some Other Properties of Heat Cured Denture Soft Liner Reinforced By Halloysite Nanotubes. Biomed Pharmacol J 2018;11(3). |
| Copy the following to cite this URL: Hasan W. Y, Ali M. M. Evaluation of Thermal Conductivity and Some Other Properties of Heat Cured Denture Soft Liner Reinforced By Halloysite Nanotubes. Biomed Pharmacol J 2018;11(3). Available from: http://biomedpharmajournal.org/?p=22615 |
Introduction
Soft denture liners are materials used to distribute functional loads homogenously on the denture-bearing tissues in complete and partial removable dentures.1
The denture should be relined when the underlying residual ridge resorbed and the denture will lose its accurate adaptation on this resorbed ridge, so the soft liner is utilized to improve denture’s fitting to the underlying supporting tissues, occlusion, retention, stability and patient’s appearance.2
The resilient lining material can be divided into plasticized acrylic resin or silicone elastomers. The plasticized acrylic resin involves of acrylic polymers and copolymers, a liquid containing an acrylic monomer and plasticizers that is responsible for the protection of the material softness. The silicone liner comprises of dimethyl siloxane polymers which devoid of leachable plasticizers and preserve their elasticity for long period.1,3
Soft denture liners should be nontoxic, odorless, non-irritant, easily processed, no change in color, acceptable aesthetics, no dimensional changes should occur during processing, have low water absorption and solubility, should have sufficient mechanical strength, abrasion resistance and tear resistance, inhibit fungal growth and should bond sufficiently well to polymethyl methacrylate(PMMA) to avoid separation during use.1-4
A number of problems accompanied with the use of resilient denture liners, including bond failure between the liner and denture base, colonization by Candida albicans, loss of softness, porosity and poor tear strength.1,5
The polymers including polymethyl methacrylate(PMMA) and polyethyl methacrylate(PEMA) have low thermal conductivity compared with cobalt or any other metal alloys that used as a denture base material and this can prevent any sensation of heat which can lead to scald the back of the throat and possibly even the whole esophagus as the patient consuming hot drink without realizing it.6,7
Several modifications have been done recently to overcome these problems and improve the thermal properties, tear strength and bonding of the polymer. These methods included the addition of Nano particles such as zirconia, glass fiber, alumina and silver nanoparticles.6-8
To improve the properties of polymer nanocomposites that result from incorporation inorganic nanoparticles are depend on the type of incorporating nanoparticles, their shape and size, also their concentration and interaction with the polymer matrix.6
Halloysite nanotubes (HNTs) are natural Nano sized tubulars clay mineral that has many potentially important applications uses in different industrial fields [9-11] .The multilayer tubular structure of halloysite results from the wrapping of the 1:1 clay mineral layers under favorable geological conditions. HNTs have different composition of inner and outer surfaces that allow for different modification methods.12,13
In the present study HNTs were incorporated into acrylic-based heat cured soft denture lining material in an attempt to improve thermal conductivity and thermal diffusivity and some of mechanical properties.
Materials and Methods
A pilot study of thermal conductivity , thermal diffusivity and shear bond strength tests were performed and four concentrations of the nanotubes material were used (0.5%,0.75%,1% and 1.5%) to select the most appropriate and effective concentration of HNTs for each test and according to the results of this pilot study for the previously mentioned tests, 0.75% and 1% of HNTs were the most appropriate concentrations because these concentrations showed favorable improvement in thermal conductivity and shear bond strength of the soft liner material. Moreover, according to the pilot study 0.5% and 1.5% concentrations were canceled because 0.5% had minimum effect on the properties while deterioration might be occurred with 1.5% concentration. Therefore; the main study was conducted by addition of halloysite nanotubes powder (Nano Shel, USA) with concentration of 0.75% and 1% by weight into polyethyl methacrylate soft denture liner (PEMA) (Vertex™ Soft, Vertex-Dental, Netherlands). One hundred and twenty different specimens were prepared and divided into four groups according to the tests to be performed. Each group was then subdivided into three subgroups according to weight percentage of HNTs which was added, (a control group without HNTs, and experimental groups with0.75 and 1% HNTs). For each percentage 10 specimens were fabricated, totally 30 specimens for each test.
Scanning electron microscope (AIS2300C, Angstrom Advanced Inc., USA) was taken for both control (PEMA) and experimental (containing 0.75% and 1% HNTS) specimens to show the degree of HNTS dispersion within the PEMA matrix. As well as energy dispersive X-ray spectroscopy(EDS) used in conjunction with scanning electron microscopy to show the percentages of composite filler of both weight and atoms.
Fourier transform infrared spectroscopy (FTIR) analysis (Tensor 27, Bruker, Germany) was conducted to investigate the chemical interaction between HNTS and PEMA.
Furthermore; X-ray diffractometer (XRD- 6000, Shimadzu, Japan) was used to study crystal structures of nanoparticles.
Thermal Properties Tests
Ten disc specimens were prepared for each group:(A) control i.e., PEMA without HNTs, (B)experimental i.e., PEMA with 0.75% HNTs and (C)experimental i.e., PEMA with1%HNTs (Total: 30 specimens). The discs were with dimensions of 40 mm in diameter and 2.5 mm in thickness according to instrument’s specifications were prepared for thermal properties tests. For experimental specimens HNTs were weighed by a digital balance with accuracy of (0.0001g),then added into the liner monomer and dispersed by using probe sonication apparatus (Soniprep-150, England) for 3 minutes to break them into individual nanoparticles, then the mixture was cooled down by placing the container in a cooling bath.14 After that ,the powder of the soft lining material was added into proportion of (Powder/Liquid ratio: for each 1.2g of powder/1ml of liquid monomer )and then mixed, packed and cured according to manufacturer’s instructions.
Later after complete curing, all the specimens were finished, polished and immersed in distilled water and kept in the incubator at 37°C for (48) hours before testing. The specimen’s thermal conductivity and diffusivity were measured with the hot disk thermal constant analyzer (Tps-500, Kiteley, Sweden) (Figure 1), which consist of an electrically conducting pattern in the shape of double spiral extend out of a thin sheet of Nickel foil that was chosen because of its high and well known temperature coefficient of resistivity.
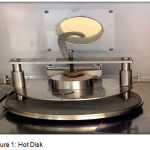 |
Figure 1: Hot Disk
|
The equipment connected to computer that are programmed for the test and the hot disk must be turned on about 1 hour prior to making experiment, then the studied specimens will be placed between stainless steel sample on the sensor of the hot disk after chosen the parameter for polymer, later the reading could be taken from the computer after 15 minutes which had the thermal conductivity and thermal diffusivity.6
Shear Bond Strength Test
Thirty acrylic blocks with specified dimensions (75mm × 25mm × 5 mm length, width, depth respectively) with stopper of depth about 3mm were made to evaluate shear bond strength test, then according to manufacturer’s instructions heat cured acrylic resin (Acrosun, Turkey) blocks were made.15
After that each specimen of shear bond test was consisting of two blocks of acrylic base set over each other forming a space between them measured (25mm × 25mm × 3mm length, width, depth respectively) to be filled with wax ..Then the whole specimen was invested into silicone material inside a custom fabricated metal flask to fabricate a mold for final specimen curing .Wax elimination procedure was done and the empty space was filled with proper amount of soft liner material, then curing was carried out according to manufacturer’s instructions.16
Ten specimens were made for each group as previously mentioned in thermal properties test. Then by using instron testing machine (WDW-20, Laryee Technology Co., Ltd., China) the specimens were tested and the maximum load required for failure was recorded to count up the value of bond strength for each specimen according to the formula:
Shear Bond strength(N/mm2) =F/A17..
Where:
F=is the maximum load at failure (N)
A= is the cross section area of the sample (mm2).
Tear Strength Test
According to (ASTM specification D-624, 2013),thirty specimens for tear strength test were fabricated with dimension illustrated in the (Figure 2).
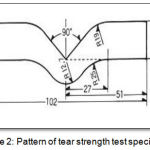 |
Figure 2: Pattern of tear strength test specimens.
|
The test method measures the force per unit thickness required to initiate a tear using Instron universal testing machine (WDW-20, Laryee Technology Co., Ltd., China).
The following equation was used to determine the tear strength:
Tear strength =F/d.18
Where:
F is the maximum force required to break the sample (N)
d is the median thickness of each sample (mm).
Surface Roughness Test
Thirty specimens with dimension of (65mm x 10 mm x 2.5 mm) were prepared to be used for surface roughness test. All specimens were immersed in distilled water at 37°C for 48 hours before being tested. The profilometer device (Time3200/TR200, China) was used to study the effect of halloysite Nano tubes reinforcement into soft liner on the surface roughness of the specimens, three measurements were done for each sample and the average value was calculated.6,19
Statistical Analysis
SPSS (statistical package for social science) computer software (version 21) was used for analyzing the results of the study, descriptive statistic and inferential statistics were employed. Also, One-way ANOVA (analysis of variance)test was performed, “P” value of > 0.05 was considered statically a non-significant,≤ 0.05 was considered a significant and ≤ 0.01 was considered as a highly significant.
Results
FTIR Analysis
FTIR results showed that there was no chemical reaction between acrylic soft-liner powder and HNTs powder as shown in (Figure 3).
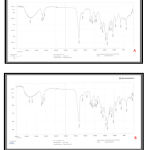 |
Figure 3: FTIR of (A) soft liner without addition and (B) soft liner with addition of 0.75%HNTs.
|
XRD Analysis
XRD patterns of halloysite nanotubes nanoclay(HNTs) and Acrylic-based resilient liners before and after addition of 0.75% and 1% of HNTs nanoclay are shown in (Figure 4).
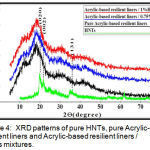 |
Figure 4: XRD patterns of pure HNTs, pure Acrylic-base resilient liners and Acrylic-based resilient liners / HNTs mixtures.
|
SEM Examination
The morphology of samples in cross-section and mapping of samples with PEMA soft liner before and after addition of HNTs nanoclay are investigated (Figure 5).
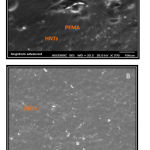 |
Figure 5: A SEM image of experimental specimen (0.75% HNTs-PEMA) at 100um and (B)SEM image of experimental specimen (1%HNTs-PEMA) at 300um.
|
Energy-Dispersive Spectroscopy(EDS)
It signalized the presence of ratio of elements in the liners before and after addition of 0.75% and 1% of HNTs nanoclay as shown in (figure 6,7).
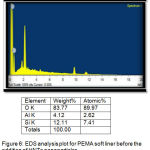 |
Figure 6: EDS analysis plot for PEMA soft liner before the addition of HNTs nanoparticles.
|
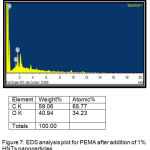 |
Figure 7: EDS analysis plot for PEMA after addition of 1% HNTs nanoparticles.
|
Thermal Conductivity Test
The experimental group (C) showed highest mean value (0.853 w/m.c) followed by the experimental group (B) with (0.732 w/m.c) mean value while the lowest mean value was for the control group (A) with (0.260 w/m.c) (Figure 8).
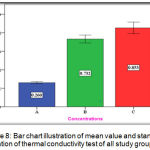 |
Figure 8: Bar chart illustration of mean value and standard deviation of thermal conductivity test of all study groups.
|
Descriptive statistics and One-way ANOVA for thermal conductivity test results showed a highly significant difference among all the tested groups, while to compare the significance of difference between two independent means, Dunnett’s T3 test was applied that presented a highly significant difference among all the tested groups as listed in table 1.
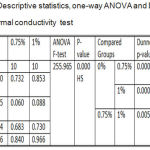 |
Table 1: Descriptive statistics, one-way ANOVA and Dunnett’s T3 of thermal conductivity test.
|
Thermal Diffusivity Test
The experimental group (C) showed highest mean value (0.277mm2/sec) followed by the experimental group (B) with (0.244 mm2/sec) mean value while the lowest mean value was for the control group (A) with (0.210 mm2/sec) (Figure 9).
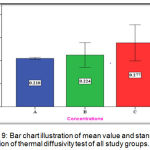 |
Figure 9: Bar chart illustration of mean value and standard deviation of thermal diffusivity test of all study groups.
|
Descriptive statistics and one-way ANOVA that shown in table 2 were noticed a non-significant difference among all the tested groups as shown in table 2.
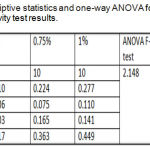 |
Table 2: Descriptive statistics and one-way ANOVA for thermal diffusivity test results.
|
Shear Bond Strength Test
The experimental group (C) showed the highest mean value (0.662 N/mm2) while both groups (A) and (B) have nearly the same mean value(0.561 N/mm2 ),(0.568 N/mm2 )respectively (Figure 10).
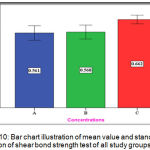 |
Figure 10: Bar chart illustration of mean value and standard deviation of shear bond strength test of all study groups.
|
One-way ANOVA for shear bond strength test results recorded a highly significant difference among all tested groups. The Tukey Honestly Significant Difference (Tukey HSD)test showed that there was a significant difference between the experimental groups, a non-significant difference between control and 0.75% tested groups and a highly significant difference between control and 1 % tested groups as shown in table 3.
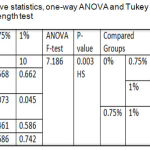 |
Table 3: Descriptive statistics, one-way ANOVA and Tukey HSD of shear bond strength test.
|
Tear Strength Test
The experimental group (C) showed the highest mean value (13.254 N/mm) followed by the experimental group (B) with (12.155 N/mm) mean value while the lowest mean value was for the control group (A) with (11.300 N/mm) (Figure 11).
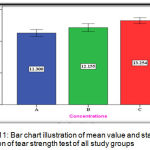 |
Figure 11: Bar chart illustration of mean value and standard deviation of tear strength test of all study groups.
|
One-way ANOVA illustrated a highly significant difference among the tested groups and Tukey HSD was also recorded a highly significant difference between the control group and 1% group and between both of the experimental groups, but a significant increase for 0.75% group compared to control group as displayed in table 4.
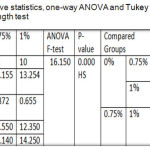 |
Table 4: Descriptive statistics, one-way ANOVA and Tukey HSD of Tear strength test.
|
Surface Roughness Test
The experimental group (C) showed the mean value of (1.314 µm) nearly the same for the experimental group (B) with (1.313µm) mean value and for the control group (A) with (1.311 µm) (Figure 12).
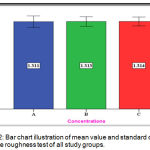 |
Figure 12: Bar chart illustration of mean value and standard deviation of surface roughness test of all study groups.
|
Descriptive statistics and One-way ANOVA for surface roughness test results were recorded a non-significant difference among all tested groups as shown in table 5.
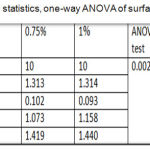 |
Table 5: Descriptive statistics, one-way ANOVA of surface roughness test.
|
Discussion
In this study an attempt was made to investigate the effect of incorporating HNTs into PEMA. The resin’s thermal and some mechanical properties were examined such as shear bond strength, tear strength and surface roughness.
Chemically, FTIR spectral could not reveal any chemical reaction between the soft liner and HNTs nanoparticles even the coordinated bonds which expected to occur between Alumina (Al2 O3) and Carbonyl ester were not happened because of Alumina in HNTs was saturated with other oxygen atoms.
XRD spectra of the polymers (including PMMA and PEMA) are amorphous in nature, whereas for HNTs are highly crystalline in nature .When HNTs added into PEMA , the characteristic peaks of the polymer have not been changed and this mean the matrix remained amorphous due to low content of nanofillers. Similar trend has also been observed in some previous work.20
The results of SEM images are clearly indicated that the halloysite nanotubes have a rolled tubular structure and had fair dispersion and little aggregation within the PEMA matrix.
EDS analysis of the control and the two experimental groups revealed that the main elements in the surface of the all groups were (O).However, both 0.75% and 1% groups showed a markedly increase in the oxygen percentages, as compared with control group, this increase in oxygen percentages occurred because the presence of –OH groups on the non-treated outer surface of HNTs (silica) that help to absorb water into the polymer matrix led to increase in oxygen percentage.
Thermal conductivity is the ability to determine the rate at which heat can be transmitted through a given cross sectional area of the specimens of material during a given time interval.21
A highly significant increase in the rates of thermal conductivity with the addition of HNTs into PEMA was occurred due to the overlapping of thermal conductive nanotubes inside the polymer matrix to bridge the insulating effect of PEMA matrix. Whenever the amount of fillers increase, the overlapping of thermal conductive particles will increase make the nanoparticles approximate from each other form pathway that permit transition of heat from one side of specimens to another side.6 This study coincide with Yadav etal.22
The improvement in the thermal conductivity also might be attributed to the thermal conductivity property of nanoclay containing silicon (Si), the type of nanoparticles filler and its distribution within the resin matrix.23
Thermal diffusivity is the rate at which a body with nonuniform temperature reaches equilibrium, it’s related to thermal conductivity.21 It’s the ability of a material to respond to transient temperature changes like those existing in the oral cavity during food and liquid intake.24
The results of this study showed that there was a non- significant increase in the value of thermal diffusivity with the increase in the percentage of HNTs nanoparticles compared to the control group. This might be interpreted by formation of thermally conducting pathway within the polymer matrix of PEMA from addition of the halloysite nanoparticles within the matrix .This come in agreement with Ellakwa et al. 200824 and Atla et al. 2013.25
The improved mechanical properties of the soft liner are always attributed to the halloysite nanotube loading, dispersion, and interfacial interactions in the systems. This is related to the fact that the external load is efficiently transferred from the polymer matrix to the HNTs.26
The statistical analysis showed that there was a non-significant change in the shear bond strength of adding 0.75% of HNTs into soft liner, this could be attributed to the chemical bonding between denture base material and soft liner which both of them have the same compatibility and high degree of similarity in chemical structure.16
While the highly significant increase by adding 1% concentration of HNTs into soft lining materials interpreted to the supramolecular bonds of the van der Waals forces and hydrogen bonds which will increase both the stiffness and the shear strength and decrease the critical length required for load transfer, which will contribute to the energy dissipation.27
As the silica particles on the outer surface of HNTs have the ability to form hydrogen bonds between its surface hydroxyl group and the oxygen in the polymer chain, this will increase resistance of the polymer chains for rupturing when faced tearing forces due to high shear strength between the nano filler and the polymer chains and this might explain the highly significant increase in tear strength in this study.28,29
The situ polymerization techniques, hydrogen bonds between the HNTs and the polymer matrix, as well as the high aspect ratio of HNTs and their nanoscale dimensions with low load into high polar PEMA polymer, all these led to 2D homogenization of the nano fillers in polymer matrix that means increase overall stiffness of the polymer and increase its resistance to tearing.26,30
The results of surface roughness of this study were not significantly increased with the addition of HNTs .When small percentages of Halloysite nanotubes were added to acrylic resin soft liner only ,few particles will be involved with the surface of the specimen which didn’t effect on the surface roughness as the surface roughness test is concerned with outer surface and not with inner surface of composite ,this also happened because HNTs have very small size and well dispersion within the matrix.6,31
Conclusions
The incorporation of HNTs powder into acrylic soft lining material results in a statistically highly significant improvement of thermal conductivity. Also, this incorporation improves both shear bond strength and tear strength while a non-significant effect on the surface roughness and thermal diffusivity was observed.
Acknowledgments
Authors wish to thank the dean as well as the assistant dean for scientific affairs of the college of dentistry, university of Baghdad for their kind support in facilitating using the available resources and materials to accomplish this work.
Refrences
- Hashem M. I. Advances in soft denture liners: An update. J Contemp Dent Pract. 2015;16(4):314-8.
CrossRef - Kotwal M., Sharma A.,Singh R. Evaluation of hardness of silicone and acrylic resin based resilient denture liners over a period of storage in water. IJSR. 2018;7(2):18-20.
- Akay C., Taniş M.Ç., Sevim H. Effect of artificial saliva with different pH levels on the cytotoxicity of soft denture lining materials. IJAO. 2017;40(10):581-8.
CrossRef - Iwasaki N., Yamaki C., Takahashi H., Oki M., Suzuki T. Effect of long-time immersion of soft denture liners in water on viscoelastic properties. Dental materials journal. 2017;36(5):584-9.
CrossRef - Farzin M., Bahrani F., Adelpour E. Comparison of the Effect of two Denture Cleansers on Tensile bond Strength of a Denture Liner. Journal of Dentistry. 2013;14(3):130-135.
- Jasim B. S. The effect of silanized alumina nano-fillers addition on some physical and mechanical properties of heat cured polymethyl methacrylate denture base material .M.Sc. Thesis, college of dentistry, university of Baghdad. 2013 .
- Messersmith P. B.,Obrez A., Lindberg S. New acrylic resin composite with improved thermal diffusivity. JPD. 1998;79(3):278-84.
CrossRef - Hatamleh M. M., Maryan C. J., Silikas N., Watts D. C. Effect of net fiber reinforcement surface treatment on soft denture liner retention and longevity. Journal of Prosthodontics Implant Esthetic and Reconstructive Dentistry. 2010;19(4):258-62.
CrossRef - Pasbakhsh P., Churchman J., Keeling J. L. Character is ation of properties of various halloy sites relevant to their use as nanotubes and micro fibre fillers. Applied Clay Science. 2013;74:47-57.
CrossRef - Abdullayev E., Lvov Y. Halloysite clay nanotubes for controlled release of protective agents. JNN. 2011;11(11):10007-26.
CrossRef - Peña-Parás L., Sánchez-Fernández J. A., Vidaltamayo R. Nanoclays for Biomedical Applications. In: Martínez L. M. T. et al. Handbook of Ecomaterials. Springer International Publishing AG 2018.Available at https://doi.org/10.1007/978-3-319-48281-1_50-1.
CrossRef - Yuan P., Southon P. D., Liu Z., Green M. E., Hook J. M., Antill S. J., et al. Function alization of halloy site clay nano tubes by grafting with γ-aminopropyltriethoxysilane. Phys. Chem. C. 2008;112(40):15742-51.
- Massaro M., Lazzara G., Milioto S., Noto R., Riela S. Covalently modified halloysite clay nanotubes synthesis properties biological and medical applications. Journal of Materials Chemistry B. 2017;5(16):2867-82.
CrossRef - National Institute of Standards and Technology. Material Measurement Laboratory. Preparation of Nanoparticle Dispersions from Powdered Material Using Ultrasonic Disruption. Special Publication 1200-2 Available at. 2012. http://dx.doi.org/10.6028/NIST.SP.1200-2 .
CrossRef - Mohammed W. S., Salih Z., Fatihallah A. Comparing Shear Bond Strength Of Auto-polymerized Soft Lining Materials to Acrylic Denture Base Using Different Surface Treatment and Denture Base Materials. IDJ. 2016;38(1):6-11.
CrossRef - Abdulwahhab A. R., Jassim R. K. The Effect of Aloe vera Extract on Adherence of Candida albicans and Other Properties of Heat Cure Denture Soft Lining Material. IJSR. 2018;7(3):94-103.
- American society for testing and material, ASTM D, 638-m standard test method for tensile properties of plastics. Philadelphia. ANSI. 1986.
- ASTM D624-00. Standard Test Method for Tear Strength of Conventional Vulcanized Rubber and Thermoplastic Elastomers. ASTM International, West Conshohocken, PA, USA. 2012.
- Zamperini C. A., Machado A. L., Vergani C. E., Pavarina A. C., Giampaolo E. T., da Cruz N. Adherence in vitro of Candida albicans to plasma treated acrylic resin. Effect of plasma parameters surface roughness and salivary pellicle. Archives of oral biology. 2010;55(10):763-70.
CrossRef - Pal K. Effect of different nanofillers on mechanical and dynamic behavior of PMMA based nanocomposites . Commun. 2016;1:25-8.
CrossRef - John P. M., Sakaguchi R. L. Craig’s restorative dental materials. 13th ed. St. Louis: Mosby. 2012;63-64.
- Yadav P., Mittal R., Sood V. K., Garg R. Effect of Incorporation of Silane‐Treated Silver and Aluminum Microparticles on Strength and Thermal Conductivity of PMMA. Journal of Prosthodontics Implant, Esthetic and Reconstructive Dentistry. 2012;21(7):546-51.
CrossRef - Ghaffari T.,Barzegar A., Rad H. F., Moslehifard E. Effect of Nanoclay on Thermal Conductivity and Flexural Strength of Polymethyl Methacrylate Acrylic Resin. Journal of dentistry (Shiraz, Iran). 2016;17(2):121-7.
- Ellakwa A. E., Morsy M. A., El‐Sheikh A. Effect of Aluminum Oxide Addition on the Flexural Strength and Thermal Diffusivity of Heat‐Polymerized Acrylic Resin. JOP. 2008;17(6):439-44.
CrossRef - Atla J., Manne P., Gopinadh A., Sampath A., Muvva S. B., Kishore K., et al. The effect of Al2O3 addition on the thermal diffusivity of heat activated acrylic resin. Journal of clinical and diagnostic research JCDR. 2013;7(8):1797.
- Liu M., Jia Z., Jia D ,Zhou C. Recent advance in research on halloysite nanotubes-polymer nanocomposite. Progress in polymer science. 2014;39(8):1498-525.
CrossRef - Sun L., Gibson R. F., Gordaninejad F., Suhr J. Energy absorption capability of nano composites a review. Composites Science and Technology. 2009;69(14):2392-409.
CrossRef - Tukmachi M. M. Effect of nano silicon dioxide addition on some properties of heat vulcanized maxillofacial silicone elastomer. IOSR–JPBS. 2017;12(3):37-43.
CrossRef - Shakir D.A., Abdul-Ameer F. Effect of nano-titanium oxide addition on some mechanical properties of silicone elastomers for maxillo facial prostheses. JTUSCI. 2018;13(3):281-90
- Yuan P., Tan D., Annabi-Bergaya. Properties and applications of halloysite nanotubes: recent research advances and future prospects. Applied Clay Science. 2015;112:75-93.
CrossRef - Al-Hiloh S. A., Ismail I. J. A Study the Effect of Addition of Silanized Zirconium Oxide Nanoparticles on Some Properties of High-Impact Heat-Cured Acrylic Resin. JBCD. 2016;28(2):19-25.
CrossRef

