
Elaheh Aghabalaei khordehchi1, Ahmad Ayatollahi2 and Mohammad Reza Daliri3
1Biomedical Electric, Electrical Engineering Department, Iran University of Science and Technology, Tehran, Iran.
2Electrical Engineering Department, Iran University of Science and Technology, Tehran, Iran.
3Electrical Engineering Department, Iran University of Science and Technology, Tehran, Iran.
Corresponding Author E-mail: elaheh.aghabalaiee@gmail.com
DOI : https://dx.doi.org/10.13005/bpj/1486
Abstract
This paper proposes an innovative method for automatic detection of pulmonary nodules in Computed Tomography (CT) data and measurement of changes in the number and sizes of the detected nodules during the treatment session. In the presented method, two multi-slice CT images are first taken from the patient’s lung, each captured by a similar capturing device but at two different dates. The CT images are then analyzed and their pulmonary nodules are extracted using a novel framework based on Mathematical Morphology Filtering (MMF), Statistical Region Merging (SRM), and Support Vector Machines (SVM). The MMF step smoothes the image in order to increase its homogeneity as well as removing the noises and artifacts. The SRM algorithm segments each slice of the CT image. After connecting the boundaries of the segments in adjacent slices, three-dimensional objects are produced which are considered as nodule-candidates. These candidates are classified into nodules and non-nodules using a two-class SVM classifier. The extracted nodules in each image are then labeled and their characteristics (i.e. labels, locations, and sizes) are stored. Finally, after registering the image pair using an affine algorithm, the growth rates of the lung nodules are measured.
Keywords
Affine Algorithm; Computed Tomography; lung Nodules
Download this article as:| Copy the following to cite this article: khordehchi E. A, Ayatollahi A, Daliri M. R. Automatic Pulmonary Nodule Growth Measurement through CT Image Analysis based on Morphology Filtering and Statistical Region Merging. Biomed Pharmacol J 2018;11(3). |
| Copy the following to cite this URL: khordehchi E. A, Ayatollahi A, Daliri M. R. Automatic Pulmonary Nodule Growth Measurement through CT Image Analysis based on Morphology Filtering and Statistical Region Merging. Biomed Pharmacol J 2018;11(3). Available from: http://biomedpharmajournal.org/?p=22331 |
Introduction
Since lung cancer is the most deadly type of cancers, diagnosis of pulmonary nodules in their early stages of growth and monitoring the development of the nodules at different points in time usually lead to considerable increase in the treatment success rate. Unlike larger nodules which their inherent attributes can be often diagnosed by biopsy, smaller nodules are usually too tiny to be characterized using the biopsy.1 Therefore, the diagnosis of the small nodules (i.e. generally smaller than 30 mm in diameter) is often a more challenging goal. In such cases, characterizing the nodule through assessing its growth rate can be an alternative solution.2 To this end, the nodules should be first detected in lung images taken at successive dates from the same patient. The pulmonary nodule growth (or decrease) rate can then be measured by calculating the amount of change in the nodule sizes during the treatment session.
As a common choice for producing medical images, the CT technology is widely used in lung imaging applications.3 More specifically, computer-aided analysis of CT images is very beneficial in automatic detection of lung nodules.4 Most of the methods which deal with detection of nodules in the CT images are based on segmentation of the CT data. As an example, authors in5 utilized threshold-based region growing and then the connected component analysis as the segmentation step. Their work was successful in accurately determining the lung area even in cases in which the lungs contained abnormal objects such as tumors or pulmonary emboli. However, the method was not able to detect such objects, individually.5 In,6 circular features were used for training the support vector machine classifier in order to detect the lung nodules.
In,7 first derivative of Gaussian filters were computed along four cardinal directions and then an edge tracking method based on the Laplacian of Gaussian (LoG) operator was used in order to detect the boundaries of lung nodules. Authors in8 developed a threshold-based segmentation approach in which the thresholds used for removing the lung artery were set by an optimization technique. Authors in9 developed a robust approach based on level sets concept in order to provide an automatic segmentation of the lungs images. In,10 a segmentation method based on an innovative threshold-based region growing methodology (i.e. Pixon) was presented. In,11 a comprehensive evaluation of several edge detectors techniques and their efficiency in lung nodule detection applications in noisy environments was carried out. The context curve calculation was used in12 in order to segmentation and then classification of the lung CT images. In,13 two-dimensional wavelet transform of the images was used to determine the boundaries and segmentation of the lung. Benefiting from histogram analysis of the CT images in order to tuning the threshold and then through a connected component labeling technique, authors in14 proposed a segmentation method used for lung nodule detection. Authors in15 adapted the fuzzy connectedness image segmentation to develop a generic lung parenchyma extraction approach. Automatic detection of solitary lung nodules was proposed in.16 Their method was based on using quality threshold clustering as well as genetic algorithm and diversity index. In,17 lung nodules were detected by thresholding and then template matching, while in18 a three-level thresholding technique for detection of the pulmonary nodules were suggested. After extracting some geometric and intensity based features, the SVM classifier was applied in4,19 for distinguishing the lung nodules from the other normal tissues. In,20 genetic algorithm and statistical region merging was combined in order to segment the three dimensional images. Finally, a method based on artificial crawlers feature extraction and support vector machine classification was proposed in.21 In their method, directional textures were also utilized in order to extract the features and train the classifier.
Most of the above-mentioned methods dealt only with nodule detection applications. For monitoring the nodule growth rate in a given patient, the CT images taken at different dates should be fed into a registration step in order to reduce the effects of any change in the patient’s position as well as compensating other unwanted effects produced by respiration and heart beats.22 Without the registration step, the accuracy of the volume change measurement may decrease.
There are several rigid/non-rigid registration techniques which have been developed so far for CT-based applications.22 In,23 local structural features were used for registration of small nodules. Authors in24 applied a standard lung atlas for developing a rigid registration of lung CT images. In,25 three-dimensional intensity and morphology based registration methods were developed and novel models for volumetric growth characterization were proposed. Authors in1 presented a rigid registration technique used for monitoring the nodule growth rate. Their proposed rigid registration technique was followed by a segmentation step which was based on adaptive thresholding.
More recently in,26 a registration method has been proposed which its similarity metric is based on Autocorrelation of Local Structure (ALOST). Through an elastic image registration which is followed by several levels of lung segmentation, functional and texture feature extraction, and classification of the lung tissues, authors in 27 have proposed a method for identification of lung injuries. In,28 a rigid registration of CT has been proposed which is in 3D Radon space rather than the traditional spectral/spatial spaces. The method is based on sparse sampling of scanning projection. Since the lung CT images are usually filled with some non-linear deformations such as those produced by lung respiratory movements, using the non-rigid registration approaches are often more efficient.29
In this paper, we present a new framework for automatic detection of lung nodules from CT data and then measurement of volume changes in the nodules. In the proposed framework, it is believed that a precise nodule detection which is followed by a well-defined registration step usually results in an efficient monitoring of the nodule growth rate. Therefore, our main focus is on developing an accurate nodule detection technique in terms of detection accuracy and detection specificity. Since all the needed parameters have been predetermined according to a wide range of sample data, there is no need to manually tune their values during the proposed procedure. Therefore, it can be considered as an automatic approach. On the other hand, the complexity of the proposed method is also reasonable, since it is based on a relatively straight-forward scenario. Finally, benefiting from a well-defined smoothing step increases the robustness of the method against additive noises. The proposed nodule detection and nodule growth rate calculation methodologies are discussed in more details in the next section.
Proposed Method
The block-diagram of the proposed automatic nodule growth rate measurement framework is illustrated in Figure 1. As can be seen in this block-diagram, two consecutive CT images are captured from the lung of a patient, each at a different date denoted by date A and date B, respectively.
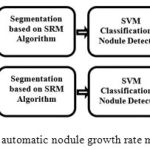 |
Figure 1: Block-diagram of the proposed automatic nodule growth rate measurement framework.
|
CT Data Smoothing using Morphological Filtering
As the first step of the proposed framework, we suggest applying a smoothing algorithm which is based on morphological filtering. Since using the morphological filtering leads to smoothed and noise-reduced images, it often increases the accuracy of the nodule detection algorithm. On the other hand, unlike most of the other denoising/smoothing techniques (e.g. median, mean and Gaussian filtering), the morphological filtering does not result in blurring the edges and boundaries or relocating them.30
Mathematical morphology filters have been commonly exploited in image processing.20,30,31 Four widely-used morphological operators comprise erosion, dilation, opening and closing. In the erosion process, the brighter objects in image will shrink, while the objects which are already darker than their neighboring areas will expand.30 On the contrary, the dilation makes the brighter objects larger while decreasing the size of the darker objects.30 The opening operator is made of an erosion operator followed by a dilation operator, while the closing is the composition of dilation followed by erosion. All the four above-mentioned operations utilize structuring elements (SE) in their calculations. The size and shape of SE define which objects in an image will be eliminated after applying the morphological operators and which objects will remain. As an example, after applying the dilation operator to a given region, the dark objects which are smaller than SE (or cannot contain it because of their shape) will be eliminated while the larger objects will remain mostly intact. Because of the importance of edges in CT images, we have used the geodesic versions of the morphological operators which are also called “morphological reconstruction.”hese operators are beneficial especially where preserving the edges and shapes of objects in images is an important goal. Such goal seems more important in CT images in which the objects are often small and closely located.
Figure 2 shows the results of applying the ‘opening by reconstruction’ morphological operator to one of the slices of the lung CT image, using a disk-shaped structural element which its radius is equal to 5.
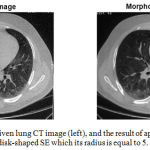 |
Figure 2: One slice of a given lung CT image (left), and the result of applying the morphological filtering which utilizes a disk-shaped SE which its radius is equal to 5.
|
SRM-Based Segmentation and 3D Object Extraction
SRM is a widely used method in image processing which converts an image palette with greater number of colors into an image palette with fewer colors. In this mapping, same colors are merged together.28 SRM is often considered as a fast and accurate algorithm for image segmentation.28 A SRM-based segmentation algorithm comprises both region growing and merging procedures. The algorithm assesses pixels within an area and merges them into a connected group of pixels based on an integration criteria. It is similar to creating a group of new generations within a population based on a certain criteria.
SRM can be regarded as a region growing and merging technique, since it first checks if two neighbouring pixels belong to the same segment and then merges the pixels if a pre-defined criteria is satisfied.20 To this end, a set of neighbouring pixel pairs are prepared. Using a sort function, the couples of pixels are then sorted in an ascending order using the following function, where p and p’ are a given pixel and its neighbor, respectively20:
![]()
After sorting the pixel pairs, in order to merge the pixels, the SRM segmentation criterion is used as:
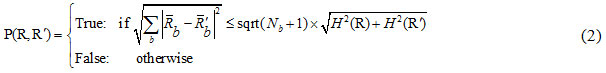
In which:
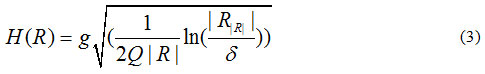
where is the maximum number of grey-levels in the input image (e.g. 256), R is a given segment, R is the mean value of the grey-levels in R, and δ = 1/6 xI2.
Moreover, parameter Q determines the amount of roughness and smoothness of segmentation. With higher values of Q, more segments are produced and vice versa.20 In other words, by increasing the value of the segmentation parameter, some newer segments may be produced. For very large values of Q, the number of segments is very high in such a way that for extremely large the number of extracted segments reach the number of all pixels which are located in the regions of interest. In order to achieve desired results and avoid over-segmentation and under-segmentation problems, the value of the parameter Q must be properly set. In the present study, this value is manually tuned after extensive sets of experiments. Therefore, we suggest setting this parameter to a fixed value (i.e. Q = 100) for all the lung CT datasets.
After applying the SRM segmentation algorithm to each slice of the multi-slice CT data, several segmentation maps are produced each containing a probably different (but often close) number of extracted objects. As a visual example, Figure 3 illustrates the segment maps resulted by applying the SRM algorithm to three continuous slices (i.e. 195th to 197th) of a given lung CT. As can be inferred from Figure 3, the extracted objects of the adjacent slices are located in relatively similar places, thus they can form three-dimensional (3D) volumes if they connect together.
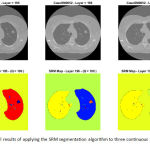 |
Figure 3: Visual results of applying the SRM segmentation algorithm to three continuous slices of a lung CT data.
|
Upper row: gray-level illustrations of the 195th, 196th, and 197th slices of the data; Lower row: segment maps corresponding to the slices, while Q = 100
In order to detect the nodules, the two-dimensional objects from adjacent slices must be first converted to three-dimensional objects. To this end, we propose to connect the boundaries of each extracted object from each slice to those of an object from adjacent slices, only if a criterion is met. To be more clear, if object Oa from slice bi intersects with object Ob in the adjacent slice bi+1 in at least ten pixels, all pixels placed on the boundary of the former object are connected to their corresponding pixels on the boundary of the latter object. This procedure results in several three-dimensional objects which are regarded as nodule candidates.
SVM-based Nodule Detection
After extracting the nodule candidates, the true nodules should be distinguished from the non-nodule objects. The non-nodule structures mainly belong to natural small tissues in the lungs or be caused by redundant details or artifacts which have not yet removed by the previous pre-processing step. We propose to apply the SVM classifier in order to distinguish the nodules from the other non-nodule contents. To this end, the SVM is first trained using some training images in which the features of the true nodules and non-nodules have been already extracted. In the testing step, the 3D nodule candidates are classified into two classes using the trained SVM classifier. In this article, the Gaussian kernel is used for the SVM classification and the parameters of the kernel have been tuned using a 5-fold cross-validation. The implementation of the SVM classifier is done through using the LIBSVM package.33 In our research, we use three widely-used features for the training and testing stages. These features are the average and standard deviation of the pixels’ gray-levels in each 3D object, as well as the volume of each 3D object. Our extensive sets of experiments show that using the three above-mentioned features usually results in accurate classification accuracies. In the process of calculating the 3D objects’ volumes, the area of each pixel as well as the distance between each two consecutive slices are considered as one unit. As an example, two pixels which each of them is placed in similar locations in two adjacent slices constitute a cube with unit volume. As a result, the volume of a given 3D object can be easily calculated by counting the number of cubes that are surrounded by the boundaries of that object.
Affine Registration
As described in the previous sections, the main goal of this paper is to automatically measure the amount of changes in sizes of the lung nodules extracted at two different dates. To this end, corresponding nodules in follow-up CT images should be aligned with respect to each other. Such alignment (which is done through transformation of one CT image taken in date B with regard to the other CT image captured in date A) is called as ‘registration’.22
Since the presented article deals with multi-slice CT images, we benefit from a 3D image registration approach which is based upon affine transformation. To this end, a recently-developed hybrid affine registration approach that combines two image registration steps is utilized, as suggested in.29 The first step of the used algorithm mainly models the motion of the whole body such as twisting, stretching and shifting, while the second step models the local motions in the organs.29 Quantitative and qualitative evaluation of the utilized affine registration algorithm as well as some other registration methods will be addressed in the next section.
Experimental Results
This section comprises the experimental results after applying the proposed automatic nodule detection method and nodule growth rate measurement approach to several standard lung CD images.
Datasets
In our experiments, the CT images are taken from four databases. The first set of CT images are from the ELCAP public lung dataset which has been produced by the Cornell University[1]. It contains 50 CT images of the chest which are commonly used to evaluate the performance of the computer-aided detection systems. Each of these low-dose CT images consists of about 260 slices and comprises single or multiple nodules. The spatial resolution of the images are mainly about mm. The second used database is a freely-available set of CT images and is called as ‘LIDC-IRDI’ (which stands for ‘Lung Image Database Consortium and the Image Database Resource Initiative’).34 The nodule characteristics are also available for this dataset, especially for nodules which their diameters are larger than 3 mm or smaller than 30 mm. In the experiments carried out in the present article, 800 CT images (out of total 1012 images) of this dataset have been used.
While the first and second datasets are utilized for nodule detection assessment, the third and fourth sets of CT lung images are specifically used for the main goal of our research that is nodule growth rate measurement. These two datasets comprise several sets of consecutive images captured from some patients in different dates. The images of the third set (hereafter, called as “ELCAP2”) are taken from the database of the Cornel University, while the fourth set (called as RIDER) contains lung CT images taken from The Cancer Imaging Archive (TCIA).34
Nodule Detection Assessment
In the next experiment, the proposed framework is evaluated in term of nodule detection accuracy. To this end, 50 and 800 lung CT images are first selected from the ELCAP and LIDC-IRDI datasets, respectively. The images of each dataset are then divided into two groups: the train group (used for training the SVM classifier) and the test group (used for the testing step). In this paper, 20% of images in each database are randomly selected for training the classifier, while the remaining 80% are used for the testing step.
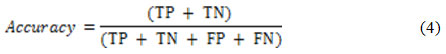
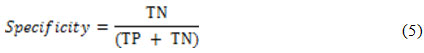
Two well-known criteria )i.e. detection accuracy and specificity) are used for nodule detection assessment, as suggested in.6 These criteria are functions of some simpler metrics such as True Positive (TP), False Positive (FP), False Negative (FN) and True Negative (TN).35 The TP (TN) is the percentage of true nodules (true non-nodules) which have been correctly classified as nodules (non-nodules). Moreover, the FP (FN) is the percentage of true non-nodules (true nodules) which have been incorrectly classified as nodules (non-nodules). The detection accuracy is defined as21:
while the detection specificity is given as21:
In order to ensure a fair evaluation of the proposed method, the abovementioned selection is permuted three times for the LIDC-IRDI case and the obtained results are averaged and reported in Table1.
Table 1: Nodule detection performance assessment of the proposed method as well as other competing methods when applied to three datasets (i.e. the ELCAP dataset, LIDC-IRDI dataset, and a proprietary dataset).
| Nodule Detection Methods | Database | Number of used CT Images | Specificity % | Accuracy % |
| Proposed Method | ELCAP | 50 | 87.5% | 92.5% |
| LIDC-IRDI | 800 | 95.1% | 95.3% | |
| Template Matching & Neural Classifier [17] | LIDC-IRDI | 800 | 84.5% | 85.6% |
| Hybrid Features Based Method [19] | LIDC-IRDI | 800 | 90.1% | 91.3% |
| Level-Set Method [9] | LIDC-IRDI | 800 | 84.8% | 85.9% |
| GA-SRM Method [20] | LIDC-IRDI | 800 | 92.3% | 92.7% |
| Pixon-based Method [10] | LIDC-IRDI | 800 | 80.4% | 81.2% |
| ELCAP | 50 | 60% | 67.5% | |
| context curve calculation [12] | ELCAP | 50 | NA | 82.5% |
| circular features based method [6] | Non-Standard | 50 | 62.5% | 75% |
| Threshold Clustering and GA [16] | LIDC-IRDI | 833 | 97.6% | 97.7% |
| crawlers feature extraction and SVM [6] | LIDC-IRDI | 833 | 94.3% | 94.5% |
In terms of nodule detection accuracy and specificity, quantitative assessments of the proposed approach show a considerable performance. As some examples, the detection accuracy of the proposed method is about 92.5% when applied to fifty CT images of the ELCAP dataset and is near to 95.3% while applied to 800 CT images of the LIDC-IRDI dataset. Along with the proposed method, Table 1 contains the results of applying nine other nodule detection methods to similar datasets. The competing methods are based on Pixon-based segmentation,10 template matching and neural classifier,17 hybrid features,19 Level-Set method,9 a method based on genetic algorithm (GA) and SRM,20 context curve calculation,12 circular features based method,6 a method based on threshold clustering and GA16 and a method based on artificial crawlers feature extraction and SVM.21 Among the competing methods, the first five methods have been implemented again by the authors of the present article on the new dataset(s), but under similar circumstances and conditions. The results of the other four methods have been taken from the literature.
As can be inferred from Table 1, the proposed approach outperforms the other competing methods except the method which is based on threshold clustering and genetic algorithm.16 The method based on the crawlers features and SVM36 is the third ranked as well. For the methods proposed in16 and, 21 this ratio is 97.6% and 94.3 % for LIDC-IRDI case, respectively. Among the competing methods, the traditional Pixon-based approach ([10]) shows the least detection accuracy.
From the computational point of view, the proposed approach possesses the second rank after the Pixon-based method ([10]), while most of the competing methods are implemented in Matlab2015 utilizing an Intel CPU with 3.20 GHz and 4 GB of ram. Using the mentioned hardware, the proposed approach averagely needs about 9.3 seconds to be applied to each slice of the CT image. The 3D object creation and the final classification also take less than two seconds to run. As the fastest technique among the competing methodologies, the Pixon-based schema ([10]) only needs about 8 seconds to segment each slice. On the other hand, the method proposed in20 is the most time consuming one among the competing methods since it benefits from the genetic algorithm which is naturally time consuming.
Nodule Growth Rate Measurement
In our second series of experiments, the main goal of this paper that is automatic measurement of the growth rates of nodules is addressed. Upper row of Figure 4 shows one of the slices of a lung CT image that contains a single nodule which its location is shown by a squared box. This image was captured in January 2000 and stored in the database of the Cornel University. The selected square-shaped area is then magnified and shown for some of the other slices of this CT image (lower row of Figure 4).
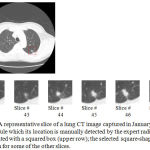 |
Figure 4: A representative slice of a lung CT image captured in January 2000, comprising a single nodule which its location is manually detected by the expert radiologists and demonstrated with a squared box (upper row); the selected square-shaped area is magnified and shown for some of the other slices.
|
According to what estimated by the expert radiologists, the size of this nodule is around 2300 mm3. On the other hand, applying the proposed automatic nodule detection approach to the same CT image results in detecting a nodule which its volume is 2185 mm3. In other words, there is approximately a five percent difference between the volume of the nodule extracted by our proposed method and the one estimated by the expert radiologists.
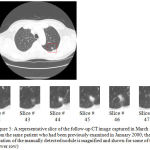 |
Figure 5: A representative slice of the follow-up CT image captured in March 2000 (upper slice) from the same patient who had been previously examined in January 2000; the approximate location of the manually detected nodule is magnified and shown for some of the other slices (lower row).
|
Figure 5 shows a follow-up version of the CT image previously depicted in Figure 4. The newer version of the lung CT image has been taken from the lung of the same patient but in a different date (i.e. in March 2000). Similar to the previous case, the selected square-shaped area is the estimated location of the nodule. This area is magnified and demonstrated for some of the other slices of the follow-up CT image as well (lower row of Figure 5). After manually detecting the single nodule in each slice of the image, the radiologists have estimated the size of the nodule to be around 2140 mm3 which show a 150 mm3 decrease when compared to the manually extracted nodule from the first image. After calculating the size of the nodule detected by the proposed approach, the result is around 2073 mm3 which shows a small difference of 3 % with the results of the manually nodule detection approach.
Results of applying the hybrid affine registration29 to the 44th slices of two lung CT images taken from the dataset of the Cornell University are reported in Figure 6. Each of the two CT images has been captured at a different date, but from the same patient. Figure 6-a provides a visualization of the differences between the two images, before the registration step. In this figure, the colored areas show those regions in the two consecutive images where the intensities of pixels are different. As can be seen in Figure 6-a, the first captured image and its follow-up version are not aligned well, therefore, they should be registered using a registration technique. Figure 6-(b) visualizes the differences between the first captured image and the registered version of the follow-up image. As can be seen in this figure, the registered version of the second image is more aligned with the first image. The alignment level is more obvious around the important areas and tissues such as the detected nodule.
Quantitative assessments also lead us to similar outcomes. The Mean Square Error (MSE) value between the unregistered follow-up image and the first image is 5114, while this value is equal to 1778 between the registered follow-up image and the first one. In other words, the MSE value between the registered image and the reference CT image is much lower than that of between the second CT image (i.e. unregistered yet) and the reference image.
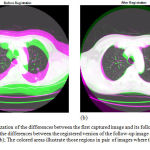 |
Figure 6: Visualization of the differences between the first captured image and its follow-up version (a); Visualization of the differences between the registered version of the follow-up image and the first captured image (b); The colored areas illustrate those regions in pair of images where the gray-levels are different.
|
Figure 7 illustrates the edges of the nodules extracted from the 44th slices of the first image as well as the registered version of the follow-up image. The nodule areas are magnified and their edges are colored in red. As can be inferred from this figure, the size of the nodule has been reduced during the treatment session, at least in this slice of the CT data. Moreover, similar results can be also seen while evaluating the other slices of the CT image.
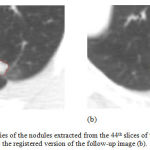 |
Figure 7: The boundaries of the nodules extracted from the 44th slices of the first image (a) and the registered version of the follow-up image (b).
|
The previous examples dealt with CT images with single nodule. As an example of a multiple-nodule (metastatic) case, Figure 8-a and Figure 8-c show a representative slice of a CT image data taken from a patient in October 1999 and February 2000, respectively. Two different nodules can be seen in each image. Figure 8-b and Figure 8-d provide a better visualization of the nodules. The location of each nodule has been manually extracted by expert clinical radiologists and colored in red.
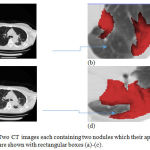 |
Figure 8: Two CT images each containing two nodules which their approximate locations are shown with rectangular boxes (a)-(c).
|
The images have been taken from the same patient in October 1999 and April 2000, respectively; Magnified versions of the rectangular boxes in which the nodules are colored with red color (b)-(d).
After applying the proposed automatic nodule detection approach as well as the affine registration method to the two consecutive CT images, the gained results show that the volumes of the two nodules have been increased during the interval between the two dates. To be clearer, the sizes have varied from 8345 mm3 and 18023 mm3 to 21778 mm3 and 22170 mm3, respectively. The manual assessment of the clinical experts also yield a relatively similar outcome.
In order to provide a more quantitative assessment of the proposed nodule growth rate measurement method, Table 2 is drawn. In this experiment, the lung CT images have been chosen from the RIDER database which can be accessed from the cancer imaging archive or TCIA. The number, location and size of the nodules have been manually calculated by three expert radiologists and are freely available for this database. Figure 9 illustrates three sample CT images randomly chosen from this database. The locations of the nodules have been also shown by yellow arrows.
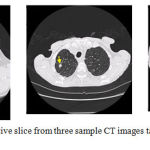 |
Figure 9: One representative slice from three sample CT images taken from the RIDER database.
|
The characteristics of the nodules have been manually calculated by clinical experts and are available for further assessments.
Two sets of CT images (which have been captured from a unique patient) are randomly selected from the RIDER database. Each set comprises 10 different CT images. Furthermore, each of the two sets has been captured at a different date. For each pair of the CT images, the level of the nodule growth rate has been calculated using the proposed automated framework. Along the results gained by applying the proposed method, the average values of the manually-calculated growth rates are also reported as references. As can be inferred from the table, the results of the proposed automated method shows a meaningful correlation with what manually calculated by the three expert radiologists. To be clearer, for all the 10 CT images, the proposed method is able to correctly determine that the nodule volume has been decreased or increased. However, the volume measurement results show a 5 % difference between what automatically calculated by the proposed computer-aided method and the average of the volumes which have been manually calculated by the three experts.
Table 2: Comparing the amounts of nodule volumes which are automatically calculated by the proposed method with the average amounts of the volumes which are manually calculated by three radiologists, in 10 lung CT data randomly chosen from RIDER database.
| CT Data Index | Results of Applying the Proposed Method | Averaged Values of what Manually Calculated by the Three Expert Radiologists | ||
| Nodule Volume Calculated in Date # 1 (in terms of mm3) | Nodule Volume Calculated in Date # 2 (in terms of mm3) | Nodule Volume Calculated in Date # 1 (in terms of mm3) | Nodule Volume Calculated in Date # 2 (in terms of mm3) | |
| 1 | 3002 | 3164 | 2765 | 2920 |
| 2 | 4931 | 5004 | 4890 | 4920 |
| 3 | 58214 | 63209 | 56763 | 62331 |
| 4 | 10524 | 11223 | 12339 | 13402 |
| 5 | 4654 | 5198 | 4590 | 5060 |
| 6 | 7088 | 5345 | 6980 | 5205 |
| 7 | 1290 | 2790 | 1243 | 2646 |
| 8 | 2779 | 2635 | 2734 | 2540 |
| 9 | 14056 | 15011 | 13504 | 13902 |
| 10 | 25021 | 32146 | 22344 | 30243 |
Conclusion
Pulmonary nodules can be considered as three-dimensional objects in lung CT images which their densities are often higher compared to other regions in the lung area. Since even a small pulmonary nodule may be a sign of lung cancer, detection of such nodules in their early stages of growth and consequently monitoring their growth rate during the treatment session are very useful in cancer therapy. The present article deals with detection of nodules from a pair of CT images each taken in a different date. Amount of changes in sizes of the detected nodules from the time-separated images are then measured and evaluated. To this end, a pair of consecutive CT images are captured from the lung of a patient, each at a different date denoted by date A and date B, respectively. The morphology-based smoothing algorithm is then applied to each image as a pre-processing step. The smoothed CT images are then segmented using the SRM algorithm and the nodule candidates are extracted as 3D objects. Using SVM, the true nodules are then separated from false nodules for each image. The image taken at date B is then aligned with respect to the first image taken at date A, using an affine registration technique. Finally, differences in the volumes of the pairs of corresponding nodules are calculated. The results achieved by the proposed nodule growth rate measurement method prove its considerable efficiency in dealing with various lung CT datasets.
References
- Reeves A. P., Chan A. B. , Yankelevitz D. F., Henschke C. I. , Kressler B and Kostis W. J. On measuring the change in size of pulmonary nodules. IEEE transactions on medical imaging. 2006;25(4):435-450.
CrossRef - Yankelevitz D. F., Reeves A. P., Kostis W. J., Zhao B and Henschke C. I. Small pulmonary nodules: volumetrically determined growth rates based on CT evaluation. radiology. 2000;217(1):251-256.
CrossRef - El-Baz et al., A. Computer-aided diagnosis systems for lung cancer: challenges and methodologies. International journal of biomedical imaging. 2013;2013.
- Pulagam A. R., krıshnarao V.E., and de Inampudi R. B. Automated Pulmonary Lung Nodule Detection Using an Optimal Manifold Statistical Based Feature Descriptor and SVM Classifier. Biomedical and Pharmacology Journal. 2017;10(3):1311-1324.
CrossRef - Yim Y. , Hong H and Shin Y. G. Hybrid lung segmentation in chest CT images for computer-aided diagnosis. in Enterprise networking and Computing in Healthcare Industry, 2005. HEALTHCOM 2005. Proceedings of 7th International Workshop on. 2005;378-383. IEEE.
- Mousa W. A and Khan M. A. Lung nodule classification utilizing support vector machines. in Image Processing. 2002. Proceedings. International Conference on. 2002;2002:3. III-III: IEEE.
- Campadelli P., Casiraghi E and Artioli D. A fully automated method for lung nodule detection from postero-anterior chest radiographs. IEEE transactions on medical imaging. 2006;25(12):1588-1603.
CrossRef - Gao Q., Wang S., Zhao D and Liu J. Accurate lung segmentation for X-ray CT images, in Natural Computation, 2007. ICNC 2007. Third International Conference on. 2007;2:275-279. IEEE.
- Silveira M., Nascimento J and Marques J. Automatic segmentation of the lungs using robust level sets. in Engineering in Medicine and Biology Society, 2007. EMBS 2007. 29th Annual International Conference of the IEEE. 2007;4414-4417. IEEE.
- Hassanpour H., Yousefian H and Zehtabian A. Pixon-based image segmentation, in Image segmentation: InTech. 2011.
- Kishore V. V and Satyanarayana R. Performance evaluation of edge detectors-morphology based ROI segmentation and nodule detection from DICOM lung images in the noisy environment, in Advance Computing Conference (IACC). 2013 IEEE 3rd International. 2013;1131-1137. IEEE.
- Zhang F., Song Y., Cai W., Zhou Y. , Shan S and Feng D. Context curves for classification of lung nodule images,” in Digital Image Computing. Techniques and Applications (DICTA), 2013 International Conference on. 2013;1-7. ieee.
- Korfiatis P., Skiadopoulos S., Sakellaropoulos P. , Kalogeropoulou C and Costaridou L. Combining 2D wavelet edge highlighting and 3D thresholding for lung segmentation in thin-slice CT. The British journal of radiology. 2007;80(960):996-1004.
CrossRef - Wei J and Li G. Automated lung segmentation and image quality assessment for clinical 3-D/4-D-computed tomography. IEEE journal of translational engineering in health and medicine. 2014;2:1-10.
CrossRef - Mansoor A., et al., A generic approach to pathological lung segmentation. IEEE transactions on medical imaging. 2014;33(12): 2293-2310.
CrossRef - de Carvalho A. O., Filho W. B., de Sampaio A. C., Silva A. C., de Paiva R. A. N and Gattass M. Automatic detection of solitary lung nodules using quality threshold clustering, genetic algorithm and diversity index. Artificial intelligence in medicine. 2014;60(3):165-177.
CrossRef - Hasanabadi H., Zabihi M and Mirsharif Q. Detection of pulmonary nodules in CT images using template matching and neural classifier. Journal of Advances in Computer Research. 2014;5(1):19-28.
- John J and Mini M. Multilevel Thresholding Based Segmentation and Feature Extraction for Pulmonary Nodule Detection. Procedia Technology. 2016;24:957-963.
CrossRef - Akram S., Javed M. Y., Akram M. U. , Qamar U and Hassan A. Pulmonary nodules detection and classification using hybrid features from computerized tomographic images. Journal of Medical Imaging and Health Informatics. 2016;6(1):252-259.
CrossRef - Zehtabian A and Ghassemian H. Combining Genetic Algorithm with PDEs for Improving the Performance of Statistical Region Merging Based Object Extraction. Journal of the Indian Society of Remote Sensing. 2016;44(3):395-407.
CrossRef - Froz B. R., de Carvalho A. O., Filho A. C.,Silva A. C., de Paiva R. A. N and Gattass M. Lung nodule classification using artificial crawlers, directional texture and support vector machine. Expert Systems with Applications. 2017;69:176-188.
CrossRef - El-Baz A., Gimel’farb G. , Falk R., Heredia D and El-Ghar M. A. A novel approach for accurate estimation of the growth rate of the detected lung nodules. in Proceedings of the 1st International Workshop on Pulmonary Image Analysis. 2008;33-42.
- Brown M. S. et al., Method for segmenting chest CT image data using an anatomical model: preliminary results. IEEE transactions on medical imaging. 1997;16(6):828-839.
CrossRef - Zhang L and Reinhardt J. 3D pulmonary CT image registration with a standard lung atlas. in Proc. SPIE Conf. Medical Imaging. 2000;4322: 67-77.
- Kostis W. J.,Reeves A. P. , Yankelevitz D. F and Henschke C. I. Three-dimensional segmentation and growth-rate estimation of small pulmonary nodules in helical CT images. IEEE transactions on medical imaging. 2003;22(10):1259-1274.
CrossRef - Li Z., Mahapatra D., Tielbeek J. A., Stoker J., van Vliet L. J and Vos F. M. Image registration based on autocorrelation of local structure. IEEE transactions on medical imaging. 2016;35(1):63-75.
CrossRef - Soliman A., et al., Image-based CAD system for accurate identification of lung injury in. Image Processing (ICIP), 2016 IEEE International Conference on. 2016;121-125. IEEE.
- Medan G., Shamul N and Joskowicz L. Sparse 3D Radon Space Rigid Registration of CT Scans: Method and Validation Study. IEEE transactions on medical imaging. 2017;36(2):497-506.
CrossRef - Liang R., Zhang J. X and Wang R. F. A hybrid 3D image registration of lung CT images for respiration. in Control Conference (CCC), 2016 35th Chinese. 2016;4182-4187. IEEE.
- Soille P. Morphological image analysis: principles and applications. Springer Science & Business Media. 2013.
- Nock R and Nielsen F. Statistical region merging. IEEE Transactions on pattern analysis and machine intelligence. 2004;26(11):1452-1458.
CrossRef - Crespo J., Serra J and Schafer R. W. Theoretical aspects of morphological filters by reconstruction. Signal processing. 1995;47(2):201-225.
CrossRef - Chang C. C and Lin C. J. LIBSVM: a library for support vector machines. ACM transactions on intelligent systems and technology (TIST). 2011;2(3):27.
CrossRef - Armato S. G., et al., The lung image database consortium (LIDC) and image database resource initiative (IDRI): a completed reference database of lung nodules on CT scans. Medical physics. 2011;38(2):915-931.
CrossRef - Lo S. C., Lou S. L., Lin J. S., Freedman M. T., Chien M. V and Mun S. K. Artificial convolution neural network techniques and applications for lung nodule detection. IEEE Transactions on Medical Imaging. 1995;14(4):711-718.
CrossRef - Khordehchi E. A., Ayatollahi A and Daliri M. R. Automatic Lung Nodule Detection Based on Statistical Region Merging and Support Vector Machines. Image Analysis & Stereology. 2017;36(2):65-78.
CrossRef

