
Huda A. Qari1,2
1Center of Excellence in Environmental Studies, King Abdul-Aziz University, P. O. Box 80200, Jeddah 21589, Saudi Arabia.
2Department of Biology, Faculty of Science, King Abdul-Aziz University, Jeddah, Saudi Arabia.
Corresponding Author E-mail: dr_hudaqari@hotmail.co.uk
DOI : https://dx.doi.org/10.13005/bpj/1510
Abstract
The objective of the study is to measure the defined water qualities of the well waters from Taif regions, KSA. Quality analysis of is needed to provide necessary data regarding the sources of pollution and pointers for health protection. Physiochemical and microbiological qualities of the samples from 11 distinguished wells were fastidiously evaluated. The observed pH (7.5 to 8.2) of the collected samples are lies underneath counseled standards. Distribution of the 15 chemical elements in the samples were determined. Among all the principle elements of soil ‘cations' are higher in the T2 samples like sodium(Na) (531 mg /l), calcium(Ca) (252 mg/l) and lead(Pb) (0.11 mg/l). Almost all the samples are contaminated with potassium (K) and phosphorus (P). The observed concentration are ranged between (0.259 to 9.23 mg/l) and (0.062 to 0.43 mg/l) respectively. The highest concentration of potassium was observed in T3 and T17. Samples from the wells which is nearby agriculture lands are highly contaminated than the other wells. The pathogenic indicators were detected in many samples in that (T1,T17,T23,) as of fecal contamination. Continuous assessment of water quality on the routine basis is needed to maintain the well water quality as well as to eliminate health issues.
Keywords
Heavy Metals Analysis; Microbial Pathogens; Saudi Arabia; Well Water
Download this article as:| Copy the following to cite this article: Qari H. A. Microbial Pathogens and Heavy Metal Contaminations in the open Wells Water in Taif Region, Saudi Arabia. Biomed Pharmacol J 2018;11(3). |
| Copy the following to cite this URL: Qari H. A. Microbial Pathogens and Heavy Metal Contaminations in the open Wells Water in Taif Region, Saudi Arabia. Biomed Pharmacol J 2018;11(3). Available from: http://biomedpharmajournal.org/?p=22282 |
Introduction
Water resource encompasses a unique place among all the natural resources is that the most generally distributed substance on our planet. Water plays a vital role in each environmental and human life (Bing Chen 2016, Olabisi Orebiyi 2008). We continually consumed water from numerous water bodies. Generally, Kingdom of Saudi Arabia (KSA) is one of the countries with the lowest rainfall information is sort of nothing. In Taief, it is highly depend on groundwater for the water consumption (Loni et al. 2015). Poor water quality causes the 80% of human illness and it conjointly to blame for transmission of infectious diseases (Ashbolt 2004). Even though KSA is not facing such a serious issues with drinking water qualities as other parts of the world, there are still water quality problems (Moghazi 1999, Zaidi et al. 2016). Groundwater contamination is one of the leading areas of concern in several regions, notably those areas with restricted provides like Taif (Loni et al. 2015). There are many potential sources might cause chemical and microbial contamination in ground waters. In that microbial contamination most vital it results in waterborne diseases. The feculent population is that the indicators to predict the potential presence of infective microorganisms in waters (Cabral 2010, Wu et al. 2016).
Chemical contamination like metal ions and trace elements are given a lot of attention, since its leads to the serious health issue. For example nitrates contamination leads to ‘methemoglobinemia’ or “blue baby syndrome” and its metabolic compounds derived from it will create a lot of health issues. Recently researchers are conformed its related to the three immaturity and intrauterine growth restriction (Tang et al. 2017). WHO has developed many pointer documents for the only real purpose of checking the standard of drinking water quality (WHO 2011) Recent years in KSA the standard of drinking water receiving some attention. The Saudi Arabian Standards Organization (SASO) has developed a standard for water qualities that’s safe and expendable for the people((SASO) 1984). Those standards are set limits for the permissible and most contaminates level of chemicals and microorganisms in water.
The aim of this study was to analyze the standard of drinking water from wells within the Taif region, Southeast, Saudi Arabia, and examine their physical, chemical and microbiological quality compliance with WHO pointers and SASO standards. Samples were collected from eleven totally different wells that are used for drinking purpose.
Materials and Methods
Study Area
Taif is a city in Mecca Province of Kingdom of Saudi Arabia at associate degree elevation of 1,879 m (6,165 ft) on the slopes of Sarawat Mountains (Al-Sarawat Mountains). Taif situated between 21°C 26′ 0″ northern latitude and 40°C 21′ 0″ eastern longitude, the city is that the center of an agricultural space. (Fig 1)., Taif has a hot desert climate however, this town with high rain falls inside Saudi Arabia. In all the months see some rain, with more rain in spring and late fall than in different months. Around 2.065% of total populations in Saudi Arabia are in Taif. (SAMIRAD 2015).
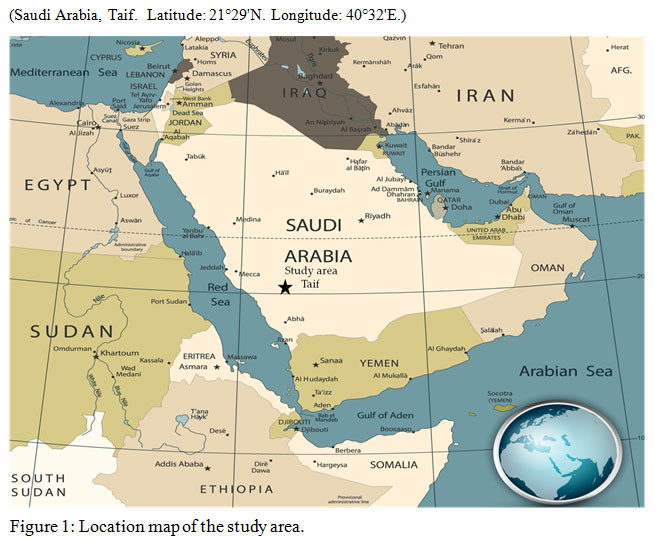 |
Figure 1: Location map of the study area.
|
Sampling
Water samples were collected following the proposed standards (Pritchard 2007) from urban and rural areas of the Taif region, Southwestern, KSA. (Table 1). Those wells waters are used for drinking purpose without any pretreatments. Samples were collected in 250ml sterile glass bottles; they were kept in ice boxes (4ºC) for further physical, chemical and microbiological analysis. Water quality was determined by the ways to delineate by SASO for examination of water and wastewater ((SASO) 1984). All the analysis are done with triplicates.
Table 1: Location of samples collected in Al-Taif district.
| Samples | Latitude | Longitude |
| T1 | 21°C15’25.17″N | 40°C25’52.47″E |
| T2 | 21°C12’50.47″N | 40°C24’45.74″E |
| T3 | 21°C13’47.47″N | 40°C24’3.17″E |
| T9 | 21°C16’38.96″N | 40°C23’5.14″E |
| T11 | 21°C22’8.49″N | 40°C28’28.07″E |
| T13 | 21°C25’14.12″N | 40°C29’8.70″E |
| T15 | 21°C12’50.47″N | 40°C24’45.74″E |
| T17 | 21°C26’49.53″N | 40°C30’44.69″E |
| T21 | 21°C29’24.69″N | 40°C29’16.25″E |
| T22 | 21°C29’48.08″N | 40°C30’12.85″E |
| T23 | 21°C18’45.84″N | 40°C26’30.02″E |
Physical Properties
A physical parameter analysis is incredibly necessary to get an idea to concerning the quality of water and that we will compare results of various physical parameter values with standard values (Patil. P.N 2012). The pH was examined at 25ºC by Multimeter [WTW, INNOLABS (Multi 9130), German]. Instruments are calibrated with INNOlabs pH standards.
Chemical Properties
Inductively Coupled Plasma Atomic Emission [ICPE-9000, SHIMADZU, Japan] has been used for heavy metals and trace element detections. All standards purchased from [PANREAC, Spain]. Water samples are initially filtered with a 0.2 µm pore size syringe filter (to take away residual particles), followed by pH adjustment (pH 7) before conducting the ICPE analysis. Five linear concentration standards were ready, starting from 1.0 µg/L to 500 µg/L and aspirated into ICP-OES system before conducting sample analysis, and therefore the linear curve was ready. All metals having the great linear graph with the coefficient of correlation( > 0.999) were discovered within the preparation of normal curves. When the completion of normal curve preparation, one normal check, and one QC check was analyzed. 10ml samples we accustomed analysis and studied the recovery of spiked concentration it’s nearly 98% for all elements (Singh et al. 2011).
Biological Properties
The three common bacterial analysis 1) Total coliform bacteria; 2) Thermotolerant (fecal) coliform bacteria; and, 3) Escherichia coli (E. coli) are used as microbiological indicators for pathogenic detection in potable water samples as per guidelines. Most probable number (MPN) one of the testing uses statistical tables to provide quantitative of these microbiological data by completing multiple presence/absence tests (Ahmed et al. 2015). All the medium for the bacterial analysis are purchased from [Himedia_Pvt, Mumbai, India].
Presumptive Test
The presumptive test involves in the samples demonstrated by the appearance of gas within the macconkey broth (Ashbolt 2004, Cabral 2010).For the presumptive check procedure, twenty test tubes are organized in 4 rows with 10ml of macconkey broth, the primary row contains double strength and also the further tubes are filled with single strength macconkey broth. Durham tubes are placed in all the test tubes upside-down for the detection of gas formation by Gram-negative coliform bacteria. The samples are inoculated in a sequential order of 10, 10-1, 10-2, and 10-3 ml respectively in every five tubes. Then tubes were incubated with half circled screw caps at 37°C for 48 hours. This procedure was followed for all of the samples severally.
Confirmative Test
The known positive samples were chosen for the confirmative check. BGLB is a selective media was used to make sure total coliforms within the samples. One loopful sample from the positive check tubes was inoculated with a group of five BGLB tubes and incubated at 37ºC for, 24-48 to hrs to confirm total coliforms and to differentiate the fecal coliform from the entire coliform another set of tubes were incubated at 44ºC for 24-48 hrs.
Complete Test
To confirm the E.coli among the fecal contamination, the samples are taken from the positive tubes of the presumptive test. Were inoculated with a group of five peptone water tubes and incubated at 44ºC for 24hrs. After incubation two drops of indole, the reagent was added to the tubes to watch the red ring formation. From an equivalent, indicator organism (E. coli) was discovered microscopically for their Gram reactions. This was the ultimate stage of the MPN technique whereby the choice of water quality as potable or non-potable, can be created when confirmation and completion of the study (Ahmed et al. 2015, Bing Chen 2016).
Results and Discussion
Physical Properties
The pH results showed there isn’t any significant different in all the samples (Table 2), the ranges between (pH 6.5 to7.6) those values are highly acceptable and lies at intervals the permissible limits of WHO & SASO standards for drinking water quality (Qari & Hassan, 2014).
Chemical Quality
ICP-OES technique used to determine the elements and its concentration with minimum significant (~10 ppb). A number elements (Ag, Al, B, Ba, Ca, Cd, Cr, Cu, Fe, K, Mg, Na, P, Pb, Zn) was observed within the 11 samples. Those elements are necessary to carry out cellular functions and its concentration variation encompasses a significant impact on human health. For example, the impacts on anatomy and physiological effects of consuming heavy metal contaminated water has been reported (Singh et al. 2011, Hassan & BAsahi, 2013; Hassan et al., 2014; Basahi et al., 2017) .It’s thought-about to be safe, once it goes on the far side the permissible limits.
Potassium (2.-7%), Magnesium (15-20%), Calcium (65-70%), Hydrogen (0-5%) and metallic element (0-5%) are the principle of soil ‘cations’. Those are necessary to keep up the water quality as well as given an idea about soil nature (Moghazi 1999; Hassan et al., 2017).
The higher and better concentration of sodium were observed in all samples. In that sample T2 (531mg/l) is recorded with the maximum level of sodium were compared to the other samples (Table:2), which excite the limits of recommended standards. Where the minimum concentration (7.55 mg/l) were observed in several samples like T1, T11 and T17. However, the sodium concentration has an essential role in soil turfgrass. The first drawback expose by high sodium isn’t a toxicity hazard, it reduces soil permeableness, leading to debilitating the water level in wells due to soil compaction. Those wells might need to resolve the “Sodic” soil drawback (de Oliveira da Mota et al. 2015). So the contaminated wells are required to present some attention for recommend treatment procedure (Al Meelebi et al., 2014; Bennett et al. 2016).
Table 2: Statistical summary of physio-chemical analysis and compared with recommended (WHO&SASO) standards.
| S.no | Parameters | Minimum | Maximum | Mean | Median | Standard Deviation | Standard values |
| 1 | pH | 6.8 | 7.60 | 7.21 | 7.3 | 0.26 | 6.5-7.5 |
| 2 | Ag (Silver) | 0 | 0.00 | 0.00 | 0 | 0.00 | |
| 3 | Al(Aluminum) | 0 | 0.05 | 0.00 | 0 | 0.02 | 0.5 |
| 4 | B (Boron) | 0.0349 | 0.52 | 0.29 | 0.332 | 0.20 | 0.2 |
| 5 | Ba (Barium) | 0 | 0.04 | 0.01 | 0 | 0.01 | 1 |
| 6 | Ca (Calcium) | 14.6 | 252.00 | 93.48 | 64.9 | 84.23 | 0.7 |
| 7 | Cd (Cadmium) | 0 | 0.00 | 0.00 | 0 | 0.00 | 200 |
| 8 | Cr (Chromium) | 0 | 0.00 | 0.00 | 0 | 0.00 | 0.003 |
| 9 | Cu (Copper) | 0 | 0.10 | 0.02 | 0 | 0.03 | 0.1 |
| 10 | Fe (Iron) | 0 | 0.00 | 0.00 | 0 | 0.00 | 2 |
| 11 | K (Potassium) | 0.259 | 9.23 | 3.91 | 4.24 | 3.35 | 0.3 |
| 12 | Mg (Magnesium) | 0.744 | 79.10 | 24.95 | 20.9 | 24.98 | 0 |
| 13 | Na (Sodium) | 7.55 | 531.00 | 93.21 | 31.3 | 153.61 | 150 |
| 14 | P (Phosporus) | 0.0626 | 0.43 | 0.21 | 0.202 | 0.12 | 200 |
| 15 | Pb (Lead) | 0 | 0.11 | 0.02 | 0 | 0.04 | 0 |
| 16 | Zn (Zinc) | 0 | 0.00 | 0.00 | 0 | 0.00 | 0 |
The observed volume of calcium is ranged between (14.3 to 251.7 mg/l). In that, the maximum concentration (251.7 mg/l) showed in T2 and T3 respectively. Those samples do not belong to the recommended standards. The geographical structure of those particular regions could be the reasons for these contamination (Xu and Lu 2010).The increasing calcium concentration in drinking water will lead health-related issues (Rapant et al. 2017).
Almost all the samples are contaminated with potassium (K) and phosphors (P). In that, the highest concentrations were observed in the samples T2 (K:9.23 mg/l, P:0.43 mg/l). Potassium and phosphorus are essential fertilizer used in agriculture land for plant growth and development (Wang et al. 2013). Taif is one of the famous places for agriculture within the Saudi Arabia. The identified wells (T2, T17) are more close to the agriculture lands. Using this kind of contaminated water may lead to kindly stone problems and some skin related health issues (Wang et al. 2013). So far consumption water should be pretreated by the recommended procedure Those contaminated wells need some attention to resolve and restrict chemicals from agriculture uses (de Oliveira da Mota et al. 2015). The related government can take some action for the uses of harmful chemicals in agriculture lands.
The concentration of the reaming elements (Al, B, Ba, Ca, Cu, K, Mg, Na, P, and Pb) were found within the volume of recommended standards. Which indicates the selected wells are not highly contaminated with chemical elements. The reason behind these may be the geographical nature of the selected regions, as well as the strong rules and regulation for the industries by governments.
Biological Quality
Total coliforms were determined by the formation of gas throughout lactose fermentation in durham’s tube and color changes within 48hrs of incubation at 37ºC with maccockey broth, those changes were observed within the samples, which is listed in (Table 3). The maximum counts were shown in T1 (4.9 MPN/ml). Samples T9 (˂0.018 MPN/ml) showed the lowest numbers. Total coliform bacterium are the natural gift within the atmosphere, particularly in tropical countries, and so doesn’t continually indicate the presence of human and animal wastes, therefore, additional confirmation is needed (Cabral 2010).
Table 3: Statistical summary of presumptive test (MPN).
| Sample name | Number of positive tubes in each
dilution factor |
MPN/ml | 95% confidence of | ||||
| 10 | 1 | 10-1 | 10-2 | Upper Limits | Lower Limits | ||
| T1 | 5 | 5 | 2 | 0 | 4.9 | 1.600 | 15.000 |
| T2 | 2 | 0 | 0 | 0 | 0.045 | 0.011 | 0.180 |
| T3 | 2 | 1 | 0 | 0 | 0.068 | 0.021 | 0.220 |
| T9 | 0 | 0 | 0 | 0 | <0.018 | 0.000 | 0.000 |
| T11 | 3 | 0 | 0 | 0 | 0.078 | 0.025 | 0.240 |
| T13 | 1 | 0 | 0 | 0 | 0.02 | 0.003 | 0.140 |
| T15 | 3 | 1 | 0 | 0 | 0.11 | 0.038 | 0.300 |
| T17 | 5 | 4 | 1 | 0 | 1.7 | 0.650 | 4.600 |
| T21 | 3 | 2 | 0 | 0 | 0.14 | 0.051 | 0.037 |
| T22 | 1 | 0 | 0 | 0 | 0.02 | 0.003 | 0.140 |
| T23 | 4 | 2 | 0 | 0 | 0.22 | 0.082 | 0.570 |
Total coliforms Fecal coliforms, and E.coli counts were confirmed by the further confirmative tests in the ambient temperature (Table 4). The total coliforms counts were confirmed by the color changes as well as the gas formation within the BGLB broth media at 37°C. The counts were observed between (˂0.022 to 0.28 MPN/ml). The gram negative and thermotolerant bacteria will grow at 44ºC, ferment lactose with gas production by observed these changes within the BGLB broth media, which indicates the fecal contamination within the samples. Sample T17(0.28 MPN/ml), T1(0.17MPN/ml) and T23(0.28MPN/ml) are highly contaminated than the other samples. The substantiating check remains a valuable indicator for the purpose together with 1) routine sampling within the treatment plant, 2) determination of the potency of a treatment method, 3) secondary assessment of human health risk (Ahmed et al. 2015).
Table 4: Statistical summary of Confirmed test (MPN).
| Sample Name | Total coliforms
MPN/ml (37°C) |
Fecal coilforms
MPN/ml(44°C) |
E coli
MPN/ml(44°C) |
| T1 | 0.28 | 0.17 | 0.13 |
| T2 | <0.022 | <0.022 | <0.022 |
| T3 | 0.05 | <0.018 | <0.018 |
| T11 | <0.022 | 0.092 | <0.022 |
| T13 | <0.022 | <0.022 | <0.022 |
| T15 | 0.11 | <0.018 | 0.079 |
| T17 | 0.28 | 0.28 | 0.22 |
| T21 | <0.018 | 0.02 | <0.018 |
| T22 | 0.02 | <0.022 | <0.022 |
| T23 | 0.28 | 0.17 | 0.17 |
Escherichia (E. coli) could be a bacterium that colonizes the alimentary tract of humans and alternative mammals shortly when birth and is taken into account a part of our traditional microorganism. one gram of contemporary excretion might contain as several as 1,000,000,000 E.coli (Katouli 2010). The class gut is that the traditional surround for E. coli, and, in contrast to an alternative coliform bacterium, they’re not unremarkably found in uncontaminated waters. This makes E.coli is a perfect indicator for human health The determination potable water quality was confirmed with E.coli contamination risk (Chhipi-Shrestha et al. 2017). Positive results were discovered in the same samples by gas formation in the organic compound in water at 44C in 24hrs, could be a confirmation for lactose fermentation and therefore the indole production was confirmed with red ring formation by adding indole chemical agent. Indole production check is vital within the identification of enteric bacteria. The similar changes were observed in the samples, is a clear indication of E.coil contamination. Among all samples from T1, T17 and T23 are highly contaminated than the reaming samples. E.coli is that the sole bacterium among the fecal coliform has the power to supply “tryptophanase” to decompose the aminoalkanoic acid tryptophan to indole, which accumulates within the medium.
Conclusion and Recommendation
The 95% of collected samples qualities (Physical, Chemical and biological) are lies under the recommended standards as per urged WHO & SASO standards. Sodium, calcium, phosphate, and magnesium concentrations in (T2) were beyond the standard vary of groundwater. It may lead to Sodic soil drawback. The massively focused agriculture constitutes are that the most offer of its contamination. The pathogenic indicators from fecal contamination have been conformed with E.coli determination in T1, T17 and T23. It reason behind this contamination most likely improper handling as a result of lacking sanitation awareness.
T1, T17 and T23 are not applicable for human consumption without adequate treatment. Those wells need the recommended recovery procedure to resolve the sodic soil issue.
There’s a necessity of water sanitation before use. Therefore presently the related government departments should think about to improve sanitation awareness within the local people.
Continuous assessment of water quality on the routine basis is imperative to reduce the deterioration of well water quality and eliminate health issues.
References
- Ahmed T., Baidya ., Acharjee M., Rahman T. Qualitative analysis of drinking water through the most probable number (MPN) method. S. J. Microbol. 2015;3(1):8.
- AlMeelebi T., Ismail I.,Basahi J., Qari H., Hassan I. A. Hazatrdous of waste water irrigation pn qaulity attributes and contamination of citrus fruits. Biosceince, Biotech. Res. Asia. 2014;11(1):89-97.
- Ashbolt N. J. Microbial contamination of drinking water and disease outcomes in developing regions. Toxicology. 2004;198 (1–3):229-238.
CrossRef - Basahi J., Ismail I., Hassan I. A., Haiba N., Hammam E. Total suspended particulate matter and its associated heavy metals in atmosphere of Western coast of Saudi Arabia. Polish J. Enviro. Stud. 2017;26(5):2419 – 2424.
CrossRef - Bennett M., Marchuk A., Raine S. R., Dalzell S. A., Macfarlane D.C. Managing land application of coal seam water: A field study of land amendment irrigation using saline-sodic and alkaline water on a Red Vertisol. J. Environ. Manage. 2016; 184(2):178-185.
CrossRef - Chen B. Y. M., Zhang B. Editorial: Marine and freshwater quality management. Water quality research journal of canada. 2016;51(3).
CrossRef - Cabral J. P. S. Water Microbiology. Bacterial Pathogens and Water. Int J Environ Res Public Health. 2010;7(10):3657-3703.
CrossRef - Chhipi-Shrestha G., Hewage K., Sadiq R. Microbial quality of reclaimed water for urban reuses: Probabilistic risk-based investigation and recommendations. Sci Total Environ. 2017;576:738-751.
CrossRef - Oliveira D., da Mota I., de Castro J. A., de Casqueira G. R., de Oliveira J. A. G. Study of electroflotation method for treatment of wastewater from washing soil contaminated by heavy metals. Mater. Res. Technol. 2015;4(2):109-113.
CrossRef - Hassan I. A & Basahi J. M. Assessing roadside conditions and vehicular emsiions using roadside lettuce plants. J. Environ. Stud. 2013;22(2):387–393.
- Hassan I. A., Corozzi L.,Haiba N. S., Basahi J., Isamil I., Hammam E. Trace metals in the fruits of date palm (Phoenix dactyfolira) in Jeddah city. Agrochimica. 2017;61(1):75–93.
- Hassan I. A., Basahi J. M., Ismail I. M., Zahran A. Advances in Environ. Biolog. 2014;7(14):4741–4748.
- Katouli M. Population structure of gut Escherichia coli and its role in development of extra-intestinal infections. Iranian Journal of Microbiology. 2010;2(2):59-72.
- Loni O. A., Zaidi K., Alhumimidi M. S., Alharbi O. A., Hussein M. T., Dafalla M., AlYousef K.A., Kassem O.M.K. Evaluation of groundwater quality in an evaporation dominant arid environment; a case study from Al Asyah area in Saudi Arabia. Arabian J. Geosci. 2015;8(8):6237-6247.
CrossRef - Moghazi H. M., A1-Shoshan A. A. (1999): A study of increasing Salinity of water Wells in AL-Qassim Region, Saudi Arabia A paper presented in the 4th Gulf water conference, Manama, the State of Bahrain. 1999;13-17.
- Orebiyi O . A. Water and pollution agents in the 1st century. Nature and Science. 2008;6(4):16-24.
- Patil N. S. D. V., Deshmukh R. N. Physico-chemical parameters for testing of water – A review. Int. J. Environ. Sci. 2012;3(3).
- Pritchard M., Mkandawire T.,Neill O. J. G. Biological, Chemical and physical drinking water quality from shallow wells in Malawi: Case study of Blantyre, Chiradzulu and Mulanje. Chem. Earth. 2007;32(15-18):1167-1177.
CrossRef - Rapant S., Cveckova V., Fajcikova K., Sedlakova D., Stehlikova B. Impact of Calcium and Magnesium in Groundwater and Drinking Water on the Health of Inhabitants of the Slovak Republic. Int J Environ Res Public Health. 2017;14(3):278.
CrossRef - SASO. (Saudi Arabian Standards Organization): (1984): Bottled and unbott1ed drinking water, SSA 409/1984, 2nd ed., 1996-03-13, ISSN: 1319-2302. Available from: SASO Information Center, P.O. Box 3437, Riyadh, 11471, Saudi Arabia. 198;4.1-8.
- SAMIRAD. (Saudi Arabian Market Information Resesource and Directory)Profile of saudi arabia. Riyad, Saudi arabia. 2015.
- Singh R., Gautam N., Mishra A., Gupta, R. Heavy metals and living systems: An overview. Indian J. Pharmacol. 2011;43(3):246-253.
CrossRef - Tang Z., Chai , Cheng J., Jin J., Yang Y., Nie Z., Huang Q., Li Y. Contamination and health risks of heavy metals in street dust from a coal-mining city in eastern China. Ecotoxicol. Environ. Saf. 2017;138:83-91.
CrossRef - Qari H., Hassan I.A. Removal ofpollutants from wastewater using Dunaliella alage. Pharmcol. J. 2014;7(1):147–151.
- Zheng W. Q., Shen Q., Guo S. The critical role of potassium in plant stress response. Int J Mol Sci. 2013;14(4):7370-7390.
CrossRef - WHO (World Health Organization) Geneva: WHO; Guidelines for Drinking-Water Quality. Third edition. Recommendations. 2004;1.
- Wu ., Carvalho P. N., Müller J. A., Manoj V. R., Dong R. Sanitation in constructed wetlands: A review on the removal of human pathogens and fecal indicators. Sci. Total Environ. 2016;541:8-22.
CrossRef - Xu Y., Lu J. l. Study on Form Distribution and Correlation of Heavy Metals in the Sediment of Urban Water, Biomed. Eng., Proc. Int. Conf. Bioinf. Biomed. Eng., 20th Chengdu, China. 2010;1-4.
- Zaidi F. K., Mogren S., Mukhopadhyay M., Ibrahim E. Evaluation of groundwater chemistry and its impact on drinking and irrigation water quality in the eastern part of the Central Arabian graben and trough system, Saudi Arabia. J. Afr. Earth Sci. 2016;120:208-219.
CrossRef

