
Manuscript accepted on :28-Aug-2018
Published online on: 05-09-2018
Plagiarism Check: Yes
Reviewed by: Ayan Chatterjee
Second Review by: Prof M. Zak Khalil
Final Approval by: Juei-Tang Cheng
C. H. Renu Madhavi
Department of Instrumentation Technology Rashtreeya Vidyalaya College of Engineering, Bangalore-59, India.
Corresponding Author E-mail: renumadhavi@yahoo.com
DOI : https://dx.doi.org/10.13005/bpj/1532
Abstract
Heart Rate variability (HRV) analysis using nonlinear techniques is very much useful to estimate the status of Autonomic Nervous System (ANS) non invasively. In this paper ANS status is estimated using nonlinear Spectral Entropy (SE) technique for both Healthy, Depression and Thyroid subjects. HRV data of Thyroid , Depression and healthy subjects is derived from Power lab Instrument with sampling frequency of 500Hz.Three observations are made based on the estimated values of SE. First observation is that SE values of Thyroid and depression subjects is lower compared to Healthy subjects SE values. Second observation made is that among Thyroid and Depression subjects SE values are found to be the lowest for Thyroid subjects compared to Depression subjects. Third observation made is that the SE values of CHF and AF subjects is lower than Thyroid and depression subjects. From the three observations made lower values of SE indicates the existence of ANS dysfunction for AF,CHF, thyroid and depression subjects Further it indicates that these subjects are at higher risk of cardiac dysfunction as compared to CHF and AF subjects leading to mortality. From the results obtained it may be concluded that among the Thyroid and Depression subjects Thyroid subjects indicate higher ANS dysfunction indicating Thyroid subjects are at higher risk of cardiac dysfunction..These findings are in agreement with the medical findings available in the literature.
Keywords
Depression; Hear Rate Variability; HRV Analysis, Spectral Entropy; Thyroid
Download this article as:| Copy the following to cite this article: Madhavi C. H. R. Estimation of Spectral Entropy of HRV Data and its Application to Depression and Thyroid Subjects to Predict Cardiac Risk. Biomed Pharmacol J 2018;11(3). |
| Copy the following to cite this URL: Madhavi C. H. R. Estimation of Spectral Entropy of HRV Data and its Application to Depression and Thyroid Subjects to Predict Cardiac Risk. Biomed Pharmacol J 2018;11(3). Available from: http://biomedpharmajournal.org/?p=22215 |
Introduction
Cardiac dysfunction is one of the primary cause of human death. HRV can be an effective non-invasive tool for detecting the cardiac disorders and predicting risk of sudden cardiac arrest The effect of Autonomic Nervous system (ANS) on HRV has been well established. Further the subjects suffering from Depression lead to cardiac disorders caused by ANS dysfunction.4
Heart Rate Variability refers to variation of Heart rate around its mean value.HRV can be analysed in Time domain, frequency domain and also using Nonlinear techniques2 The nonlinear domain analysis can bring the hidden warnings about the diseases and hence it is more powerful method for analysis.HRV data is derived from Electrocardiogram(ECG)/Initially ECG has to be recorded, From the recorded ECG ,QRS complexes need to be detected using available QRS detection techniques. The time intervals between the successive QRS complexes is RR interval. Heart rate can be computed by taking the reciprocal of RR interval and multiplying it by 60 gives heart rate in beats per minute.
Background
HRV analysis can be carried out in time domain, frequency domain and using nonlinear methods.2 From the previous work it is found that the analysis has been done using HRV data of Healthy, Cardiac Diseased (CHF, AF)subjects and Non-cardiac diseased (Thyroid and Depression) subjects. The nonlinear techniques such as Approximate Entropy (ApEn), Sample Entropy (SampEn) and Spectral entropies (SE) were found to be lower for thyroid subjects as compared to healthy subjects.5,6,7 The nonlinear techniques such as Approximate Entropy (ApEn), Sample Entropy (SampEn) were found to be lower for Thyroid and Depression subjects5 HRV data quantification using CD, ApEn and SampEn was done for Depression subjects but the quantification is not done using Spectral Entropy.4 Further the risk of mortality among Thyroid, Depression, CHF and AF subjects was not investigated in the previous studies. In this paper an attempt is made to asses the risk of mortality among the subjects with Thyroid, Depression, CHF and AF by quantifying the ANS dysfunction using Spectral Entropy (SE).
The objective of this paper is to characterise the subjects affected by Congestive Heart Failure (CHF), Atrial fibrillations (AF). and Depression disorders using Spectral Entropy(SE)and find out the significant difference between the pathological condition and the physiological state This paper is designed to evaluate the status of ANS using nonlinear measures of HRV such as Spectral Entropy (SE) which reflects the spectral complexity of the data as quantitative markers in case of Congestive Heart Failure (CHF), Atrial fibrillation (AF), Depression and Healthy subjects.
Methodology
The objectives are to Generate the Heart Rate Variability (HRV) data profiles from reasonable number of healthy, AF, CHF, Thyroid and depression subjects for detailed analysis.
Data Acquisition
This study covered six different populations. The first group consisted subjects of congestive Heart Failure (CHF), second group consisted of Atrial Fibrillations (AF), third group consisted of Thyroid, fourth group of Depression and ,fifth group being healthy subjects. Each group had five subjects. The age of healthy, thyroid and depression subjects are between 21 to 23yrs where as the age of the subjects of group1 and group 2 are between 32 to 72yrs.
Two different methods are used to derive the RR interval data required for the HRV analysis for different subjects. The first method acquired ECG using Powerlab from lead 1, the PR interval data are directly derived from the Power Lab instrument where pre-processing is taken care by the Instrument. In the second method RR interval data is directly acquired from Physiobank for CHF subjects and AF subjects.
Data Acquisition
Methodology I
The RR interval data required for the analysis is obtained from MLS360/6 ECG Analysis Module of Power lab data acquisition systems (ADI Instruments). ECG data of all healthy subjects (15 male and 10 female); with age between 21–43 years are recorded from ECG lead 1 with a Sampling rate of 500 Hz.
Also ECG data of Five Thyroid and five depression subjects (2male and 3 female) of the age between21-23 years is recorded similarly. The data is recorded for about 15 to 20 minutes with the subjects in the sitting position the software of the Power lab will remove the artifacts. Data recorded in the last fifteen minutes is taken for analysis. The data recording was done at “Ved Vignan Maha Vidya Peeth “Research Center, Kankpura, Bangalore.
Out of 25 RR interval data generated for Healthy subjects only five healthy subjects(2 male and 3 female subjects N17, N18, N19, N20 and N21), whose age is between 21-23 years is derived for the analysis.
Data Acquisition
Methodology II
The required RR interval data of Congestive heart failure subjects, and Subjects with Atriel fibrillations recorded for long duration for about 20 hours are obtained from www.physionet.org. The RR interval data of five subjects with congestive heart failure (CHF) and five subjects with Atriel fibrillation(AF) obtained from Physionet8 are sampled at 250Hz.
The data analysis has been limited to the the HRV data collected for five subjects in each category of diseased and healthy subjects as the purpose of this paper is to establish the behaviour on non linear parameters for thyroid,depression subjects related to healthy subjects. The analysis of results of this paper will not lead to any statistcal conclusions From the HRV data acquired from both methods only data length of 512 is used for Power spectral density and Spectral Entropy analysis.
Correction of Data Anomalies
The data discussed in the previous section 1.3.1 and 1.3.2 contained intermittent entries too high or too low values to be considered for data. These intermittent values are called outliers.
The presence of outliers in the data causes negative effects on the Entropy calculations. Because the presence of outliers increases the standard deviation of the RR interval data which in turn increases the tolerance ’r’ and reduces the Entropy values. We did it by removing RR intervals greater than 1 second and less than 0.3 seconds manually.
Programs for Data Analysis
Computer programs used to compute Approximate Spectral Entropy(SE) are written in MATLAB. The computations of all entropies and CD are based on the algorithms described in this section. The nonlinear technique employed to asses the ANS status is Spectral Entropy(SE).SE defines the spectral complexity of the time series data.3 The algorithm for estimating SE is described below.
Power Spectral Density and Spectral Entropy Algorithm
In frequency domain analysis, three important regions were considered namely very low frequency (VLF), low frequency (LF) and high frequency (HF) regions. The specific frequency regions are defined as per the guidelines of Task force (1996).2 The power spectral density of HRV data is estimated by applying Fast Fourier Transform (FFT). In order to estimate the excitation level of the parasympathetic nervous system and sympathetic nervous system in ANS , the power spectral density estimation methods (PSD)are employed on the Heart rate signals. The power spectral analysis is done by using FFT or using Autoregressive modeling.
Spectal Entropy
Spectral complexity of HRV data is quantified by Spectral Entropy(SE). Estimation of the spectral Entropy of the system is done by applying Shanon’s channel entropy. Where SE is expressed as.
SE = Σ kf log ( 1/kf)
With kf as the PDF value at frequency f.1.5,9 Complexity of the HRV signal is described spectral entropy. This SE is computed for Thyroid and Depression subjects and Healthy subjects by implementing the algorithm in MATLAB.
Spectral entropy (SE)indicates the spectral complexity of time series data at frequency f. The algorithm to estimate spectral entropy is described below based on the concepts of1,3,6
Sequence of operations to be performed for Computation of spectral entropy(SE) is described below.
Derive HRV data.
Transformation of HRV data into power spectrum using FFT.
Perform power spectral density (PSD) computation.
Compute Spectral Entropy after normalizing the PSD.
SE = Σ kf log ( 1/kf)
Where kf is the PDF value at frequency f. The Spectral entropy describes complexity of the HRV signal.
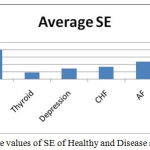 |
Figure 1: Average values of SE of Healthy and Disease subjects.
|
Results and Discussion
The power spetral density distribution as a function of frequency is determined using FFT for healthy subjects and shown in figure 2.
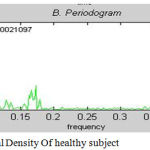 |
Figure 2: Power Spectral Density of healthy subject.
|
Figure 2 shows that the Power spectral Density of HRV of healthy subjects. It can be observed from the figure that the power density is spread over the frequency range from 0 to 0.2 Hz.
Similarly for Thyroid subjects. PSD as a function of frequencyis shown in figure 3.
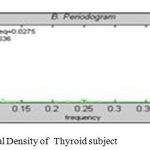 |
Figure 3: Power Spectral Density of Thyroid subject.
|
Figure 3 shows that the Power spectral Density of HRV for thyroid subjects It is seen from the figure the power density is spread over the frequency range from 0 to 0.13 Hz with peak power~ 0.015 msec2 0.002 HZ. This also indicates that power density distribution is confined to a lesser frequency range compared to healthy subjects. The figure also indicate the occurrence of low frequency components in HRV between 0.025 – 0.075 HZ for thyroid subjects.
Similarly figure 4 shows the PSD as a function of frequency for Depression subjects.
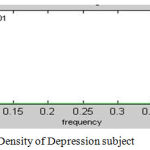 |
Figure 4: Power Spectral Density of Depression subject.
|
Figure 4 shows that the Power spectral Density of HRV for Depression subjects It is seen from the figure the power density is confined to a still lesser frequency range from 0 to 0.1Hz compared to healthy subjects The figure also indicate the occurrence of low frequency components in HRV between 0.025 – 0.075 HZ for Depression subjects.
Similarly figure 5 shows the PSD as a function of frequency for CHF subjects.
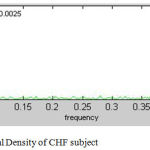 |
Figure 5: Power Spectral Density of CHF subjec.
|
Figure 5 shows that the Power spectral Density of HRV for CHF subjects. From the figure the power density is observed to be confined to a very narrow region 0-0.05 Hz compared to healthy subjects. It may b noted in the figure that the low frequency components in HRV between 0.025-0.075 Hz are absent for the CHF subjects.
Similarly figure 6. shows the PSD as a function of frequency for AF subjects.
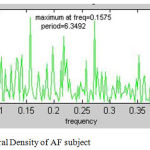 |
Figure 6: Power Spectral Density of AF subject.
|
Figure 6. shows that the Power spectral Density of HRV for AF subjects .Power density is spread over wide range of frequency covering both high and low frequency region from 0 to 0.5Hz as observed from the figure. Compared to healthy subjects the frequency range spreads beyond the frequency range of healthy subjects.
It is evident from the results that the non cardiac subjects indicate the presence of strong low frequency components at 0.27 and 0,10 Hz compared to cardiac and healthy subjects. This results suggests that the in case of non cardiac subjects there is a possibility of generation of low frequency HRV components which may affect the regular functioning of the heart.
HRV data of the Healthy and diseased subjects are investigated by estimating the Spectral Entropy (SE) parameter which represents the spectral complexity of the time series data. The SE describes the spread of power spectrum. Low value of SE indicates the concentration of the energy in few frequencies. Where as larger SE represents the energy spread Spetral entropy quantifies the distribution width of the power spectrum.1,9
The average Spectral Entropies (SE) have been calculated using HRV data of both healthy, cardiac and Non- cardiac diseased subjects are plotted in figure 1.
It is seen from the figure1 that the spectral Entropy (SE) indicate higher value for healthy subjects (~2.0) and lower Spectral Entropy (SE) values for diseased subjects.. Further SE values show that for Non-cardiac diseased subjects Thyroid (0.4) and depression subjects(0.6) the SE values are the lowest compared to cardiac subjects (0.75) and AF subjects (1.25).
The Results clearly indicate that the spectral complexity is more for healthy subjects compared to cardiac and Non- cardiac disease subjects including AF subjects. In case of Thyroid and Depression subjects SE being very low suggesting that for these cases the spectral energy distribution is confined to very few low frequency components.
Lower Values of SE for pathologies (CHF,AF) agrees with the findings of VeeraReddy and Anuradha 2005.3
Conclusions
The following conclusions can be drawn from the analysis carried out.
The estimated values of SE indicate low as compared to healthy subjects.
Further SE values for thyroid and depression subjects are found to be lower compared to AF,CHF subjects.
The SE parameters for AF subjects shows higher values compared to healthy subjects indicate hyper active dynamics of the heart which is abnormal.
These observations are in concurrence with the medical literature and According to literature the possible mechanisms due to which depression subjects have increased cardiovascular mortality are namely Affected ANS, Platelet Activation and endothelial dysfunction, and inflammatory cytokines was well documented.
References
- J.A and Roberts S.J. Stochastic complexity measure for physiological signal analysis”IEEE Trans. Biomed Eng.1993;28:1186-1190.
- Task Force of the European Society of Cardiology and North American Society of Pacing and electro physiology. Heart Rate Variability: Standards of measurement, physiological interpretation and clinical use. Eur Heart J. 1996;17:354–81.
CrossRef - Anuradha B and Reddy V.V.C. Cardiac Arrhythmia classification using fuzzy classifiers. Journal of theoretical and applied information technology. 2005;352-359.
- Albert C.Y.,Jee C.H., Jen S.T. Heart Rate Variability in Psychriatic Disorders. Taiwanese Journal of Psychiatry (Tapei). 2010;24(2):99-109. 2005.
- Madhavi R and Ananth A.G. Analysis and Characterization of Heart Rate Variability (HRV) Data of Different Sets of Subjects Using Nonlinear Measure (Approximate Entropy). International Journal of Computer Theory and Engineering. 2010;2(4):619-623.
- Renu C.H.M and Ananth A.G. Spectral Entropy Estimation of HRV Data of Thyroid & Healthy subjects. International Journal of Computer Applications. 2011;30(1):39-41.
- Renu C. H.M and Ananth A.G. Noninvasive Detection of Thyroid Dysfunction using Bicoherence plot and Bicoherence metric of HRV data. International Journal of Multidisciplinary Research and Advances in Engineering (IJMRAE), Ascent Publications. 2011;3(1):81-90.
- physiobank.com
- zhang A., Yang B and huang l. feature extraction feeg signa Using Power Spectral Entropy, proceedings of international conference on biomedical Engineer ing and Informatics. 2009;2(4):3543908.

