
Manuscript accepted on :13 June 2018
Published online on: 26-06-2018
Plagiarism Check: Yes
Ruchi Agarwal, C. S. Salimath, and Khursheed Alam
Department of Mathematics, School of Basic Sciences and Research, Sharda University, Greater Noida, 201306, India.
Corresponding Author E-mail: agarwalruchi205@gmail.com
DOI : https://dx.doi.org/10.13005/bpj/1447
Abstract
Turbulence can occur anywhere including our human body, some phenomenon describe it well. One of them is Abdominal Aortic Aneurysm. Therefore, as an illustration in this article, wavelet analysis of electrocardiographic (ECG) signal of a subject is performed to study the effect of complex phenomenon turbulence in human body part. This article deals with different perspective of turbulence, main emphasis is on wavelet analysis. Therefore, different wavelet family members are employed to get various views of analysis at different decomposition levels. Turbulent flows are generally modeled with the help of Navier-Stokes equation. Different numerical techniques for solving Navier-Stokes equations using adaptive wavelet bases are also pondered.
Keywords
Abdominal Aortic Aneurysm; Daubechies wavelet analysis; Navier-Stokes equation, ECG; Turbulence; Wavelet Analysis
Download this article as:| Copy the following to cite this article: Agarwal R, Salimath C. S, Alam K. Turbulence in the View of Wavelets with Abdominal Aortic Aneurysm ECG Analysis. Biomed Pharmacol J 2018;11(2). |
| Copy the following to cite this URL: Agarwal R, Salimath C. S, Alam K. Turbulence in the View of Wavelets with Abdominal Aortic Aneurysm ECG Analysis. Biomed Pharmacol J 2018;11(2). Available from: http://biomedpharmajournal.org/?p=20893 |
Introduction
Wavelet analysis technique has been successfully applicable in various branches that include Image compression, signal processing, fluid mechanics, medical imagery, pattern recognition and geo-physics. Their application to the solution of differential equations has made possible to model complex phenomenon like turbulence. As a result, turbulence unpredictable and chaotic behavior has been made understandable many times. This benefit was utilized in biomedical sciences, most recently on the function of cardiovascular (CV) system.
Abdominal Aortic Aneurysm (AAA) in some subjects results from turbulence of blood flow in abdomen. This blood flow turbulence has large impact, which results into damaging and weakening of aorta walls that can be life threatening also. Very recently it was discovered that AAA is the 13th leading cause of mortality in US.1
Turbulence is characterized by disorder, randomness, and instability that have been unexplored mathematically. There are many diseases which other than presumed symptoms still require research work to get exact occurrence and treatment of it. Some of the simulation and modelling process are still going on to discover and analyze the conditions of various natural occurring phenomena in body. Turbulence is one of it, which is still in research process. In some medical fields it was observed that AAA occurrence was the result of blood flow turbulence that can be a result of mental shock or any accident. Therefore, electrical activity of heart using electrocardiograph (ECG) was analyzed to get the status of blood flow and pumping of heart. Such ECG of a 68 year old subject is carried out for analysis using different wavelet family members in this article. Terms related to the process are discussed in further headings and future challenges are addressed that are open to further quest.
Anatomy
The aorta is largest artery that supplies blood from top of the left ventricle to chest and abdomen through the aortic valve. AAA enlarges the lower part of the aorta that can be rectified through surgery, depending on the increasing rate and size of it. Initially AAA is difficult to detect, few symptoms for diagnosing it are as follows: Severe and constant pain in abdomen, pulsating feel near naval accompanied by back pain. Men aged above 60 and with/without smoking history are at high risk. Continuous use of tobacco can develop higher risk of rupture of aortic aneurysm. If aneurysm is already present in any other part of body and subject also has genetic tendency, then abdomen aortic aneurysm size increases progressively. Few causes of AAA include Trauma, High blood pressure, blood vessel disease in abdomen, hardening of the arteries. Some of the after effects of AAA are dizziness, nausea, vomiting, fast pulse, intense abdomen pain that travels from abdomen to back. Other than these thrombus is very serious one as it can travel in any part of organ and can block the blood supply. Given below figure 1 represents AAA occurring in human body.
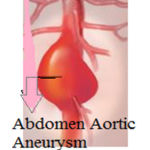 |
Figure 1: Abdominal Aortic Aneurysm occurring in human body
|
Ventricular Hypertrophy (VH)
It is categorized into two types, right and left VH. These two hypertrophy(s) occur when simultaneous right and left ventricular overload. Cause of right VH can be any cardiac abnormality like ventricular septal defect. Ventricular electric forces directed to right ventricle and left ventricle are increased by right and left VH respectively. Evidence of VH presence can be understood by tall R wave (mV) for right VH and tall R and S (mV) wave for left VH in ECG analysis. Causes of left VH are linked to aortic valve disease, mitral valve disease, systemic hypertension, and cardiac muscle cells sickness.
Turbulence is principally characterized by its fundamental multi-scale behavior and self-organization into coherent structures and nonspecific arbitrariness. The onset of turbulence can occur under certain conditions, like high blood pressure and trauma that can have adverse effect on the functionality of CV system. Fluid pressure distribution of aortic valve changes drastically with changes in turbulence of blood flow.2 Simulation study on turbulence transition has shown rapid increase in aneurysm with high Reynolds number.
Mathematically
At the beginning of 19th century, famous scientist Euler derived the equation for a fluid in motion. This equation however, does not take into account friction, applicable on moving fluid. This concept was covered by Navier-Stokes (N-S) in their derived equation of fluid flow. These N-S equations are fundamental equations that are employed in analyzing viscous fluid flow. They have also modelled unsteady, viscous and 3D fluid flow. In computational fluid dynamics field, N-S equations are still a subject of research. They have been considered as building blocks to modern fluid dynamics. The Navier-Stokes equation of an incompressible viscous fluid for an unsteady motion is given as follows:
![]()
Here, incompressibility condition

Convective term is
![]()
Re is the Reynolds number. Navier-Stokes equation has played a vital role in the context; however certain issues are related to it can’t be neglected. Firstly, it failed to discover any result on regularity, existence and uniqueness in three dimensions. Secondly, it was observed that equations of 3D can have singular solution during flow in some intervals. Next is presence of non-linear convective term in the equation. This arise a hurdle in turbulent theory. Last complication is related to limit, as kinematical viscosity tends to zero, the second order equation reduces to Euler equation of first order.3 It ultimately leads to a singular perturbation problem.4
Current Scenario and Impact of wavelets on Fluid Dynamics
For scientist fraternity computational fluid dynamics (CFD) of turbulence is still a major challenge. Accurate prediction of the effect of turbulence flows is still a need in various fields of science and technology. Challenges faced by research community to define it computationally, depends on the large and continuous range of length scales covered by turbulence. This range of turbulence increases with increase in Reynolds number like Re1/2for 2D and Re3/4 for 3D. Because of this reason, using direct numerical simulation approach to solve N-S equation depends upon the computing power available. Thus, restricted models with large scale calculation that include the physics of turbulent flows are unavoidable. An approach that modeled the turbulence is Reynolds- average N-S methodology given by Gatski et al. (1996) and Durbin and Reif (2001) in which time or ensemble-averaged flows are computed. From practical point of view it proved to be far satisfactory. This gives a direction to model the turbulence in time-frequency localization property using wavelet and fast wavelet transforms. This approach was faster than fast Fourier transform. With the help of wavelet property- Multi-Resolution Analysis (MRA), wavelet modeled the framework that identifies coherent structures responsible for the flow dynamics of turbulence.
Numerical methods with the help of wavelets models sparse representation of turbulent fluid flow fields. Wavelet based method was put forth first by Meneveau(1993), that uses wavelet transform analysis for 3D velocity field, time dependent study in a turbulent flow. With the help of wavelet adaptive method, Farge et al. (1997) introduced Coherent Vortex Simulation (CVS). Goldstein and Vasilyev (2004) suggested the stochastic coherent adaptive large-eddy simulation method to reduce computational cost.5
Wavelet method’s ability to clearly identify and isolate localized flow structures such as shocks or vortices and making them available on adaptive computational meshes discriminates it from traditional methods.6 This unified hierarchical turbulence, models the coherent structures that capture the dynamics of flow across the full spectral range. With the help of adaptive wavelet method integration of turbulence modeling results into hierarchical approach, where many coherent eddies are dynamically resolved using self-adaptive computational grid.7
Wavelet Transform Methodology
Fourier transform (FT), a powerful tool, is useful in analyzing stationary stochastic signals. It does not provide structured or local information of the signal. This analysis has been successful in giving theory of homogeneous turbulent velocity field considered in some predefined shaped box, thereafter studying effects of large volume approaching to infinity. Therefore a need arises for the real world turbulence description, resultant of transform, such that it decomposes the flow field into components of different length-scales with different position and directions. The FT failure gave this opportunity to wavelet transform (WT) that represents the quantities on scale, position and direction, thereby giving a more revealing picture of turbulence.
Over the last two decades wavelet theory has gain tremendous interest in areas like mathematics, physics, biomedical engineering to name a few. Wavelets are defined as basis functions that are localized in both space and wave number space; because of it wavelet transform provides space/scale information.8 Wavelet transform is basically an inner product of analyzing wavelet and a function that is analyzed. Wavelet coefficients thus give information about both. To analyze turbulent, wavelet should not only be of zero mean but should also have vanishing moments of higher orders. Therefore, an appropriate choice of wavelet is required that depends upon the requirement of information after extraction of the signal.9,10
Transformation with the help of wavelet is done using wavelet function α (t) and signal x (t). Let be scaling function β (t). Let S be the approximate coefficients, then β (t) can be convolved with to produce S. Thus, discrete wavelet transform (DWT) can be written as:
Original signal can be reconstructed using orthonormal wavelet basis αm,n (t). At the scale m and location n, signal S can be represented as follows:
![]()
Generally, input signal So,n is of finite length say N, such that N=2M. This makes investigative range 0<m<M. Thus, a discrete approximation of signal becomes:
At M mean signal approximation is given as follows:
![]()
For a finite length signal, detail signal approximation corresponding to scale m is defined as follows:
For a finite length signal, detail signal approximation corresponding to scale m is defined as follows:
The approximation of the original signal at scale index 0 is formed by adding the approximation of the signal at scale index M to the sum of all detail signal components across scales. At a specific scale signal approximation is a combination of the approximation and detail at the next lower scale, xm (t) = xm-1 (t)-dm(t). This is referred to as multiresolution analysis of a signal and is the basic ingredient of our procedure. Many wavelet families are known nowadays that can be applicable to the signal of interest. Some of the names in the wavelet families are Haar, Daubechies, Coiflet, Symmlet, Biorthogonal wavelets and so on. The choice of the wavelet family member depends upon the application. The Haar wavelet is easy to understand and compute. The Daubechies algorithm is not as easy to understand as Haar wavelet and it also has slightly higher computational overhead.
Meneveau’s Wavelet Analysis of Turbulence
A researcher Meneveau (1993) took initiative for the study of 3-D computations of velocity field which is time dependent, in a turbulent fluid flow. He also proved that there exists energy cascade that ranges from large to small turbulent scales. As per his theory cascade process goes on increasing continuously while forming turbulence flow. During this process large cascade contains small scales cascade and this small scale contain another smaller scale cascade and so on. In forming these cascades, energy of the parent eddy is spent into creating small eddy, this shows association of flux between them. As the scale changes variation in viscosity also changes and energy flux is dissipated. One important point was predicted during assumptions that energy cascade of turbulent eddies reveal fractal structure. This came out to be turning point for theoretical models, description and analysis of turbulence.11
Wavelet Analysis of Turbulence by Farge’s
Some physical quantities like energy, vorticity, pressure and entropy becomes irregular because turbulent flow dynamics depends on different length scales with different position and directions. Physical quantities’ local information associated with turbulence can be revealed with the help of wavelet transform.6 Farge also defined another feature of turbulence known as intermittency phenomenon using wavelet transform. Beside all these advantages WT suffer from certain limitations that give hope for further research and improvements in tools, technique and understanding.
Wavelet analysis of Turbulent flows by Adaptive method
Turbulent fluid flow is very unpredictable because of which virtual analysis of fully developed turbulence at a very large Reynold number is impossible. Thus, a new technique was introduced by several researchers including Farge known as Adaptive wavelet Method. This approach was helpful in simulating turbulence as inherent structures that are localized co-herent vortices growing in a multiscale non-linear dynamics. Wavelet basis functions that were localized in physical as well as spectral spaces were used by some researcher, which gave another form to this method that includes combination of space and adaptivity of wavelets. This method is said to predict results at large Reynolds number.
Brief Theory
Electrical activity of heart recording in a graphical form is known as electrocardiographic (ECG) signals. Previously time domain method was used for the analysis; this could not reveal all the features of ECG signals. So, to get all related information frequency representation with the help of Fast Fourier Transform was employed. But this could not localize frequency component, which was essential requirement for the description of ECG signal in critical stages. This raises the need of time as well as frequency component representation that made wavelet transformation as the important part for signal analyzer. There are various wavelets introduced by different scientist that allows decomposition of signals at different levels giving set of coefficients. These coefficients can be looked up to measure ECG components at time and frequency localization. An ECG signal is characterized of peaks and valleys named as P, Q, R, S, and T. Analyses of these peaks and valleys gives an idea of performance of heart chambers. Like P wave describe upper chamber of heart, T wave and QRS complex describes functionality of lower chamber of heart. Heartbeat of healthy person lies in between 60-100 bpm, slower than this rate is termed as bradycardia and higher is termed as tachycardia. Figure 2 shows characterization of ECG into its peaks and valleys.
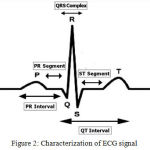 |
Figure 2: Characterization of ECG signal
|
Dataset
For the illustration purpose United States Massachusetts city general hospital waveform database is utilized.12,13 This database is a comprehensive collection of ECG waveforms of stable and unstable patients in intensive care units, and cardiac catheterization laboratories. This database consists of recordings of 250 patients that vary in length from few minutes to an hour. With the help of 8-channel instrumentation tape original signals were recorded and digitized twice at real time. This database set is available for research and study. One of the subject ECG case studies is provided in further readings to get an idea of blood flow phenomena.
Illustration and description
Instability of laminar flow arise turbulence. Turbulence is characterized by irregularity, indefinitely increasing high Reynolds number, unpredictability, intermittency, randomness in time and space. To analyze its features and to get complex mathematical model’s solution, dependency on experimental data is the only way out. Experimental values generally give figures that are easy to measure, however physical significance from the volume of data that can estimate structure and dynamics of turbulent flow is not clear. Deeper understanding of flows is either too difficult or impossible.
In the context of turbulence an electrocardiographic ECG record is collected from a 68 year old subject recommended for resection and grafting of AAA. These ECG signals were in the form of a matrix (rows and columns). For the simplest form and easy to understand, these signals have been analyzed by wavelet tool box from Matlab software taking a row (1-D) at a time [14]. Different wavelets at different levels are employed to get the idea of different decomposition of that signal. Following table 1 utilizes Daubechies, Symlet, Coiflet and Haar wavelets at 5, 6, 7, 8, and 10 level of decomposition. In all the graphs compiled in table 1, first row represents the original signal drawn in red. Every ECG signal in the graphs given below contains some short burst of noise at its ends.
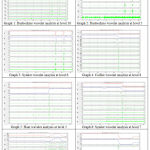 |
Table 1: Row wise Analysis of signals through wavelet at different levels
|
Result and Discussion
Selection of wavelet function that is suitable and closely matches the signal is of major concerned. After choosing and applying appropriate wavelet family member for analysis, the signals in the graphs show details on different scales for better understanding and illustration. When all these details and signal approximation are added together, it gives original signal. Details at lower scale show clearly higher frequencies and at higher scale peaks are flattened with more visible lower frequencies. Most of the details are observed at lower scales that needs less decomposition. In some of the analysis, it could be perceived that baseline of signal has irregular fluctuations that may be the resultant of irregular and chaotic activation in the atria. Consequence of these fluctuations gives rapid and irregular ventricular rate. In some cases P wave is of opposite polarity or totally not visible, this indicates that heart rate is slow and origin of cardiac rhythm is in the atrioventricular (AV) node. A signal depicts ECG abnormality sinus bradycardia and experts interpret left atrial enlargement, left ventricular hypertrophy, and nonspecific T wave abnormality resulting into AAA, describing a type of blood flow turbulence. Physician and cardiologists also comments that some of the ECG’s are acute and chronic that shows ST elevation that is closely related to direct coronary involvement.
Some of the parameters related to cardio-respiration that are measured directly and monitored in the critical condition of subject are given in Table 2. Few disorders cannot be diagnosed from ECG data, therefore new techniques like angiography and echocardiography is useful in providing information.
Table 2: Parameters Measured in Critical Conditions
| S. No. | Variable | Normal values | Observed Values |
| 1. | Central Venous Pressure (CVP) | 1-9 mmHg | 20.54 |
| 2. | Pulmonary artery occlusion pressure (PAOP, PAWP) | 0-12mmHg | 18.62 |
| 3. | Arterial pH | 7.36-7.44 | 11.35 |
The QRS-complex as per the name consists of three components Q-wave, R-wave, and S-wave. In some of the abnormal ECG, Q-wave and S-wave remains absent. The R peak can be marked with the help of thresholding property say above 0.5mVseparated by say more than 200 samples. To find S peak one needs to find local minima, that can be detected using inverted version of original signal. De-noising of the signal is a necessary step in finding Q wave as it is not visible under noisy signal. Thus, an algorithm Savitzky-Golay is used to de-noise the signal in the illustration. After this step all the peak that has been detected are plotted on the graph. To represent all the peaks first row signal from the matrix of signal is taken as an example and all the peaks are marked in it, refer to graph 9.
With the help of inbuilt functions in Matlab software some of the properties related to the peaks of ECG are calculated. These functions include average difference between QRS peak in original signal and de-noised signal. Taking the example in serial order, some of the properties of ECG signals are described in Table 3. These properties are helpful in peak analysis as well.
Table 3: Peak Properties
| Signal Number | Mean Error R-wave | Average Fall Time | Mean Error S-wave | Average Fall level |
| 1. | 0.3803 | 316 | -0.4261 | 82.6194 |
| 2. | 0.9828 | -14.8750 | -0.6605 | 55.3567 |
| 3. | 0.5338 | – | -1.8332 | – |
| 4. | 14.9487 | – | -46.6251 | – |
| 5. | 5.7354 | – | -2.7400 | – |
| 6. | 2.2127 | -2.1895 | ||
| 7. | 2.8864 | – | -1.4092 | – |
| 8. | 6.3741 | – | -0.6640 | – |
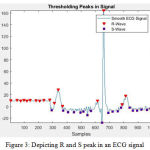 |
Figure 3: Depicting R and S peak in an ECG signal
|
Like normal flows turbulence is also governed by fundamental equations. Its space and time dependency with varied spatial degree of freedom is characterized by rotational and vorticity property. At very high Reynold number or very low viscosity, turbulence has set of localized structures known as coherent structures. It has been observed that N-S equation is a basic equation to be followed however it does not give any information about scales of motion, role of which can’t be neglected in getting physical insight into turbulent flows.
Current Scenario of Treatment
If a subject is diagnosed with AAA then surgeons will probably look into its size and the rate of growth. Generally, preliminary determination of size can determine the risk of rupture. If size of abdominal aorta exceeds by more than 50% of normal diameter then risk of rupture is 30% – 50% per year. Not only size but other factors such as growth rate, family history, aortic wall stress, chronic obstructive pulmonary disease, shape of aorta, hypertension, smoking, and sex combination of all these factors play roles in rupture. These factors can be monitored from the initial stage for dilatation process. Lower diameter of abdominal aorta can be evaluated by ultrasonography, imaging device that employs wavelet methodology. With the help of feasible methods and advanced 3D computer models, computed tomography’s reconstructed image data can evaluate AAA rupture risk. In some cases where patients do not show such symptoms but suffer from onset of unbearable abdominal pain may require sudden surgical intervene. This surgery can be endovascular or open abdominal surgery. Open abdomen is more invasive when compared to endovascular, and is mostly used for increased size or ruptured aneurysm. Endovascular is however encouraged for subjects who are at increased risk of open surgery, it basically stabilize the wall of aorta using graft mechanism. This technique however has certain complications like identifying accurate size of graft and delivering it in bifurcated blood vessel.
A study on 106 subjects with AAAs rupture case shows significant survival rate with endovascular [15] when treated by both methods open repair and endovascular. However, after few years mortality rate due to cardiovascular complications were same from either process. The hospital mortality rate after ruptured aneurysm is
about 75% including the rate of mortality occurring during surgery or after few hours of surgery. And survivors face limb and bowl loss with renal failure that require lifelong dialysis. From many studies and current evidences based on different cases shows that endovascular treatment has low risk with rare second intrusion when dealing with major complications and mortality [16].
Many literatures has been published in past few years- citing difference between endovascular and open repair [17], theories with clinical trial for limiting rate and growth of AAA, therapies and management, ultrasound screening policies and medication effect on AAA. Basically, lack of knowledge of specific mechanism of formation, development and rupture has hindered the invention of particular treatment and drugs. Several reviews and speculations are proposed by biomedical scientist to get the exact idea of involvement of various anatomy conditions and drugs [18]. By far now if proper planning that includes aneurysm measurement and appropriate graft selection is made then endovascular treatment is technically successful in current scenario [19].
Local physician and heart specialist also recommends endovascular surgery in almost all the cases as it is a novel approach for treatment of AAA. Within the sac of aneurysm anatomic seal is completed with the help of polymer technology. Various instrumentation procedure for endovascular repair such as wires, grafts, and access catheters are improved constantly on the basis of study and feedback.
Conclusion
Turbulence modelled by fluid dynamics equation is hard to solve as there exists unknown quantities (degrees of freedom) in large number as well as increasing complexities of the phenomenon occurring over the evolution of time. Numerical methods like finite difference, finite element and many more fail, reason being problems faced by modeling and simulation of the phenomena and computational ability of today’s computer.10 Many theories and experimental result shows that turbulence possesses some singularities in the vorticity and velocity field. In 1962 a scientist Kolmogorov formulated statistical theory of turbulence well known by Universal equilibrium theory and made some remarks saying that when the rate of energy dissipation is locally very large then there must be singularities in the derivations of the velocity field on a scale. Recently direct numerical solution of N-S equation has emerged the method for study and research. These solutions have become possible in the rapidly developing speed and memory of computers. Turbulence has therefore become a very lively area of scientific research and applications, in recent years.
Future Challenges
Over the past two decades aneurysm analysis has gone far better in understanding procedures and methods. Still there are some limitations involve with it that need more research work for future simulation methodologies. Some of the research area includes [20]: Examining surgical approaches, designing of new biomaterials for grafting, identifying genetic foundation, early detection approaches, awareness of treatment and diagnosis program for AAA. For these issues scientists from various fields require cumulative research work to address and provide solution to the above mentioned areas.
Reference
- Shengmao Lin and Linxia Gu; Effects of Turbulent blood flow on Abdominal Aortic Aneurysms: A fluid-structure Interaction study; International Mechanical Engineering Congress and Exposition; Biomedical and Biotechnology Engineering, California, USA, Nov 15-21, Vol. 3A, 2013. doi:10.1115/IMECE2013-63879.
CrossRef - Ge L., Kassab G.; Turbulence in the Cardiovascular System: Aortic Aneurysm as an Illustrative Example; In: Guccione J., Kassab G., Ratcliffe M. (eds) Computational Cardiovascular Mechanics. Springer, Boston, MA. Lokenath Debnath; Wavelet transforms and their applications; Birkhauser; 2002.
- Jean Mathieu, Julian Scott; An Introduction to Turbulent flow; Cambridge University Press; 2000.
CrossRef - Kai Schneider, Oleg V. Vasilyev; Wavelet Methods in Computational Fluid Dynamic; ANRV400-FL42-50, 2009.
- Farge M.; Wavelet transforms and their applications to turbulence; Annu. Rev. Fluid Mech. (1992).
- Gatski TB, Hussaini MY, Lumley JL.; Simulation and modeling of turbulent flows; Oxford University Press (1996).
- Daubechies; Ten lectures on wavelets; SIAM (1992).
- Dahmen W.; Wavelet and multiscale methods for operator equations; Acta umer (1997).
- Muller S.; Adaptive multiscale Schemes for Conservative laws; Lect. Notes. Comp. Sc. Engg; Springer-Verlag (2003).
CrossRef - Meneveau C.; Wavelet analysis of turbulence: The mixed energy cascade, in wavelets, fractals and Fourier transforms (1993).
- Welch JP, Ford PJ, Teplick RS, Rubsamen RM; The Massachusetts General Hospital –Marquette Foundation Hemodynamic and Electrocardiographic database – Comprehensive collection of critical care waveforms. J Clinical Monitoring 7(1); 96-97 (1991).
- Goldberger AL, Amaral LAN, Glass L, Hausdorff JM, Ivanov PCh, Mark RG, Mietus JE, Moody GB, Peng C-K, Stanley HE. Physio Bank, Physio Toolkit, and PhysioNet: Components of a new research resource for complex physiologic signals. Circulation 101(23):e215-e220; http://circ.ahajournasls.org/cgi/content/full/101/23/e215; June 2000.
CrossRef - Mahmoodabadi S.Z., Ahmadian A., Abolhasani M.D.; ECG feature extraction using Daubechies wavelets; Proc.of International conference visualization, imaging and image processing; Sept 7-9, 2005, Benidorm, Spain.
- Saum A Rahimi; Abdominal Aortic Aneurysm Treatment & Management; Vascular Surgery; Aug 16, 2017.
- Sercan Okutucu; Begum Yetis Sayin; HakanAksoy; Cengiz Sabanoglu; Ebru Akgul Ercan Ali-Oto; OP-610 – Endovascular Aneurysm Repair (Evar) in Different Cases: Sharing the Diverse Experience; The American Journal of Cardiology; Volume 121, Issue 8, Supplement, 15 April 2018, Pages e110-e111; https://doi.org/10.1016/j.amjcard.2018.03.257.
CrossRef - Amato B., Fugetto F., Compagna R., Zurlo V., Barbetta A., Petrella G., Aprea G., Danzi M., Rocca A., De Fraciscis S., Serra R.; Endovascular repair versus open repair in the treatment of ruptured aortic aneurysms. A systematic review; Edizioni Minerva Medica; May 2018; DOI: 23736/S0026-4733.18.07768-4.
- Haiying J., Sasaki T., Jin E. , Kuzuya M., Cheng X.; Inflammatory Cells and Proteases in Abdominal Aortic Aneurysm and its Complications; Current Drug Targets; May 2018.
- Dodos, I.A., Theodoridis, P., Staramos, D. et al.; Endovascular Repair of Isolated Abdominal Aortic Dissection. Literature Review; Hellenic J Surg (2018) 90: 85. https://doi.org/10.1007/s13126-018-0445-3
CrossRef - Wassef, Upchurch GR Jr., Kuivaniemi H., Thompson R.W. , Tilson M.D. 3rd; Challenges and opportunities in abdominal aortic aneurysm research; J Vasc Surg.;45(1):192-8; 2007.
CrossRef

