
Siba Shankar Beriha
Department of Pediatrics Sardar Vallavbhai Patel Post Graduate Institute of PaediatricsSCB Medical College Chandinchowk, Cuttack 753002, India.
Corresponding Author E-mail: dssb1975@gmail.com
DOI : https://dx.doi.org/10.13005/bpj/1474
Abstract
ADHD is one of the most prevalent psychiatric disorder of childhood, characterized by inattention and distractibility, with or without accompanying hyperactivity. The main aim of this research work is to develop a Computer Aided Diagnosis (CAD) technique with minimal steps that can differentiate the ADHD children from the other similar children behavioral disorders such as anxiety, depression and conduct disorder based on the Electroencephalogram (EEG) signal features and symptoms. The proposed technique is based on soft computing and bio inspired computing algorithms. Four non-linear features are extracted from the EEG such as Higuchi fractal dimension, Katz fractal dimension, Sevick fractal dimension and Lyapunov exponent and 14 symptoms which are most important in differentiation are extracted by experts in the field of psychiatry. Particle Swarm Optimization (PSO) tuned Back Propagation Neural Network (BPNN) and PSO tuned Radial Basis Function (RBF) employed as a classifier. By investigating these integrated features, we obtained good classification accuracy. Simulation results suggest that the proposed technique offer high potential in the diagnosis of ADHD and may be a good preliminary assistant for psychiatrists in diagnosing high risk behavioral disorders of children.
Keywords
ADHD; Bio-inspired Computing; Electroencephalogram; RBF; Soft Computing Algorithm
Download this article as:| Copy the following to cite this article: Beriha S. S. Computer Aided Diagnosis System to Distinguish Adhd from Similar Behavioral Disorders. Biomed Pharmacol J 2018;11(2). |
| Copy the following to cite this URL: Beriha S. S. Computer Aided Diagnosis System to Distinguish Adhd from Similar Behavioral Disorders. Biomed Pharmacol J 2018;11(2). Available from: http://biomedpharmajournal.org/?p=20701 |
Introduction
Neurodevelopmental Disorders (NDDs) are a group of disorders connected primarily with the working or functioning of the brain and neurological system. Examples of NDDs in children include autism, mental retardation, Attention Deficit Hyperactivity Disorder (ADHD), conduct disorder, anxiety, depression, impairments in vision and hearing and learning disability. Children with NDDs can face difficulties with behavior, learning, motor skills, memory, speech and language etc. While the behaviors and symptoms of NDDs often change as a child grows older, some disorders are permanent.1 If these disorders can be detected or identified at an early stage, it is possible to repair some damages caused by NDDs and can assist the people to maintain daily life.
ADHD is one of the most common NDDs of childhood that affect 3-7% of preschooler, characterized by inattention, impulsivity and/or hyperactivity.2 ADHD can make family relationship difficult, reduce vocational achievement and diminish academic performance. Diagnosis of ADHD is performed by utilizing Diagnostic and Statistical Manual of Mental Disorders (DSM-V) published by the American Psychiatric Association (APA), which provides list of sign and symptoms that experts use to decide whether or nor a person has a NDDs. ADHD is a disruptive behavior disorder that affects approximately 3-7% of children ages.4-16,3,4
Many researchers suggested that assessment of children with NDDs should be divided into many stages which includes interview with parents, child interview, physical examination and interview with teachers. These assessments could help the experts to obtain complete information about a child’s behavior.5,6 Some studies considered children behaviors at school and teachers’ ratings for identification of students with behavioral disorders.7,8 Some researches combined EEG and Magnetic Resonance Imaging (MRI) data to differentiate the children with behavioral disorders from the normal control children.9,10
Early diagnosis of behavior disorders in children is of the prime importance in preventing negative effects on children’s social interactions. Generally, the diagnosis of behavioral disorders is done based on the criteria provided in DSM-V, which are highly dependent on the parent’s and teachers’ interview. To address this issue, many researchers attempted to develop and employ more objective techniques such as MRI, EEG in the diagnosis of NDDs. In 1973, abnormalities study by EEG in behavioral disorders (ADHD) was first carried out by J.Lubar. He found that beta power decreased and theta activity increased in ADHD children.11 EEG is an effective method to provides information about the background activity of the brain. EEG plays an important role in the evaluation of behavioral disorders.
In 2012, Mona Delavarian et al.6 designed a design support system to distinguish children with ADHD from other similar children behavioral disorders such as depression, anxiety, comorbid depression and anxiety and conduct disorder based on the signs and symptoms. The authors used 38 symptoms as features. An accuracy of 95.50% and 96.62% achieved by multilayer and RBF networks respectively. The authors recommended to use EEG information in order to develop CAD system with more accurate diagnosis. There are many studies which used EEG analysis for diagnosing ADHD. In 2011, Muller et al.11 proposed a model using independent ERP components and Support Vector Machine (SVM) to differentiate ADHD adults from normal control patients and achieved an accuracy of 91%. In 2013, Nazhvani et al12 proposed a diagnostic system which uses N2 and P2 peaks of ERP to diagnose ADHD and obtained 92.9% accuracy. Armin Allahverdy et al.13 used EEG signal to discriminate ADHD children form normal children. The authors used four nonlinear features of EEG consist of Lyapunov exponent, Higuchi fractal dimension, Katz fractal dimension and Sevcik fractal dimension and achieved an accuracy of 96.7%. In 2016, Mohammadi et al.14 investigated 30 ADHD children and 30 normal control children using Fractal Dimension (FD), approximate entropy and Lyapunov exponent features. To increase the classification accuracy, Double Input Symmetrical Relevance (DISR) and minimum Redundancy Maximum Relevance (mRMR) methods were employed to select the best features as inputs to multi-layer perceptron neural network. An accuracy of 92.28% and 93.65% were achieved using mRMR method and DISR method using MLP respectively. Khoshnoud et al.15 used approximate entropy (ApEn), the largest Lyapunov exponent (LLE), and multifractal spectra to discriminate between children with ADHD and age-matched controls and obtained the accuracy of 83.33%.
A person with NDDs do not show suitable responses to environment stimulus according to her/his age. It must be exhibited mainly in two different places. One is the school related activities which affects the academic performance and another one is antisocial behaviors.5,6 Therefore, an early and accurate diagnosis of these disorders during primary school age is important. In this paper, ADHD, anxiety, depression and conduct disorder were selected from multiple NDDs due to their high incidence among children and adults. The proposed Computer Aided Diagnosis (CAD) technique uses Electroencephalogram (EEG) signal features, sign and symptoms for the classification system to distinguish children with ADHD from other similar behavioral disorders such as anxiety, depression and conduct disorder. Four non-linear features are extracted from the EEG such as Higuchi fractal dimension, Katz fractal dimension, Sevick fractal dimension and Lyapunov exponent and 14 symptoms which are most important in differentiation are extracted by experts in the field of psychiatry. Particle Swarm Optimization (PSO) tuned Back Propagation Neural Network (PSO-BPNN) and PSO tuned Radial Basis Function (PSO-RBF) employed as a classifier. Simulation results reveal that a CAD technique, especially PSO-BPNN outperforms than other classifiers considered for comparison. It may be a good preliminary assistant for an experts or psychiatrists in diagnosing NDDs.
The rest of the paper is structured as follows. Section 3 presents the proposed classification system. The simulation results and discussion will be given in the section 3. The conclusion and future enhancement will be reported in the section 4 followed by relevant references.
Materials and Methods
The main goal of this research work is to propose a CAD system for distinguishing ADHD children from other children with behavior disorders such as anxiety, depression and conduct disorder based on the severity of symptoms and EEG signal features. Proposed classification system consists of three phases: Selection of sign and symptoms, feature extraction from EEG and classification.
Selection of Sign and Symptom
Proposed CAD technique requires more number of children with NDDs such as ADHD, anxiety, depression and conduct disorder. For this purpose,15 elementary school were selected.5 out of 15 schools were particularly for children with disorders. Behavioral characteristics of the children were recorded and reported in three levels from 1 to 3 based on the severity of the symptoms. 1 for one day each week, 2 for 2 to 3 days each week and 3 for more than 4 days each week. This process takes 8 months and 297 children, including 68 children with ADHD,54 with anxiety, 49 with depression, 53 with conduct disorder and 73 normal control children. Table 1. shows the demographic details of subjects.
Table 1: Demographic details of the subjects
| ADHD | Anxiety | Depression | Conduct disorder | Normal |
| 68 | 54 | 49 | 53 | 73 |
Totally 60 repetitive symptoms were collected in a form from the combination of multiple sources of information including parents interview, teachers interview and some data resulted from children behavior in home and school. Among 60 sign and symptoms, some of them had overlap with DSM-IV criteria. So, 14 symptoms which were most important in differentiation were selected by some experts in the field of child psychiatry. Table 2 lists the selected sign and symptoms.
Table 2: Sign and symptoms
| Age | Explosiveness or irritability |
| Sex | Poor speech articulation |
| Inattention | Variableness and unpredictable mood |
| Fidgeting with hands or feet or squirming in seat | Destruction of their own property or that of others |
| Hyperactivity, running excessively in inappropriate situation | Bullying, Initiating physical fights toward peers |
| Disobedience | Persistent lying |
| Difficulty in awaiting turn | Annoying and cruel behavior toward people |
Eeg Feature Extraction
EEG data were collected based on 10 -20 standards by 19 channels (Fz, Cz, Pz, C3, T3, C4, T4, Fp1, Fp2, F4, F7, F8, P3, P4, T5, T6, O1, O2) with A1 and A2 are as reference electrodes located at earlobes. Eye movements was recorded by planning 2 electrodes above and below of the right eye. The recording was done in a noise free room. During EEG recording, participants were asked to have low movement in their head area in order to reduce the artifact effects. One the most important deficit in ADHD is visual attention,14,18 we design our EEG recording protocol according to the visual attention and mental task. Therefore, during EEG recording we showed some pictures to ADHD children which could be attractive to them such as cartoon characters. Totally twenty pictures were shown to ADHD children and after each image, they were asked to say how many objects were in the picture. The number of objects in each picture was randomly selected between 4 and 25. These pictures were displayed on a big monitor near the children. To have a continues stimulus, each picture was displayed immediately and uninterrupted after child’s response. Figure 1 shows an example of pictures used.
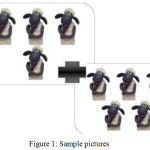 |
Figure 1: Sample pictures
|
Preprocessing
EEG data were digitized at the sampling rate of 256HZ preprocessing was done in MATLAB R 2016a. To remove the noise, EEG data were band pass filtered (0.1-80) Hz frequency and power line interference cancellation was performed out by a notch filter at 50 HZ. EEG data also visually analyzed by the physician or an expert to discard any artifacts. Finally, we had a EEG signal with a 30 second length out of 90 second on average of all individuals.
Feature Extraction
In this paper, four non-linear features are extracted from the EEG such as Higuchi fractal dimension, Katz fractal dimension, Sevick fractal dimension and Lyapunov exponent are extracted from EEG signal.
Higuchi Fractal Dimension
Higuchi’s method for calculating fractal dimension of trajectory is based on a different length of signal.14,15,16,19 For a given time series of the data to be analyzed, k new time series were constructed as below:

Where m is the initial data point; k is the interval to select the subsequent data points; and function int(x) is to take the integer part of x. For each new time series, its average length Lm(k) was defined as:
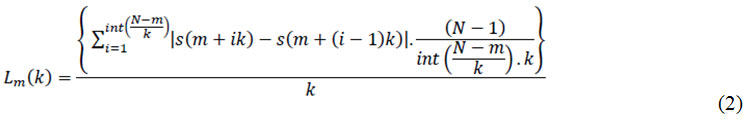
Where
![]()
is a normalization factor. The mean length of the original time series was calculated as the average of Lm (k):
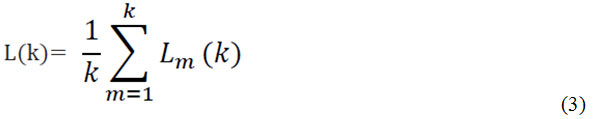
Since L(k) is proportional to k−FD for a fractal time series, FD of the signal was obtained in this study as the slope of the curve ln(L(k)) versus ln(1/k) using the least-squares linear best-fitting method.
Katz Fractional Dimension
In 1988 an approach for calculating the fractal dimension of the signal had been introduced by Katz.14,15,19,20 In this method, fractal dimension is defined as:
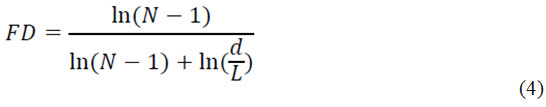
Where N is the number of points of data, L is length of data and d is diameter of data.
Sevick Fractal Dimension
For calculating Sevcik method in the first step, data should be normalized to be within a unit square by rescaling the abscissa (time axis)14,15,21 and the ordinate (EEG signal) of the data space:

Where s(i) ans s’(i’) are the original and normalized EEG signals of the ith data point, smax and smin are the maximal and minimal values of the signal and i=1, 2…, N is the serial number of the data points and i’ is the normalized one. Now fractal dimension can be calculated by the following equation:
Where L is the total length of the data section in the normalized coordinate system.
Lyapunov Exponent
Lyapunov exponent is a quantitative measure for chaotic systems. It is a measure of the rate of attraction and repulsion from a fixed point in state space. In another word, Lyapunov exponent is a measure of the divergence of nearby trajectories. The system’s behavior is chaotic if its average Lyapunov exponent is a positive number. Lyapunov exponent is used to determine the stability of any steady-state behavior.14,15,22 The wolf method will be used in this paper. In this approach at first step, a state space should be reconstructed and by selecting one point in this space, the nearest neighbor must be acquired. When the distance of initial condition and its nearest neighbor (L0) has been determined, the system will be evolved forward some fixed time (evolution time) and the new distance (Li) will be calculated. This evolution and calculating the successive distance will be repeated until the separation become greater than a certain threshold. Finally, Lyapunov exponent can be estimated using the following equation:
Where k is the number of time evolution.
Development of Classifier
BPNN is multilayer feed forward network and commonly used in medical field. BPNN consists of three layers namely an input layer, hidden layer and an output layer. It operates in two modes which are feed forward and back propagation. During feed forward mode, input signal is applied on the input layer then transferred to output layer through hidden layer. An error signal obtained between target and neuron output is transferred from output layer to input layer.17 BPNN with two hidden layers is depicted in Figure 2. Figure 3. shows the architecture of RBF. It has an input layer, a hidden layer and an output layer. Weights of both the networks are obtained by training in order to minimize the error. PSO algorithm is used to optimize the weights of both the classifier to achieve desired target.
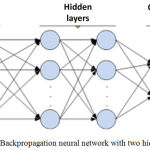 |
Figure 2: Backpropagation neural network with two hidden layers
|
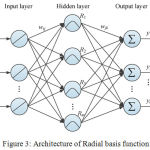 |
Figure 3: Architecture of Radial basis function
|
In this work, BPNN and RBF are employed to discriminate between normal control children and children with behavior disorders. To enhance the performance of both the classifiers, PSO algorithm is combined with BPNN and RBF named as PSO tuned BPNN and PSO tuned RBF respectively. PSO is one of the bio inspired computing algorithm used to optimize the parameters of BPNN and RBF to achieve the desired goal. Performance of the both the classifiers are evaluated using three evaluation parameters including classification accuracy, sensitivity and specificity. Furthermore, efficiency of PSO tuned BPNN is compared with PSO tuned RBF to find the suitable classifier.
Simulation Results And Discussion
To evaluate the proposed classifiers, 14 symptoms were collected in a form. Noise suppression was done on EEG signal. Non-linear features were extracted. The best classification accuracy is obtained by 15 hidden neurons for BPNN and 40 hidden neurons for RBF. The average classification accuracy of 99.8% achieved by PSO-BPNN. Efficiency of PSO-RBF and PSO-BPNN in terms of three statistical measures are listed in Table 3.
Table 3: Performance of the proposed classifiers ClassPSO -RBFPSO- BPNN
| Class | PSO -RBF | PSO- BPNN | ||||
| Sensitivity (%) | Specificity (%) | Accuracy (%) | Sensitivity (%) | Specificity (%) | Accuracy (%) | |
| Normal | 92 | 91 | 95 | 95 | 93 | 99 |
| ADHD | 90 | 89 | 97 | 100 | 100 | 100 |
| Anxiety | 88 | 90 | 94 | 98 | 96 | 100 |
| Depression | 93 | 96 | 100 | 100 | 100 | 100 |
| Conduct disorder | 86 | 90 | 95 | 100 | 100 | 100 |
From the Table 3, it is inferred that the performance PSO-BPNN is better than PSO-RBF. For 297 samples, 100% accuracy is obtained by PSO tuned BPNN for ADHD, anxiety, depression and conduct disorder. But, PSO tuned RBF showed an accuracy of 90% for ADHD,88% for Anxiety,93% for depression and 86% for conduct disorder. Figure.4 graphically compares the classification accuracy of PSO tuned RBFNN with PSO tuned BPNN on different number samples.
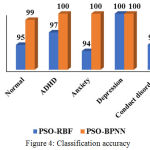 |
Figure 4: Classification accuracy
|
Conclusion
ADHD is a disorder that is most common in children and its early diagnosis is important to prevent complications. In this paper, a CAD technique was proposed to distinguish children with ADHD from other similar children behavioral disorders such as anxiety, depression and conduct disorder based on the symptoms and EGG signal features. PSO-BPNN and PSO-RBF performed the classification task. Experimental results proved that the fused features such as symptoms and non-linear features are appropriate to analyze and characterize the subjects.
References
- Centers for disease control prevention, “America’s children and environment”, third edition. 2015.
- Data and Statistics |ADHD | NCBDDD | CDC, Cdc.gov. [Online]. Available: http://www.cdc.gov/ncbddd/adhd/data.html. 2016.
- Diagnostic and Statistical Manual of Mental Disorders, American Psychiatric Association, Washington, DC. 2000.
- Marcano L. J., Bell M and (Louis) Beex A. A. Classification of ADHD and non-ADHD subjects using a universal background model”. Biomedical Signal Processing and Control. 2018;39:204–212.
CrossRef - Council for exceptional children, Report of the CEC Advocacy and Governmental relations Committee regarding the new proposed U.S Federal Definition of Serious Emotional Disturbance, Reston, VA: Author.1991.
- Delavarian M.,Towhidkhah F.,Dibajnia P and Gharibzadeh S. Designing a Decision Support System for Distinguishing ADHD from Similar Children Behavioral Disorders. Journal of Medical System. 2012;36:1335–134.
CrossRef - Musisi S., Kinyanda E., Nakasujja N and Nakigudde J. A comparison of the behavioral and emotional disorders of primary school-going orphans and non-orphans in Uganda. African Health Sciences. 2007;7(4):202–21
- Giannakopoulos G., Kazantzi M., Dimitrakaki C., Tsiantis J., Kolaitis G and Tountas Y. Screening for children’s depression symptoms in Greece: The use of the children’s depression inventory in a nation-wide school-based sample. European child & adolescent psychiatry. 2009;18:485–492
CrossRef - Giedd J. N., Castellanos F. X., Casey B. J., Kozuch P., King A. C., Hamburger S. D and Rapoport J. L. Quantitative morphology of the corpus callosum in attention deficit hyperactivity disorder. The American Journal of Psychiatry. 1994;151:665–669.
CrossRef - Murias M., Swanson J. M and Srinivasan R. Functional connectivity of frontal cortex in healthy and ADHD children reflected in EEG coherence. Cerebral Cortex. 2007;17:1788–1799
CrossRef - Lubar J. F. Discourse on the development of EEG diagnostics and biofeedback for attention-deficit/hyperactivity disorders. Biofeedback Self-Reg. 1991;6(3):201-25.
CrossRef - Mueller A., Candrian G., Grane V. A., Kropotov J. D., Ponomarev V. A and Baschera G. M. Discriminating between ADHD adults and controls using independent ERP components and a support vector machine: a validation study. Nonlinear biomedical physics. 2011;5.
CrossRef - Nazhvani A. D., Boostani R., Afrasiabi S and Sadatnezhad K. Classification of ADHD and BMD patients using visual evoked potential. Clinical neurology and neurosurgery. 2013;115:2329-2335.
CrossRef - Allahverdy A., Moghaddam K. A.,Mohammadi R. M and Nasrabadi M. A. Detecting ADHD Children using the Attention Continuity as Nonlinear Feature of EEG. Frontiers in Biomedical Technologies. 2016;3(1):28-33.
- Mohammadi M. R., Khaleghi A., Nasrabadi M. A.,Rafieivand S., Begol M and Zarafshan H. EEG Classification of ADHD and Normal Children Using Non-linear Features and Neural Network. Biomed Engineering Letters. 2016;6:66-7.
CrossRef - Khoshnoud S., Nazari A. M and Shamsi M. Functional brain dynamic analysis of ADHD and control children using nonlinear dynamical features of EEG signals. Journal of Integrative Neuroscience. 2017;1:1–14.
- Sivanandham S. N and Deepa S. N. Introduction to neural network using MATLAB 6.0. Tata McGraw Hill-edition. 2006.
- Fredriksen M., Dahl A. A., Martinsen E. W., Klungsoyr O., Faraone S. V and Peleikis D. E. Childhood and persistent ADHD symptoms associated with educational failure and long-term occupational disability in adult ADHD. ADHD Attention Deficit and Hyperactivity Disorders. 2014;6:87-99.
CrossRef - Higuchi T. Approach to an irregular time series on the basis of the fractal theory. Physica D: Nonlinear Phenomena. 1988;31:277-283.
CrossRef - Katz M. J. Fractals and the analysis of waveforms. Computers in biology and medicine. 1988;18:145-156.
CrossRef - Sevcik C. A procedure to estimate the fractal dimension of waveforms. arXiv preprint arXiv: 2010;1003:5266.
- Güler N. F., Übeyli E. D and Güler I. Recurrent neural networks employing Lyapunov exponents for EEG signals classification. Expert systems with applications. 2005;29:506-514.
CrossRef

