
Kishor P. Patil1 and Pankaj Kothavade2
1Senior Scientist, Zydus Research Center, Ahmedabad - 382210, India.
2Pharmacology Lab 1, Department of Pharmaceutical Sciences, Institute of Chemical Technology, Matunga, Mumbai-400019, India.Corresponding Author E-mail: kpatil_23@yahoo.com
DOI : https://dx.doi.org/10.13005/bpj/1376
Abstract
Diabetes mellitus is a group of metabolic disorder which is characterized by high plasma glucose level and near or complete deficiency of insulin. It is a complex disorder, currently affecting 422 million people worldwide. This study was designed to compare the efficacy of rosiglitazone and metformin in db/db mice and STZ-induced rat models. Diabetes was induced by streptozotocin in rats. All the STZ-induced rats were orally administered with either rosiglitazone (10 mg/kg/day) or metformin (500 mg/kg/day) for 10 days. Groups of genetically diabetic db/db mice were orally administered with either rosiglitazone (5 mg/kg/day) or metformin (150 mg/kg/day) for 10 days. Fasting plasma glucose, serum insulin, body weight, cholesterol, triglyceride, serum glutamic pyruvic transaminase (SGPT) and serum glutamic-oxaloacetic transaminase (SGOT) were measured at 0, 5, 7 and 10 days after treatment using a Hitachi 7350 Auto analyzer. Serum insulin was measured p by enzyme-linked immunosorbent assay (ELISA). Our results indicated that fasting blood glucose levels in all the treatment groups were decreased substantially. A substantial decline in plasma glucose level was identified in rosiglitazone group (240.75 mg/dL ± 24.27, P<0.05 vs control- 541.65 mg/dL) as compared to metformin group (304.35 mg/dL ±33. 34, P<0.05) in db/db mice. A significant reduction in serum insulin was observed in rosiglitazone group (15.88 ng/mL ± 2.89, p<0.05 vs control- 32.65 ng/mL) and cholesterol level (52.35 ± 5. 48 mg/dL, p<0.05) compared with control (32.65 ng/mL ± 4.66 and 129.48 ± 15.82 mg/dL) in db/db mice. Moreover, significantly (p<0.05) decrease in plasma glucose (467.6 ± 56.90 mg/dL, p<0.05) and serum insulin (27.05 ± 7.56 ng/mL, p<0.05) level were observed in the metformin group compared with the diabetic control group (649.55 ± 80.26 mg/dL and 37.68 ± 4.66 ng/mL) into STZ-induced diabetic rats. Results suggest that, rosiglitazone is more efficacious than metformin on the lipid-lowering and plasma glucose profile in db/db mice. In contrast, metformin is more efficacious than rosiglitazone in STZ-induced diabetic rat model with respect to antihyperglycemic effect.
Keywords
Diabetic db/db Genetically Obese Mice; Mice Insulin Resistance; Metformin; Rosiglitazone; Streptozotocin-Induced Diabetes;
Download this article as:| Copy the following to cite this article: Patil K. P, Kothavade P. Comparison of Rosiglitazone and Metformin in Genetically Obese and Diabetic db/db Mice and Streptozotocin-Induced Diabetic Rat Models. Biomed Pharmacol J 2018;11(1). |
| Copy the following to cite this URL: Patil K. P, Kothavade P. Comparison of Rosiglitazone and Metformin in Genetically Obese and Diabetic db/db Mice and Streptozotocin-Induced Diabetic Rat Models. Biomed Pharmacol J 2018;11(1). Available from: http://biomedpharmajournal.org/?p=19590 |
Introduction
Diabetes mellitus is a chronic metabolic disorder which is represented with an incidence of hyperglycaemia, glucose intolerance and lack of insulin.1 According to World Health Organization (WHO), India have 69.2 million people living with diabetes (8.7%), most of these patients remained undiagnosed in more than 36 million people.2 According to World Health Organization, an estimated 422 million adults were living with diabetes in 2014 across the globe.3,4 Diabetes is considerably increasing the socio-economic loss to patient and their families, health systems and national economies through direct medical costs and loss of work and wages.5
In type-2 diabetes mellitus, different oral hypoglycaemic agents are used which are responsible for the following actions: a) stimulation of the pancreatic beta cells b) optimize the sensitivity of peripheral insulin receptors.6, 7 The thiazolidinedione (TZD) class of drugs are potent peroxisome proliferator-activated receptor gamma (PPARγ) agonists used in therapy of type 2 diabetes and other insulin resistance states. Rosiglitazone is being used for the treatment of type-2 diabetes mellitus, it is an insulin-sensitizer from the thiazolidinedione class, which promotes the sensitivity of tissues to insulin and diminish insulin resistance.3
Metformin is a widely used antihyperglycemic agent for the treatment of type 2 diabetes. As it lowers blood glucose without increasing insulin secretion, metformin has been considered an insulin sensitizer.8 In addition, metformin has a favourable impact on lipid profile by decreasing plasma triglyceride and low-density lipoprotein (LDL) cholesterol levels.9,10
Furthermore, it is very important to understand the pathogenesis, appropriate animal model for type 1 diabetes mellitus (T1D)/type 2 diabetes mellitus (T2D) and possible therapeutic agents comprehensively. Therefore, there is need to understand the suitable animal models for T1D and T2D mellitus meticulously. Hence, an animal model should develop signs of diabetes mellitus which are similar with human diabetes.11 The db/db mouse becomes hyperinsulinemic, hyperglycemic and obese.12 Thus, this model will help to understand the similarity of human T2D.11 In addition, the STZ-induced model is not important when evaluating the mechanisms by which hyperglycemia may augment to microvascular problems. Thus, db/db mouse is more relevant model than STZ or neonatal STZ rat model which shows human T2D characteristics. Metformin has been extensively studied in STZ-induced rat model.10 However, currently very few studies on the effect of metformin in db/db mice model are available. Therefore, the present experiment was designed to compare the antidiabetic effect of rosiglitazone and metformin in db/db mice model and STZ-induced diabetic rats models.
Objectives
The primary objective of present study was to compare the efficacy of rosiglitazone and metformin in db/db mice and STZ-induced rat models.
Methods
Test Substances
The following drugs were used in this study: Streptozotocin (Sigma Aldrich, USA), Rosiglitazone (Nicholas Piramal Research Center, Mumbai, India), insulin ELISA kit (Linco Research, MO, USA), Metformin (Sigma Aldrich, USA), 0.1 M citrate buffer (PH-4.5) and 0.5% Carboxymethylcellulose.
Diabetes Induction
Diabetes was produced by a single intraperitoneal (i.p) injection of streptozotocin at a dose of 60 mg/g, freshly dissolved in citrate buffer (0.1 M, PH=4.5). After 72 hours, induction of diabetes was identified by assaying plasma glucose level.
Animals
Twenty-four male Wistar rats weighing 170–190 g, (6 weeks old), from Nicholas Piramal Research Center, Mumbai, India, were used after acclimatization for 7 days. The male Wistar rats were used for STZ-induced diabetic rat model. Additionally, twenty-four female C57BL/6J db/db mice weighing 39–41 g, from Nicholas Piramal Research Center, Mumbai, India, were used for db/db mice model. All the animals were kept in controlled environment and fed ad libitum throughout the study. All the animals were housed in stainless steel cages in an air-conditioned room with 12 hours light, 12 dark cycles in specific pathogen free condition. Following an overnight fast, whole blood was obtained from the retro-orbital venous plexus. The protocol of the experiment was approved by the Institutional Ethical Committee of Nicholas Piramal Research Center.
Animal Grouping
db/db Mice Model
The db/db mice were divided into groups of three with blood glucose levels more than 280 mg/dL. The control and experimental groups were assigned as follow;
Group I: Control treated with vehicle
Group II: Rosiglitazone 5 mg/kg/day per oral (PO)
Group III: Metformin 150 mg/kg/day PO
Streptozotocin-Induced Diabetic Model
Diabetes was induced by single intraperitoneal injection of STZ (60 mg/kg) which was freshly prepared in normal 0.9% saline. Diabetes was induced in all groups. After diabetes induction, treatment was given for 10 days. All animals were divided into following groups.
Group I: STZ-induced diabetic control treated with vehicle
Group II: Diabetic rats treated with rosiglitazone 10 mg/kg/day PO
Group III: Diabetic rats treated with metformin 500 mg/kg/day PO
Collection of Biological Samples and Analysis
At the end of treatment, blood was collected retro-orbital plexus under anesthetic conditions. Plasma obtained from sodium EDTA-containing collection tubes and serum were separated by centrifugation at 3000 rpm for 15 min and stored at −20°C until the analysis was carried out.
The plasma glucose, serum insulin, body weight, cholesterol, triglyceride, serum glutamic pyruvic transaminase (SGPT), and serum glutamic-oxaloacetic transaminase (SGOT) were measured at 0, 5, 7 and 10 days during the treatment schedule. All parameters were measured by Hitachi 7350 Auto Analyzer (Hitachi, Tokyo, Japan). An enzyme-linked immunosorbent assay kit (Linco research, USA) was used to determine the serum insulin level.
Statistical Analysis
Data are presented as mean ± S.E.M. Statistical analysis was performed with analysis of variance. The data were analyzed using one-way ANOVA, followed by Dunnett’s test and p < 0.05 was considered statistically significant.
Results
Effects in db/db Mice (T2DM model)
Plasma Glucose
In control group, fasting plasma glucose levels of mice were significantly greater than those with rosiglitazone and metformin treated mice. The changes in plasma glucose level after treatment at day 0 to day 10 are shown in figure 2. A significant decrease in plasma glucose level was observed in rosiglitazone group (240.75 mg/dL ± 24.27, P<0.05)) as compared to metformin group (304.35 mg/dL ± 33.34).
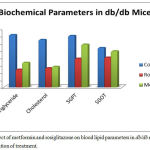 |
Figure 1: Effect of metformin and rosiglitazone on blood lipid parameters in db/db mice on day 10 after initiation of treatment.
|
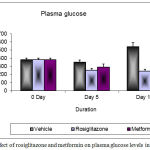 |
Figure 2: Changes in plasma glucose levels after 10 days treatment in db/db mice
|
Body Weight
At day 10, there was slightly increased in a body weight in rosiglitazone group (40.95 g ± 0.93) as compared to metformin (37.7 g ± 1.11) and vehicle treated groups (37.6 g ± 0.92). The administration of rosiglitazone resulted in a weight gain because it taken up and stored free fatty acid in the adipocytes and it produces differentiation of adipocytes in small groups (Figure 3).
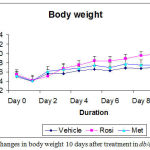 |
Figure 3: Changes in body weight after 10 days treatment in db/db mice
|
Lipid Profile
The plasma triglyceride, cholesterol, SGPT and SGOT levels of control mice were significantly greater than those with rosiglitazone and metformin treated mice. Significant decrease in triglyceride and cholesterol levels were observed in rosiglitazone group as compared to metformin group. At day 10, there was slight increase in the level of SGPT in rosiglitazone group as compared to metformin group (Figure 1).
Organ Weight
The liver weight was increased in the rosiglitazone treated group (2.43 g ± 0.14) and metformin treated group (2.40 g ± 0.16) as compared to vehicle treated group (2.19 g ± 0.06). The changes in organ weight after treatment at day 10 are shown in table 1.
Table 1: Effect of metformin and rosiglitazone on organ weight in db/db mice on day 10 after initiation of treatment.
| Group I (n=8) | Group II (n=8) | Group III (n=8) | |
| Treatment | Control
(vehicle 0.9% CMC) |
Rosiglitazone
(5 mg/kg/day) |
Metformin
(10 mg/kg) |
| Liver, g | 2.19 ± 0.06 | 2.43 ± 0.14 | 2.40 ± 0.16 |
| Spleen, g | 0.2199 ± 0.10 | 0.11 ± 0.01 | 0.10 ± 0.004 |
| WAT,g | 1.26 ± 0.08 | 1.40 ± 0.18 | 1.10 ± 0.10 |
| Kidney, g | 0.2635 ± 0.02 | 0.251 ± 0.009 | 0.275 ± 0.008 |
| Heart, g | 0.1277 | 0.13 | 0.124 |
All value expressed as mean ± S.E.M.
Serum Insulin
The changes in serum insulin level after treatment at day 0 to day 10 are shown in figure 4. A significant decrease in insulin concentration was observed in rosiglitazone group (15.88 ng/mL ± 2.89) as compared to vehicle treated group (32.65 ng/mL ± 4.66) and metformin group (21.05 ng/dL ± 3.54).
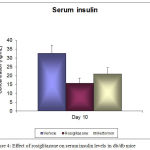 |
Figure 4: Changes in insulin levels after 10 days treatment in db/db mice
|
Effects in STZ- rat (T1DM model)
Plasma Glucose
The changes in plasma glucose level after treatment at day 10 are shown in table 2. A substantial decrease in plasma glucose level was detected in metformin group (348.3 mg/dL ± 54.70) as compared to rosiglitazone group (467.6 mg/dL± 56.90) and vehicle treated group (649.55 mg/dL ±80.26). Thus, it was revealed that the metformin was more efficacious as compared to rosiglitazone in STZ-induced rat model.
Table 2: Effect of of metformin and rosiglitazone on body weight, glucose, insulin and blood lipid parameters in streptozotocin-induced diabetic rats on day 10 after initiation of treatment.
| Group I (n=8) | Group II (n=8) | Group III (n=8) | |
| Treatment | Control
(vehicle 0.9% saline) |
Rosiglitazone
(10 mg/kg/day) |
Metformin
(500 mg/kg) |
| Body weight, g | 129.62 ± 6.92 | 157 ± 10.93 | 165.24 ± 11.14 |
| Plasma glucose, mg/dL | 649.55 ± 80.26 | 467.6 ± 56.90 | 348.3 ± 54.70 |
| Plasma triglyceride, mg/dL | 157.82 ± 22.81 | 89.02 ± 14.03* | 78.30 ± 9.86** |
| Cholesterol, mg/dL | 122.48 ± 17.82 | 76.09 ± 7.39* | 58.33 ± 7.08** |
| SGPT, mg/dL | 145.49 ± 19.78 | 136.44 ± 26.14 | 71.25 ± 18.13** |
| SGOT, mg/dL | 104.36 ± 22.13 | 80.23 ± 10.23* | 74.24 ± 13.10* |
| Serum insulin, ng/mL | 37.68 ± 4.66 | 27.05 ± 7.56 | 19.98 ± 4.89* |
Statistical analysis was by a one-way ANOVA followed by Dunnett’s test.
*p < 0.05, **p < 0.01. All value expressed as mean ± S.E.M.
Lipid Profile
The lipid profile of metformin and rosiglitazone in STZ-induced rats is presented in table 2. The plasma triglyceride, cholesterol, SGPT and SGOT levels of control STZ-induced rats were significantly greater than those with rosiglitazone and metformin treated rats. Significant decreases in triglyceride and cholesterol levels were noticed in metformin group as compared to rosiglitazone group.
Serum Insulin
The serum insulin level after treatment at day 10 is shown in table 2. A significant decrease in insulin concentration was noted in metformin group (19.98 ± 4.89 ng/mL) as compared to vehicle treated group (37.68 ng/mL ± 4.66) and rosiglitazone group (27.05 ng/dL ± 7.56).
Discussion
Streptozotocin-induced diabetes is a reliable model of experimental diabetes. There was an extensive increase in the fasting plasma glucose, triglyceride and cholesterol levels in the streptozotocin-induced diabetic group. The present study results are consistent with results of previously published studies 13,14
In this study we revealed that 10-day rosiglitazone administration in a db/db mice model markedly decreases its plasma glucose and cholesterol, diminishes the liver triglyceride depots, serum insulin concentrations. These results are consistent with several published results.15,16 Furthermore, the metformin treated group in STZ-induced rat model prompted a substantial decline in plasma glucose levels agree with several published results.10,17 However, there are very few studies on the effect of metformin in db/db mice model. Therefore, the present experiment was planned to compare the efficacy of rosiglitazone and metformin in db/db mice model and STZ-induced diabetic rat models.
On the other hand, the rosiglitazone was showed 55.6% of glucose lowering effect in the db/db mice model as compared to the vehicle treated group. Furthermore, the rosiglitazone is the insulin sensitizer; it increases the sensitivity of the insulin to the target tissues such as the liver, adipose tissue and muscle. Moreover, thiazolidinediones are insulin sensitizer which stimulates adipocyte differentiation. These differentiated adipocytes are more insulin-sensitive. Therefore, insulin is more effective and there is less need for the β-cells increases the secretion of insulin and glucose level manages according to insulin level.15
In present study, it was observed that the metformin was exhibited 43.8% of glucose lowering effect in the db/db mice model. This glucose lowering effect is triggered because of hepatic gluconeogenesis inhibition; so glucose is not synthesized in the liver and it reduced the glucose level in blood cell.
Furthermore, it was noted that rosiglitazone was associated with increased body weight as compared to metformin. This weight gain effect is due to binding of rosiglitazone to the PPAR-γ receptor; it taken up free fatty acid and triglyceride and stored it in the adipocyte; so body weight gain occurred in rosiglitazone treated group. These results are consistent with several animal studies.15,18
Moreover, we measured organ weight in this study, there were no significant differences in the organ weight of liver, spleen, kidney, heart and white adipose tissue in all the groups (Vehicle, Rosiglitazone and Metformin treated groups).
Several literatures have mentioned that rosiglitazone significantly reduces serum levels of insulin.15,19 In present study, the rosiglitazone also significantly reduced the serum levels of insulin (P<0.05) in db/db mice model. This reduction of insulin is occurred due to insulin resistant model. The db/db mice model is an insulin resistance model; there is more amount of insulin that is synthesized and the concentration of insulin is increased and it produces the resistance to the normal action of insulin. Additionally, rosiglitazone acts as the insulin sensitizer and it reduced the level of insulin in db/db mice model.
In the results of STZ-induced rat model for plasma glucose level; it was revealed that the metformin is more significant as compared to rosiglitazone treated group. The metformin showed 35.46% of glucose lowering effect in the streptozotocin-induced diabetic rat model. On the other hand, the rosiglitazone exhibited only 17.25% of glucose lowering effect in the STZ-induced rat model. This effect may be observed due to different actions of rosiglitazone and metformin; rosiglitazone shows its pharmacological activity in presence of insulin because it acts as an insulin sensitizer; however, rosiglitazone is less potent in absence of insulin. On the other hand, metformin is pharmacologically active irrespective of insulin concentration and it works very well in STZ-induced diabetic rat model without the presence of insulin.
According to report of the International Diabetes Federation, the prevalence of metabolic syndrome will be increasing in recent years. Therefore, it is very important to understand and define the genetic model which represents a valuable tool for such studies.
In this study, we evaluated two different models of T1D and T2D, one demonstrating insulin-dependent diabetes (STZ-induced ) and the other showing key features of an apparent T2D (db/db model). There are various pharmacological therapies being studied to prevent the diabetes, obesity and insulin resistance disorders, our results are intended to provide a convenient resource for choosing a db/db mice model that best mimics and demonstrates the characteristics of human type 2 diabetes mellitus to be studied.
Conclusions
In conclusion, results from this experiment indicate that rosiglitazone has more beneficial effect on plasma glucose, insulin and lipid profiles in db/db mice as compared with metformin and metformin is more efficacious drug as compared to rosiglitazone in terms of plasma glucose level reduction in the STZ- induced diabetic rat model. Thus, it is concluded that the rosiglitazone is more efficacious in db/db mice animal model and metformin is more efficacious than rosiglitazone in STZ-induced diabetic rat model in terms of its glucose lowering effect.
Conflicts of Interest
There is no conflict of interest.
Acknowledgments
The authors would like to thank Dr. Rosalind A Marita for technical assistance. The authors also thank the staff of the Nicholas Piramal Research Center.
References
- Piero M. N., Nzaro G. M., Njagi J. M. Diabetes mellitus – a devastating metabolic disorder. Asian Journal of Biomedical and Pharmaceutical Sciences. 2014;04(40):1-7.
CrossRef - http://www.searo.who.int/india/mediacentre/events/2016/en/. Accessed on 01-Feb-2018.
- El-Batran S. A., Abdel-Salam O. M., Nofal S. M., Baiuomy A. R. Effect of rosiglitazone and nateglinide on serum glucose and lipid profile alone or in combination with the biguanide metformin in diabetic rats. Pharmacological research. 2006;53:69-74.
CrossRef - Gad M. Z., Ehssan N. A., Ghiet M. H., Wahman L. F. Pioglitazone versus metformin in two rat models of glucose intolerance and diabetes. Pakistan journal of pharmaceutical sciences. 2010;23:305-312.
- Png M. E., Yoong J., Phan T. P., Wee H. L. Current and future economic burden of diabetes among working-age adults in Asia conservative estimates for Singapore from 2010-2050. BMC public health. 2016;16:153.
CrossRef - Lebovitz H. E. Oral therapies for diabetic hyperglycemia. Endocrinology and metabolism clinics of North America. 2001;30:909-933.
CrossRef - Reusch J. E. Focus on insulin resistance in type 2 diabetes: therapeutic implications. The Diabetes educator. 1998;24:188-193.
CrossRef - Hundal R. S., Inzucchi S. E. Metformin new understandings, new uses. Drugs. 2003;63:1879-1894.
CrossRef - DeFronzo R. A. Pharmacologic therapy for type 2 diabetes mellitus. Annals of internal medicine. 1999;131:281-303.
CrossRef - Setter S. M., Iltz J. L., Thams J., Campbell R. K. Metformin hydrochloride in the treatment of type 2 diabetes mellitus a clinical review with a focus on dual therapy. Clinical therapeutics. 2003;25:2991-3026.
CrossRef - Cefalu W. T. Animal Models of Type 2 Diabetes Clinical Presentation and Pathophysiological Relevance to the Human Condition. ILAR J. 2006;47(3):186-98.
CrossRef - Bates S. H., Kulkarni R. N., Seifert M., Myers M. G Jr. Roles for leptin receptor/STAT3-dependent and -independent signals in the regulation of glucosehomeostasis. Cell Metab. 2005;1(3):169-78.
CrossRef - Rao B. K., Kesavulu M. M., Giri R., Rao C. A. Antidiabetic and hypolipidemic effects of Momordica cymbalaria Hook. fruit powder in alloxan-diabetic rats. Journal of ethnopharmacology. 1999;67:103-109.
CrossRef - Platel K., Srinivasan K. Effect of dietary intake of freeze dried bitter gourd (Momordica charantia) in streptozotocin induced diabetic rats. Die Nahrung. 1995;39:262-268.
CrossRef - Wagstaff A. J., Goa K. L. Rosiglitazone a review of its use in the management of type 2 diabetes mellitus. Drugs. 2002;62:1805-1837.
CrossRef - Iozzo P., Hallsten K., Oikonen V., et al. Effects of metformin and rosiglitazone monotherapy on insulin-mediated hepatic glucose uptake and their relation to visceral fat in type 2 diabetes. Diabetes care. 2003;26:2069-2074.
CrossRef - Seufert J., Lubben G., Dietrich K., Bates P. C. A comparison of the effects of thiazolidinediones and metformin on metabolic control in patients with type 2 diabetes mellitus. Clinical therapeutics. 2004;26:805-818.
CrossRef - Seda O., Kazdova L., Krenova D., Kren V. Rosiglitazone improves insulin resistance, lipid profile and promotes adiposity in a genetic model of metabolic syndrome X. Folia biologica. 2002;48:237-241.
- Balfour J. A., Plosker G. L. Rosiglitazone. Drugs. 1999;57:921-930. discussion 931-922.

