
Shaniba Asmi P, Kamalraj Subramaniam and Nisheena V. Iqbal
Department of Electronics and Communication Engineering, Karpagam university, Coimbatore India.
Corresponding Author E-mail: shanibasmi@gmail.com
DOI : https://dx.doi.org/10.13005/bpj/1381
Abstract
Early diagnosing is one of the important perinatal challenges for the prevention of preterm birth. The electrohysterogram (EHG) or uterine electromyogram (Uterine EMG), collected from the abdominal surface is considered as a biomarker for the prediction or preterm labor. Several features and classifiers have been analyzed in different studies. Four classifiers were applied to two fractal features , say, Higuchi Fractal dimension(HFD) and Detrended Fluctuation Analysis (DFA), after filtering with fourth order band pass filter. The best classification accuracy (95.7989%) was obtained with Elman neural network classifier, when classified DFA feature, with sensitivity 0.9445 and specificity 0.9715.
Keywords
Electrohysterogram Uterine; EMG; Sensitivity
Download this article as:| Copy the following to cite this article: Shaniba A. P, Subramaniam K, Iqbal N. V. Classification of Fractal features of Uterine EMG Signal for the Prediction of Preterm Birth. Biomed Pharmacol J 2018;11(1). |
| Copy the following to cite this URL: Shaniba A. P, Subramaniam K, Iqbal N. V. Classification of Fractal features of Uterine EMG Signal for the Prediction of Preterm Birth. Biomed Pharmacol J 2018;11(1). Available from: http://biomedpharmajournal.org/?p=19013 |
Introduction
Premature birth that is birth before 37 weeks of gestation is the leading course for morbidity and mortality of babies. Even babies born few weeks early have higher rates of hospitalization and illness than term babies. Researches are going on for identifying the cause for preterm birth. Some of the reasons are mother’s poor health, infectious diseases and lack of proper health care resources.1 Multiple birth and babies in later life also leads to preterm birth. Early prediction of premature birth can be used for proper treatment. Electromyography is one of the non invasive and accurate techniques to acquire electrical activity of the body. Uterine EMG or EHG acquired from the abdominal surface of pregnant women are used to predict the time of delivery.
Earlier studies on prediction of preterm birth using fractal features such as DFA and FD were classified using statistical test, ANN etc. Fractal dimension of wavelet transformed uterine EMG was analyzed and average FD value was compared using t test in.2 The result shows significant difference between average FD of labor patients and antepartum patients. A combined algorithm was proposed in.3 The signal preprocessed first to eliminate noise and high frequency component, then fractal value calculated. Two techniques, phase space reconstruction and singular value decomposition were used to identify the abnormal value for distinguishing the contraction patterns. Classification accuracy of 64.1% was obtained with Artificial neural network which used 11 preterm labor and 28 term labor signals. In4 Detrended Fluctuation Analysis (DFA) of uterine EMG recordings of 11 pregnant and laboring women was used for analysis. DFA is a scaling analysis method that quantifies a simple parameter to represent the correlation properties of a time series. Good statistical significant with confidence level of 95% were indicated with t test.
The aims of this paper is to apply DFA and HFD in time and frequency domain on uterine EMG signals recorded on 38 preterm labor and 38 term labor. Four classifiers are used to discriminate between term and preterm labor. In this paper section I, introduce the work, section II explains the data used and methodology, section III discusses the results and finally conclusion in section IV.
Materials and Methods
Data Requisition
The EHG records used in this research were downloaded from Physionet database in the Term Preterm Electrohysterogram database (TPEHG DB), which were collected at the Department of Obstetrics and Genecology, medical centre Ljubljana, Solvenia from 1997 to 2005. The records are of 30 minutes duration with three channels. The records were collected from the abdominal surface using four AgCl2 electrodes with sampling frequency 20Hz.5 The electrodes were placed above the naval spaced 7cm apart symmetrically in two rows as in figure 1. The first channel acquires signal from electrodes E2-E1, second from E2-E3 and third from E4-E3. Randomly selected 38 term and 38 pretem records were used in this work. Each record was segmented with window size of 1200. The signal then analyzed with 75% and 50% overlap and also without overlap.
![Figure 1: The electrode placement on the abdomen above the uterine surface [6]](https://biomedpharmajournal.org/wp-content/uploads/2018/02/Vol11No1_Cla_Sha_fig1-150x150.jpg) |
Figure 1: The electrode placement on the abdomen above the uterine surface [6]
|
Pre-processing
The raw signal consists of noise and may be corrupted during recording. This has to be removed using band pass filter. The EHG signal range is from 0 to 3- 5Hz. Electrical signal due to voluntary contractions of the abdominal skeletal muscles have frequency component of about 30 Hz. Respiratory artifacts mainly distributed between 0.20 and 0.34 Hz.7 To eliminate these lower cut off frequency was kept at 0.34Hz and upper cut off frequency selected as 3Hz. Fourth order Butterworth and Elliptic band pass filters were considered for pre processing the segmented signal.
Fractal Feature Extraction
A pattern with the repetition embedded in it is called fractal. If the repetition exactly same at every scale, it is called a self similarity pattern. In real life this phenomenon are nearly identical at different scale.8 Higuchi fractal dimension (HFD) and Detrended fluctuation analysis(DFA) are the two features analyzed in this work. These features are extracted from segmented time and frequency domain signal after pre processing.
Higuchi Fractal Dimension
It is one of the more accurate and consistent estimation algorithms of fractional dimension for non periodic and irregular time series physiological signals. The algorithm computes the mean length of the curve of a time series by constructing a set of new time series. The new time series are based on the consideration of phase distribution, which can reveal strong effects of the irregularity of time series.9 Consider the time series signal X of length N
X = (x1, x2,..,xN) (1)
Let β and k be positive integers, where β = 1,2,..,k
Then k new time series can be generated using the equation below
![]()
Where
![]()
is the floor function that rounds
![]()
to the largest integer not exceeding
![]()
β and k represents the initial time point and time interval respectively, for k time interval k sets of time series will be there. The length of the curve associated with each time series is given by

where

represent normalized factor. Equation (3) the mean
![]()
of the lengths associated to the time series. If this value follows a power law:
![]()
then the curve is fractal with dimension D.
Detrended Fluctuation Analysis
It is a method for determining the statistical self affinity of a signal and useful for analysing time series that appear to be long memory processes. The technique helps to identify hidden dynamical patterns, which would yield important insights into underlying physiological mechanisms. Thus it is suitable for the study of power law long range correlation present in various non stationary time series. The main advantage of the DFA is that it can systematically eliminate trends of various order caused by external effects. Thereby eliminates noise caused by imperfect measurement.
Let x (i) be the time series of total length N, whose fluctuation are to be calculate. A new integrated series y (k) was first obtained from the original series x (i) as
![]()
where
![]()
is the mean of x (i) that is,
![]()
Next this time series is divided into boxes of equal length n. In each box of length n, a polynomial function of degree m is used to interpolate the sequence in each box. The polynomial yn (k) represent the local trend in each box. The local trend of each window is subtracted from the integrated series. The fluctuation function F (n) is then calculated as the root mean square of detrended time series as a function of the box size n.10

Four classifiers are considered in this work. They are Linear discriminating analysis (LDA), Support vector machine (SVM), Probabilistic neural network (PNN), Elman neural network (ENN). The ENN classifier out performs other classifiers.
Elman neural network is a three layer network arranged horizontally as in figure 2. In addition to the three layers there is a context unit, which is connected to the middle hidden layer fixed with a weight of one. For each time step, the input is fed forward and then a learning rule is applied. The fixed back connections store the previous values of the hidden units in the context units, as they propagate over the connection before the learning rule is applied. Thus the network can maintain a state that allows it to perform a sequence prediction.11 The hidden layer vector ht is given by the equation
ht = σh (Wh xt + Uh ht-1 + bn) (7)
yt = σy (Wy ht + by) (8)
Where, xt is the input vector,
ht is the hidden layer vector,
yt is the output vector,
W, U and b are the parameter matrixes, and vector oh and σy are activation function. Activation function used in this work 1 and 0 for preterm and term respectively.
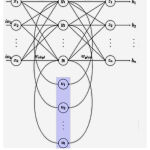 |
Figure 2: The structure of Elman Neural Network
|
Results and Discussion
The data recorded for 76 women that is, 38 preterm records and 38 term records, were taken for the study. The results in this section are by considering all the three channels as it out-perform other combinations of channels. The classification accuracy of four classifiers with HFD and DFA features are summarized below.
Table 1: Classification accuracy of Higuchi fractal dimension in time domain
| Feature | Higuchi Fractal dimension, window size :1200 | |||||
| Doman | Time | |||||
| Filter | Butterworth | Elliptic | ||||
| % of overlap | 75 | 50 | 0 | 75 | 50 | 0 |
| LDA | 57.3893 | 57.6462 | 57.8078 | 66.0165 | 65.8921 | 65.7658 |
| SVM | 55.6010 | 55.6972 | 55.7057 | 60.9527 | 60.8696 | 60.8108 |
| PNN | 50.2626 | 50.3748 | 53.1532 | 55.7764 | 55.0225 | 56.0571 |
| ENN | 63.6159 | 58.9955 | 58.8589 | 80.1575 | 80.0600 | 78.6787 |
Table 2: Classification accuracy of Detrended fluctuation analysis in time domain
| Feature | Detrended fluctuation analysis, window size :1200 | |||||
| Domain | Time | |||||
| Filter | Butterworth | Elliptic | ||||
| % of overlap | 75 | 50 | 0 | 75 | 50 | 0 |
| LDA | 46.7742 | 45.9520 | 45.6456 | 40.5476 | 40.2549 | 40.6907 |
| SVM | 42.4606 | 42.3538 | 42.4948 | 36.9842 | 37.2564 | 36.7868 |
| PNN | 57.2018 | 56.7466 | 55.7057 | 60.9152 | 60.8696 | 59.4595 |
| ENN | 95.7989 | 95.4273 | 95.7958 | 93.8860 | 93.7781 | 93.9940 |
Figures 3 and 4, shows the comparison of two features in time domain, when applied to the four classifiers. The signal used for comparison was segmented with window size 1200 and 75% overlap and extracted features after filtering with Butter worth and Elliptic filter respectively
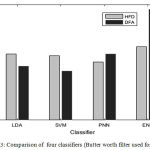 |
Figure 3: Comparison of four classifiers (Butter worth filter used for filtering)
|
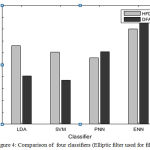 |
Figure 4: Comparison of four classifiers (Elliptic filter used for filtering)
|
It has been known from the literature that analysis of uterine electrical signals collected from abdominal surface can predict the onset of preterm delivery. Several features have been analyzed in different studies. In this study Elman neural network performs the best regardless the type of feature. DFA feature have the discriminating property than HFD in case of uterine EMG signal with DFA of accuracy 95.7989% when Butterworth filter used for filtering.
Conclusion
In this paper fractal features, Higuchi fractal dimension and Detrended fluctuation analysis were considered for the classification of preterm and term pregnancy. Four classifiers are used to classify HFD and DFA. Elman neural network shows the best classification of 95.7989% with sensitivity 0.9445 and specificity 0.9715, when the data taken with window size 1200 and 75% overlap. The signal was pre processed using fourth order butter worth filter with cut off frequency 0.34 and 3Hz. Thus fractal features have good discriminating capacity. More nonlinear feature has to be studied in future. Analysis has to be done in time frequency domain with different mother wavelet
References
- Paul F, et al. “Prediction of preterm deliveries from EHG signals using machine learning.”PloS one. 2013;10:e77154.
- William M.L, et al. “Characterization of abdominally acquired uterine electrical signals in humans, using a non-linear analytic method.” Medical and Biological Engineering and Computing1-2. 2006;117-123.
- Nan L , et al. “Uterine electromyography signal feature extraction and classification.” International Journal of Modelling, Identification and Control2. 2009; 136-146.
- Bassam M, et al. “Detrended fluctuation analysis of uterine electromyography.” Biomedical Engineering (MECBME), 2011 1st Middle East Conference on. IEEE. 2011.
- Goldberger A.L, Amaral L.A.N, Glass L, Hausdorff J.M, Ivanov P.C.h, Mark R.G, Mietus J.E, Moody G.B, Peng C.K, Stanley H.E. PhysioBank, PhysioToolkit, and PhysioNet: Components of a New Research Resource for Complex Physiologic Signals. Circulation101(23):e215-e220 [Circulation Electronic Pages;http://circ.ahajournals.org/content/101/23/e215.full]; 2000 (June 13). PMID: 10851218; doi: 10.1161/01.CIR.101.23.e215
CrossRef - Safaa N.M, Ahmed F, and Mohamed S, Eldosoky A. New technique based on uterine electromyography nonlinearity for preterm delivery detection.Journal of Engineering and Technology Research. 2014;7:107-114.
- Fele-Žorž G et al. “A comparison of various linear and non-linear signal processing techniques to separate uterine EMG records of term and pre-term delivery groups.”Medical & biological engineering &computing. 2008;9.
CrossRef - Kumar D, Sridhar P.A and Aliahmad B. Fractals: Applications in Biological Signalling and Image Processing. CRC Press. 2017.
- Cervantes-De l,Torre F, et al. “Fractal dimension algorithms and their application to time series associated with natural phenomena.” Journal of Physics: Conference Series. 2013;475:1. IOP Publishing,
- Bassam M, et al. “Detrended fluctuation analysis of uterine electromyography.” Biomedical Engineering (MECBME), 2011 1st Middle East Conference on. IEEE. 2011.
- Raghu S.N.S and Kumar PG. “Classification of epileptic seizures using wavelet packet log energy and norm entropies with recurrent Elman neural network classifier.” Cognitive neurodynamics. 2017;11(1):51-66.
CrossRef

