
G. Mostafa-Hedeab1,2 , Mary Shahataa1, E. Fouaad Ali3, Dina Sabry4, EL-Shaymaa EL-Nahass5, Manal Hassan6 and Fatma Mahmoud3
1Pharmacology Department faculty of medicine, Beni Suef University, Egypt.
2Pharmacology Department faculty of medicine, Al jouf University, Saudi Arabia.
3Pharmacology Department faculty of medicine, Cairo University, Egypt.
4Biochemistry and molecular biology Department faculty of medicine, Cairo University, Egypt.
5Pathology Department faculty of veterinary medicine, Beni Suef University, Egypt.
6Biochemistry and molecular biology Department faculty of medicine, Beni Suef University, Egypt.
Corresponding Author E-mail: gomaa_hedeab@yahoo.com
DOI : https://dx.doi.org/10.13005/bpj/1280
Abstract
Objective: to explore allopurinol action on the metabolic syndrome (MS) components induced by high fructose diet (HFD). Material & methods: Twenty-one rats were classified randomly into 2 groups; group A (7 rats; normal control) and group B (14 rats; received a high fructose diet (HFD). Meanwhile, group B is further classified into 2 subgroups: B1 received no treatment and B2 in which rats received allopurinol (4mg/kg/d for 4 weeks). Results: Allopurinol significantly decreased body weight (BW), normalized kidneys and heart weight, blood pressure (BP) and insulin level with normalized both of fasting glucose level and insulin resistance (IR). Furthermore, triglycerides (TGs) and low-density lipoprotein cholesterol (LDL-c) were significantly decreased with normalized high-density lipoprotein cholesterol (HDL-c), total cholesterol, creatinine, blood urea nitrogen (BUN), and serum uric acid (SUA) levels. Surprisingly, allopurinol significantly up regulate adiponectin receptor one and two (adipo R1/R2) and heme oxygenase-1 (HO-1) in heart, liver and kidneys pancreas associated with up regulation of endothelial nitric oxide synthase (eNOS) expression in liver, kidneys, heart only associating with amelioration of the fibrotic changes in different tissue studied. Moreover, it normalized IR, pancreatic AdipoR2, and HO-1 expression. Conclusion: allopurinol could be considered an ideal agent for an amelioration of MS components possibly through up regulation of adipo R1/R2, HO-1 and eNOS in different tissues; however more experimental and clinical studies are needed to weight the expected allopurinol benefit against its long term use related side effects.
Keywords
Allopurinol; Adiponectin R1/R2;Heme Oxygenase-1Metabolic Syndrome;
Download this article as:| Copy the following to cite this article: Mostafa-Hedeab G, Shahataa M, Ali E. F, Sabry D, EL-Nahass E. S, Hassan M, Mahmoud F. Allopurinol Ameliorates High Fructose Diet-Induced Metabolic Syndrome via up-regulation of Adiponectin Receptors and Heme oxygenase-1 Expressions in Rats. Biomed Pharmacol J 2017;10(4). |
| Copy the following to cite this URL: Mostafa-Hedeab G, Shahataa M, Ali E. F, Sabry D, EL-Nahass E. S, Hassan M, Mahmoud F. Allopurinol Ameliorates High Fructose Diet-Induced Metabolic Syndrome via up-regulation of Adiponectin Receptors and Heme oxygenase-1 Expressions in Rats. Biomed Pharmacol J 2017;10(4). Available from: http://biomedpharmajournal.org/?p=17328 |
Introduction
The metabolic syndrome (MS) is a cluster of dyslipidemia, elevated blood pressure, IR and abdominal obesity.1 There is a strong relationship between MS components and hyperuricemia.2 Allopurinol is a drug that suppresses xanthine oxidase activity resulting in decreased uric acid and xanthine oxidase-mediated free radical formation.3
Adiponectin is a hormone produced by both white and brown adipose tissues. It modulates a series of metabolic processes such as blood glucose regulation and fatty acids oxidations.4 It is considered as a key protein that regulates insulin activity and decreases tissue inflammatory process. Meanwhile, it reduces systemic insulin resistance (IR) and overall predicts cardiovascular disease.5 Adiponectin action is mediated mainly through adiponectin receptor one and two (AdipoR1/R2).
HO-1 is an enzyme that is if induced it degrades heme to ferrous iron, biliverdin and carbon monoxide (CO) in an equal molar amount.6 Following stress, The HO-1 is induced resulting in an important role in the protection of cell against injury.7
Nitric oxide (NO) generated by endothelial cells from L-arginine is present in three different synthases forms: neuronal (nNOS), inducible (iNOS) and endothelial (eNOS), among which NO generated by eNOS plays an important protective role through preserving hepatic blood flow, prevention of leukocyte adhesion, decrease platelet aggregation, and free radicals eradication.8
The current study was to evaluate the action of allopurinol on the MS produced by HFD stressing on the possible impact of AdipoR1/R2, HO-1 and eNOS in different tissues.
Material and Methods
Drugs and Chemicals
Allopurinol: Zyloric tablets, 100mg (GSK, Egypt). All tablets were crushed in distilled water and allowed for complete dissolution.
Fructose: Uni-fructose powder purchased from Universal Industrial Pharmaceutical Co. (UNIPHARMA) – Egypt.
Animals
Twenty-one male Sprague Dawley rats were included (140-155gm weight) and handled following local ethical committee guidelines that agree with that of Helenski, the animal then put in metal cages with 12 hours dark and 12 hours light every day, allowed one week free before starting the experiment for acclimatization. The protocol of this work was accepted by Beni Suef medical college ethical committee, Egypt.
A standard diet composed of 9.2% fat, 52.8% carbohydrates, and 38% protein were used to fed rats, with water free access, classified into two groups.
Group A (normal control group): Seven rats were received a standard chow diet and vehicle (water, 1 ml/kg).
Group B: Fourteen rats received HFD consisting of fructose and normal chew diet in a proportion of 6:4 for 8 weeks (till the end of the experiment).9 Group B was furtherly divided into two groups, seven rats in each one:
Group B1: received HFD only and distilled water 1 ml/kg orally.
Group B2: received allopurinol (5 mg/kg) orally.
Allopurinol and distilled water were given daily starting from the 4th weeks and lasting for four weeks after.
By the end of the 8th week, BW, and blood pressure (mean (MBP), systolic (SBP) and diastolic (DBP)) of all rat were recorded digitally by a non-invasive blood pressure analysis using a tail-cuff sphygmomanometer method (Biosynthesis Biotechnology TSE-system, Homburg, Germany). Blood pressure was measured thrice and the mean of this measurement was obtained, then all rats were sacrificed, the weight of kidneys, liver, heart, spleen and pancreas of each rat were recorded prior to PCR and histopathology.
Biochemical Examination
Under inhalation anesthesia, a 5ml blood sample was drawn after at least 6-8 fasting hours (fasted overnight), centrifuged at 804.96 g for 20 min. and the serum was stored at −20 °C in clean vials. The levels of insulin, glucose (Monobind Inc., USA), serum uric acid (SUA), low density lipoprotein cholesterol (LDL-c), high density lipoprotein cholesterol (HDL-c), triglycerides (TGs), creatinine, blood urea nitrogen (BUN) (Biodiagnostic, Egypt) were estimated using specific kits following the guidelines of its manufacturers.
Calculation of Insulin Resistance Homeostasis (HOMA-IR; IR Index)
homeostasis of IR (HOMA-IR) was calculated according to Matthews et al. 1985 using the following equation: HOMA-IR = fasting glucose (mg/dL) × fasting insulin (µU/L)/405.10
Adiponectin receptor one and two (adipo R1/R2) (ADIPO R1/2), heme oxygenase-1 (HO-1) and endothelial nitric oxide synthase (eNOS) expression assay in pancreatic, liver, kidney and heart tissues:
RNA Extraction
Total RNA was extracted from pancreas, liver, kidneys and heart tissues of all studied groups according to the manufacturer instructions, using QIamp RNA kit provided by QiagenInc, USA. To assess purification, the RNA extracted was quantitated by spectrophotometry at 260 nm.
Real time PCR (RT-PCR)
RT-PCR experiments were done for detecting HO-1, eNOS, adiponectin receptor1 (AdipR1) and adiponectin receptor2 (AdipR2) using the corresponding primer sequences as shown in (Table 1). cDNA was synthesized from 1000ng of the extracted RNA with 1 µL (20 pmol) antisense primer and 0.8 mL superscript avian myeloblastosis virus (AMV) reverse transcriptase for around 60 minutes at 37ºC. Fast Start Universal Syber Green Master mix (Thermo Scientific) was used in Applied Biosystem Instrument with software version 2.1 (StepOne™, USA). Briefly, 20 µL was prepared, of which 5 µL of synthesized cDNA was included for PCR, a final concentration of 0.5mM of each forward and reverse primer and 12.5 µL of Syber Green Master mix was used. Cycling conditions involve enzyme activation at 95°C for 15 minutes, followed by 40 cycles of 95°C for 10 seconds and 60°C for 60 seconds. Targets that are amplified successfully are expressed in Ct values or the cycle at which the target amplicon is initially detected above background fluorescence levels as determined by the instrument software. Each RT-PCR sample was performed at least triplicate. The PCR data sheet includes Ct values of assessed genes and the house keeping gene (Β-actin). The relative quantization of target genes was normalized by the.
Table 1: Oligonucleotide primers sequences used for qRT-PCR
| Gene symbol | Primer sequence | Gene bank accession number |
| HO-1 | sense 5′-CTGTTGGCGACCGTGGCAGT-3′
antisense 5′-CTGGGCTCAGAACAGCCGCC-3′ |
NM_012580.2 |
| eNOS | sense 5′-GAAGGCGTTTGACCCCCGGG-3′
antisense 5′-CCACCGCTCGAGCAAAGGCA-3′ |
NM_021838.2 |
| AdipoR1 | sense 5′-GAGGAGAAGGGTAAGCG-3′
antisense 5′-CAGAGGAAGGGTCAGCAC-3′ |
NM_207587.1 |
| AdipoR2 | sense 5′-CTCCTACAAGCCCATCATG-3′
antisense 5′-CAATCTGGCACCACATCA-3′ |
XM_006237186.3 |
| Actin | sense 5′-ACCAGTTCGCCATGGATGACGAT-3′
antisense5′-CCTAGGGCGGCCCACGATGG-3′ |
NM_031144.2 |
Histopathological Examination
Light Microscopy
At room temperature; samples from liver, heart, and kidneys were collected and fixed in 10% buffered formalin for 72 hours. Trimming of samples was done for a size of one cubic centimeter. Routine histological procedures (dehydration, clearing and paraffin embedding) were carried out. 4-6 μm thickness sections were stained with routine hematoxylin and eosin and Masson’s trichrome stains for collagen identification.11
Morphometry
Morphometrical analysis of stained Masson’s trichrome sections was carried for liver, heart and kidney specimens. The main parameter for morphometrical analysis was area percentage measurements of the collagen contents. The measurements were carried out in thirty non-overlapping of each rat at x100 (for liver specimens) and x200 (for heart and kidney specimens) magnification.
Statistical Analysis
Using SPSS 16 for windows (SanDiego, CA, USA); data were collected, tabulated, analyzed using one-way analysis of variance (ANOVA) followed by the LSD (Least Significant Difference) as a post-hoc test to compare the means from different groups. The results expressed as Mean ± standard deviation (SD), P value is significant if <0.05.
Results
Effect on Body and Organ Weights
Administration of HFD for eight weeks in group B1 resulted in a significant increase in BW, heart, kidney, pancreas and insignificant increase in spleen and liver weight compared to normal control group (A). Administration of allopurinol in group B2 significantly ameliorated the increased BW, kidney, heart and spleen weight compared to HFD group. Moreover, allopurinol normalized the kidney and heart weight (Table 2).
Table 2: Body and organ weights of the studied animal groups
| Total Body Weight | Liver Weight | Kidney Weight | Heart Weight | Pancreases Weight | |
| Control Group (A) | 148.3±6.06 | 6.8±.82 | 1.05±.08 | .56±.04 | .33±.012 |
| HFD Group (B1) | 299.8±8.5* | 6.9±.52 | 1.6±.19* | .85±.3* | 1.3±.34* |
| Allopurinol Group (B2) | 251.7±8.8∑ | 5.9±1.4 | 1.3±.26∑ # | .62±.09∑ # | .65±.38∑ |
* Significant compared to Normal Control Group (P value < 0.05).
∑ Significant compared to HFD Group (P value < 0.05).
# Insignificant compared to normal control group.
Effect on Blood Pressure
Administration of HFD for eight weeks in group B1 resulted in a significant increase in systolic, diastolic and the mean blood pressure compared to the normal control group (A). Allopurinol in group B2 significantly decreases the systolic, diastolic and the mean blood pressure compared to HFD group (B1) (Table 3).
Table 3: Blood pressure measurements and biochemical parameters of the studied animal groups.
| Normal Control group (A) | HFD Group (B1) | Allopurinol Group (B2) | |
| Systolic Bp (mmHg) | 119.3±1.5 | 173.4±9.6* | 145.7±7.8 ∑ |
| Diastolic (mmHg) | 72.1±6.4 | 103.6±13* | 95.6±3.2 |
| Mean BP (mmHg) | 87.2±4.9 | 124±4.6 * | 112.1±4.3 ∑ |
| Glucose (mg/dl) | 90.4±10.1 | 190.7±32.15* | 94.14±8.26∑ # |
| Insulin (mIU/ml) | 1.34±0.58 | 15.9±3.11* | 4.03±1.5 ∑ |
| Uric acid (mg/dl) | 1.41±0.33 | 4.21±1.19* | 1.39±0.39 ∑ # |
| Creatinine (mg/dl) | 0.75±0.06 | 2.26±0.61* | 0.59±0.13 ∑ # |
| BUN (mg/dl) | 22.1±3.3 | 100.3±16.03* | 31.3±7.6 ∑ # |
| Triglycerides (mg/dl) | 65.3±12.6 | 137.29±25.27 * | 97.43±25.32 ∑ |
| Cholesterol (mg/dl) | 78.6±6.2 | 95.14±11.3 * | 72.86±10.02 ∑ # |
| HDL (mg/dl) | 30.14±3.53 | 20.29±1.79 * | 27.71±3.35 ∑# |
| LDL (mg/dl) | 25±2.71 | 40±4.6 * | 31.9±5.4 ∑ |
Data presented as Mean ±SD
* Significant compared to Normal Control Group (P value < 0.05).
∑ Significant compared to HFD Group (P value < 0.05).
Effect on blood glucose, Insulin and Insulin Resistance
HFD in group B1 resulted in significant increase in fasting blood glucose, insulin level, and IR compared to the normal control group (A). Allopurinol in group B2 significantly decreases serum blood glucose, insulin, and IR compared to HFD. Moreover, allopurinol normalizes glucose level and IR (Table 3, Figure 1).
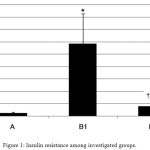 |
Figure 1: Insulin resistance among investigated groups.
|
A: Normal control group. B1: High Fructose Diet group.
B2: Allopurinol-treated group. *Significant compared to control group.
∑ Significant compared to HFD group.
# non-significant compared to normal control group.
Effect on the Uric Acid Level and Renal Function
Administration of HFD for 8 weeks in group B1 significantly increased serum uric acid (SUA), BUN and creatinine as compared to the group A. Allopurinol normalized serum creatinine, BUN and urea level (Table 3).
Effect on Lipid Profile
HFD significantly increased serum total cholesterol, TG, LDL-c and decreased HDL-c compared to the normal control group (A). Administration of allopurinol in the group (B2) significantly ameliorated serum total cholesterol, TG, LDL-c and decrease HDL-c compared to HFD group (B1). Surprisingly, allopurinol administration normalized cholesterol and HDL-c level (Table 3).
Effect on Adipo R1/2, HO-1 and eNOS expression levels
HFD significantly decrease AdipoR1/2, HO-1 and eNOS expression level in the liver, heart, kidneys and pancreatic tissues compared to tissues of normal control group (A). Administration of allopurinol for four weeks significantly increase AdipoR1/2, the HO-1 expression level in all examined tissues as well as NOS expression in liver, heart and kidney tissues only compared to HFD group. Moreover, allopurinol normalizes the pancreatic AdipoR2 and HO-1 expression level (Fig. 2).
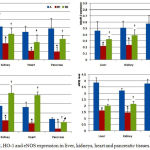 |
Figure 2: AdipoR1/2, HO-1 and eNOS expression in liver, kidneys, heart and pancreatic tissues.
|
A: Normal control group.
B1: High Fructose Diet group.
B2: Allopurinol-treated group.
*Significant compared to control group.
∑ Significant compared to HFD group.
# Insignificant compared to normal control group.
¥ Insignificant compared to HFD group.
Histopathology of the heart, liver, kidneys
Histopathologically, variable degrees of collagen fibers proliferation could be detected in routinely HE-stained specimens in different groups. Consequently, Masson’s trichrome-stained sections revealed the presence of collagen fibers proliferation with green color in livers (Fig. 3a-c), hearts (Fig. 3e-g) and kidneys (Fig. 3i-k). The highest level of collagen fibers proliferation could be detected in HFD group (B1) (Fig. 3b, f, j). On the other hand, a normal distribution of collagen fibers could be seen in the normal control group (A) (Fig. 3a, e, i) in livers, hearts, and kidneys, respectively. The Allopurinol-administered group (B2) exhibited mild to moderate proliferation of collagen fibers in different organs including, livers, hearts, and kidneys (Fig. 3c, g, k). Statistical comparison of collagen fibers area percentages in livers, hearts, and kidneys of rats revealed the high significant difference between HFD group (B1) and other two groups (P<0.05). Meanwhile, no significant difference could be found between the normal control group (A) and Allopurinol group (B2) in livers, hearts and kidneys specimen (P=0.469, 0.341, 0.074 respectively) i.e. allopurinol hindered the histopathological changes associated with MS in livers, hearts and kidneys tissues.
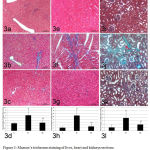 |
Figure 3: Masson’s trichrome staining of liver, heart and kidneys sections measuring variable collagen fibers.
|
Fig. 3a, 3b, 3c for liver (3a: control group, 3b: HFD group and 3c allopurinol group). Fig. 3e, 3f, 3g for heart (3e: control group, 3f: HFD group and 3g: allopurinol group). Fig. 3i, 3j, 3k for kidney (3i: control group, 3j: HFD group and 3k: allopurinol group). D, h, i: Area percentages (%) of collagen fibers in liver, heart, and kidneys, respectively in different groups.
*P<0.05 compared to normal control.
∑ P<0.05 compared to HFD group.
# Insignificant compared to normal control group.
Discussion
In the current study, HFD induced MS as evident by significant increase of BW, BP (MAP, SBP and DBP), BUN, creatinine, insulin, serum glucose, IR, UA, total cholesterol, TGs, LDL-c level, with significant decrease of serum HDL-c level compared to vehicle group (A), these results confirm the previous report.12
Treatment with allopurinol ameliorated BW induced by HFD. Previous results stated that SUA levels are correlated with muscle and fat masses.13 The beneficial effect of allopurinol in the reduction of body weight (BW) may be through the anti-hyperuricemia effect.14
HFD results in induction of hypertension which is successively reversed by allopurinol. The present result is in accordance with other experimental 15 and clinical study as well.16
Hyperuricemia can predispose to hypertension through Ang II production stimulation and oxidative stress mediated by AT117 or through increasing the sensitivity of the proximal tubule to the circulating Ang II.18
Endothelial nitric-oxide synthase (eNOS) produced NO which is a potent vasodilator. It enhances the action of acetylcholine, bradykinin, and substance P in vascular beds by induction of smooth muscle relaxation.19 In the current work, hypertension in HFD group was associated with significant decrease in eNOS level which is successively reversed by allopurinol in most tissues.
SUA plays an important role in the exacerbation of IR.20 It may increase the hepatic gluconeogenesis production through stimulation of Adenine mono phosphate deaminase (AMPD) and inhibition of AMP-activated protein kinase (AMPK) enzyme activity. AMPD stimulates hepatic gluconeogenesis.21 It reduced the production of eNOS, which is essential for insulin stimulated glucose uptake.22
AdipoR1 and R2 play important roles in in vivo regulation of glucose metabolism and insulin sensitivity.23 Adiponectin binding to its receptors leads to the glucose transporter 4 translocation to the cell membrane that results in increased glucose transport and promotes glycogen synthesis 24 that results in IR improvement.
In the present study, HFD significantly increased blood glucose, insulin and IR concomitant with decreased AdipoR1/R2 expression levels in all examined tissues (liver, kidneys, heart, and pancreas) which are correlated with a significant decrease in eNOS in liver, kidney and heart tissues of HFD group (B1) compared to group A.
Down regulation of AdipoR1/R2 and eNOS signaling result in a decrease of adiponectin efficacy leading to IR.25 Also, upregulation of AdipoR1 or AdipoR2 in the liver of db/db mice ameliorated diabetes significantly.23 Based on that opinion, using AdipoR1/R2 agonists or any agents that increase AdipoR1/R2 expressions may provide a new treatment for IR and diabetes type 2.
In the current study, allopurinol significantly decreased insulin level associated with upregulation of pancreatic AdipoR1/R2; moreover, Allopurinol normalizes pancreatic AdipoR2 signaling while insignificant differences in eNOS signaling compared to HFD group indicating that allopurinol may regulate insulin secretion mainly due to up regulation of AdipoR1/R2.
The fasting glucose reflects mainly hepatic glucose production,26 the glucose and HOMA-IR reflect mainly hepatic insulin resistance. In the present work, allopurinol decrease blood glucose and IR compared to HFD group with the restoration of normal hepatic architecture, this is run along with an increase hepatic AdipoR1/R2 and eNOS expression. Surprisingly, allopurinol normalizes IR, glucose level, indicating that allopurinol may normalize glucose level through combined up regulation of AdipoR1/R2 and eNOS expression in liver tissues.
Allopurinol significantly decreased creatinine and BUN levels compared to HFD group, whereas there are insignificant differences compared to vehicle group i.e. it normalized these parameters.
Allopurinol mediated a renal protection through increased eNOS and HO-1 expression compared to HFD group, this is associated with marked improvement of collagen contents of corresponding histological examination or indirectly through improvement of glucose and IR status.
HO-1 is an inducible enzyme that degrades heme to form an equal molar amount of carbon monoxide (CO), ferrous iron and biliverdin.6 Following stress, The HO-1 is induced resulting in an important role in the protection of cell against injury.7 HO-1 protects against vascular disease through promoting endothelial cell viability and function27 via CO generation that possesses potent anti-apoptotic properties or through the generation of biliverdin and bilirubin from the catabolism of toxic free heme that possesses potent antioxidant activities.28
Allopurinol significantly improves total cholesterol, TGs, HDL-c and LDL-c levels compared to that in HFD group, these results run with another study in fructose-fed rats.29
Allopurinol improvement of dyslipidemia is correlated with up regulation of AdipoR1/R2 or as a consequence to eNOS expressions.
AdipoR1/R2 regulate lipid metabolism via increase the activities of the AMP-activated kinase (AMPK) and PPARs. Adiponectin binding to AdipoR1/R2 results in apoptosis protection; while adiponectin – through unidentified adiponectin receptor activate NF-kB leading to increases macrophages IL-6.23
In the present study, a detection of collagen fibers proliferation or fibrosis was carried out by the use of the Masson’s Trichrome (MT)-stained paraffin-embedded sections. A severe degree of fibrosis could be in different organs of HFD treated group (B1) including livers, kidneys, and hearts with the highest area percentages of collagen in comparison to other groups. Such finding is supported by other studies, which mentioned that diet rich in fructose promoted oxidative stress and ROS to up regulate CD36, and subsequently provoked NLRP3 inflammasome in a TLR4/6-IRAK4/1-dependent manner leading to promotion of fibrosis and inflammation in rats suffering from metabolic syndrome.30 Additionally, no significant difference of fibrosis could be detected between vehicle and Allopurinol treated group. Our results supported by Kang et al. who proved the cardio protective effect of allopurinol against HFD induced inflammation and fibrosis.30
Conclusion
allopurinol may represent a good agent for the amelioration of MS components possibly through up regulation of adipo R1/R2, HO-1 and eNOS- in different tissues; however more experimental and clinical studies are needed to weight the expected allopurinol benefit against long term use related side effects.
References
- Jamshidi L, Seif A, Vazinigheysar H. Comparison of indicators of metabolic syndrome in iranian smokers. Zahedan J Res Med Sci. 2014;16(1):55-58.
- Choi H.K, Ford E.S. Prevalence of the metabolic syndrome in individuals with hyperuricemia. The American journal of medicine. 2007;120(5): 442-447.
CrossRef - Desco M.C, Asensi M, Márquez R, et al. Xanthine oxidase is involved in free radical production in type 1 diabetes. Diabetes. 2002;51(4):1118-1124.
CrossRef - Whitehead J, Richards A, Hickman I, Macdonald G, Prins J. Adiponectin–a key adipokine in the metabolic syndrome. Diabetes, Obesity and Metabolism. 2006;8(3):264-280.
CrossRef - Rodina A, Severin S. The role of adiponectin in the pathogenesis of the metabolic syndrome and approach to therapy. Patologicheskaia fiziologiia i eksperimental’naia terapiia. 2012(1):15-26.
- Tenhunen R, Marver H.S, Schmid R. The enzymatic conversion of heme to bilirubin by microsomal heme oxygenase. Proceedings of the National Academy of Sciences. 1968;61(2):748-755.
CrossRef - Durante W. Targeting heme oxygenase-1 in vascular disease. Current drug targets. 2010;11(12):1504-1516.
CrossRef - Shah V, Kamath P.S. Nitric oxide in liver transplantation: pathobiology and clinical implications. Liver Transplantation. 2003;9(1):1-11.
CrossRef - Nagi M.N, Al-Bekairi A.M, Al-Sawaf H.A. Spectrophotometric assay for superoxide dismutase based on the nitroblue tetrazolium reduction by glucose-glucose oxidase. Biochemistry and molecular biology international. 1995;36(3):633-638.
- Matthews D.R, Hosker J.P, Rudenski A.S, Naylor B.A, Treacher D.F, Turner R.C. Homeostasis model assessment: insulin resistance and beta-cell function from fasting plasma glucose and insulin concentrations in man. Diabetologia. 1985;28(7):412-419.
CrossRef - Bancroft J.D, Gamble M. Theory and practice of histological techniques: Elsevier Health Sciences. 2008.
- Shahataa M.G, Mostafa-Hedeab G, Ali E.F, Mahdi E.a, Mahmoud F.A.E. Effects of telmisartan and pioglitazone on high fructose induced metabolic syndrome in rats. Canadian journal of physiology and pharmacology. 2016;94(999):1-11.
CrossRef - Loenen H.M, Eshuis H, Löwik M.R, et al. Serum uric acid correlates in elderly men and women with special reference to body composition and dietary intake (Dutch Nutrition Surveillance System). Journal of clinical epidemiology. 1990;43(12):1297-1303.
CrossRef - Nakanishi N, Okamoto M, Yoshida H, Matsuo Y, Suzuki K, Tatara K. Serum uric acid and risk for development of hypertension and impaired fasting glucose or Type II diabetes in Japanese male office workers. European journal of epidemiology. 2003;18(6):523-530.
CrossRef - El-Bassossy H.M, Shaltout H.A. Allopurinol alleviates hypertension and proteinuria in high fructose, high salt and high fat induced model of metabolic syndrome. Translational Research. 2015;165(5):621-630.
CrossRef - Feig D.I, Soletsky B, Johnson R.J. Effect of allopurinol on blood pressure of adolescents with newly diagnosed essential hypertension: a randomized trial. Jama. 2008;300(8):924-932.
CrossRef - Corry D.B, Eslami P, Yamamoto K, Nyby M.D, Makino H, Tuck M.L. Uric acid stimulates vascular smooth muscle cell proliferation and oxidative stress via the vascular renin–angiotensin system. Journal of hypertension. 2008;26(2):269-275.
CrossRef - Cabral P.D, Hong N.J, Khan M.A.H, et al. Fructose stimulates Na/H exchange activity and sensitizes the proximal tubule to angiotensin II. Hypertension. 2014;63(3):e68-e73.
CrossRef - Rees D, Palmer R, Moncada S. Role of endothelium-derived nitric oxide in the regulation of blood pressure. Proceedings of the National Academy of Sciences. 1989;86(9):3375-3378.
CrossRef - Krishnan E, Pandya B.J, Chung L, Hariri A, Dabbous O. Hyperuricemia in young adults and risk of insulin resistance, prediabetes, and diabetes: a 15-year follow-up study. American journal of epidemiology. 2012;176(2):108-116.
CrossRef - Cicerchi C, Li N, Kratzer J, et al. Uric acid-dependent inhibition of AMP kinase induces hepatic glucose production in diabetes and starvation: evolutionary implications of the uricase loss in hominids. The FASEB Journal. 2014;28(8):3339-3350.
CrossRef - Bjornstad P, Snell-Bergeon J.K, McFann K, et al. Serum uric acid and insulin sensitivity in adolescents and adults with and without type 1 diabetes. Journal of diabetes and its complications. 2014;28(3):298-304.
CrossRef - Yamauchi T, Kadowaki T. Adiponectin receptor as a key player in healthy longevity and obesity-related diseases. Cell metabolism. 2013;17(2):185-196.
CrossRef - Tomas E, Tsao T.S, Saha A.K, et al. Enhanced muscle fat oxidation and glucose transport by ACRP30 globular domain: Acetyl–CoA carboxylase inhibition and AMP-activated protein kinase activation. Proceedings of the National Academy of Sciences. 2002;99(25):16309-16313.
CrossRef - Takir M, Kostek O, Ozkok A, et al. Lowering uric acid with allopurinol improves insulin resistance and systemic inflammation in asymptomatic hyperuricemia. Journal of Investigative Medicine. 2015;63(8):924-929.
CrossRef - Brown A.M, Wiggins D, Gibbons G.F. Glucose phosphorylation is essential for the turnover of neutral lipid and the second stage assembly of triacylglycerol-rich ApoB-containing lipoproteins in primary hepatocyte cultures. Arteriosclerosis, thrombosis, and vascular biology. 1999;19(2):321-329.
CrossRef - Durante W. Protective role of heme oxygenase-1 against inflammation in atherosclerosis. Frontiers in bioscience (Landmark edition). 2010;16:2372-2388.
CrossRef - Liu X.m, Peyton K.J, Shebib A.R, Wang H, Korthuis R.J, Durante W. Activation of AMPK stimulates heme oxygenase-1 gene expression and human endothelial cell survival. American Journal of Physiology-Heart and Circulatory Physiology. 2010: ajpheart. 00749.02010.
- Nakagawa T, Hu H, Zharikov S, et al. A causal role for uric acid in fructose-induced metabolic syndrome. American Journal of Physiology-Renal Physiology. 2006;290(3):625-631.
CrossRef - Kang L.L, Zhang D.M, Ma C.H, et al. Cinnamaldehyde and allopurinol reduce fructose-induced cardiac inflammation and fibrosis by attenuating CD36-mediated TLR4/6-IRAK4/1 signaling to suppress NLRP3 inflammasome activation. Scientific reports. 2016;6:27460.
CrossRef

