
Mohammed Hamad1, Wael Abu Dayyih2, Alsabbagh Rafal2, Alice Abu Dayyih3, Israa Al Ani4, Eyad Mallah2, Hanadi Salih5, Zainab Zakarya2 and Tawfiq Arafat2
1College of Science and Health Professions, King Saud Bin Abdulaziz University for Health Sciences, Jeddah, Saudi Arabia.
2Faculty of Pharmacy and medical Sciences, University of Petra, Amman, Jordan.
3Faculty of Chemistry, Biology, and Pharmacy, Hochschule Fresenius, Germany.
4Faculty of Pharmacy and Medical Sciences, Al-Ahliyya Amman University, Amman, Jordan.
5Faculty of Pharmacy, the University of Jordan, Amman, Jordan.
DOI : https://dx.doi.org/10.13005/bpj/1278
Abstract
Food-drug interactions may affect pharmacokinetics or pharmacodynamics of a drug. Failure to identify and properly manage drug-nutrient interactions may lead to serious consequences. In this study, we try to develop and validate a simple and sensitive analytical method for measuring of glimepiride in rat plasma and examine of any possible interactions of glimepiride with different fruit juices. A mixture of 80 % methanol and 20 % of 0.1% FA in water was used as a mobile phase and ACE 5 C18 (50 X 2.1 mm, 5μm) column were employed; and clarithromycin was used as internal standard. This method was confirmed in terms of linearity, precision, accuracy, stability and system suitability. The validated method was used to examine the effects of grapefruit and licorice of glimepiride pharmacokinetic in rat plasma. The kinetic data shows that glimepiride plasma level was high when combined with licorice, and at the same level when combined with grapefruit. The administration of grapefruit juice concomitantly with glimepiride shows insignificant effect on its Cmax, elimination half-life and clearance (P>0.05). While for licorice juice, it has no significant effects on glimepiride pharmacokinetic parameters. A simple and sensitive analytical method for determination of glimepiride in rat plasma has been developed and validated by using HPLC-MS. Also, we found that fruit juices can alter glimepirides pharmacokinetic if they were taken simultaneously.
Keywords
glimepiride; grapefruit; licorice HPLC-MS; pharmacokinetics;
Download this article as:| Copy the following to cite this article: Hamad M, Dayyih W. A, Rafal A, Dayyih A. A, Ani I. A, Mallah E, Salih H, Zakarya Z, Arafat T. The Effect of Some Fruit Juices on Glimepiride Pharmacokinetic in Rat Plasma by Using High Performance Liquid Chromatography-Mass Spectrometry. Biomed Pharmacol J 2017;10(4). |
| Copy the following to cite this URL: Hamad M, Dayyih W. A, Rafal A, Dayyih A. A, Ani I. A, Mallah E, Salih H, Zakarya Z, Arafat T. The Effect of Some Fruit Juices on Glimepiride Pharmacokinetic in Rat Plasma by Using High Performance Liquid Chromatography-Mass Spectrometry. Biomed Pharmacol J 2017;10(4). Available from: http://biomedpharmajournal.org/?p=17172 |
Introduction
Glimepiride is an active, well-tolerated oral hypoglycemic drug.1 It is used chronically to maintain glucose level within normal range.2,3 It is different from other sulfonylureas in which it will result in less hypoglycemic effect and weight loss.4 It might be combined with other oral antidiabetic drugs or insulin, to improve the level of glucose in blood.5
Glimepiride is metabolized by CYP2C9 (CYP450 isoezyme).6 For that it should be considered when use it with any CYP 2C9 inducers (e.g. rifampicin) or inhibitors (e.g. fluconazole).7 Alcohol consumption may decrease the hypoglycemic effect of glimepiride in an unpredictable way.8
Drug-Food interactions may cause disturbances in the pharmacokinetics or pharmacodynamics of a drug or nutritional component or alteration in nutritional status because of using a drug.9 The unproperly management of drug-food interactions may cause a serious complication like reduction in certain oral drug absorption which leads to failure treatment.10 In addition, nutrients may induce or inhibit certain enzymes in the gut that will alter the bioavailability of certain. For example, grapefruit juice is a selective intestinal CYP3A4 inhibitor.11 It was found that grapefruit may increases the bioavailability of certain drugs e.g. felodipine threefold than normal that may raise the risk of side effects.12 Also, long term using of drugs may lead to disturbances in GIT functions result in loss of body fluids and electrolytes. Due to that it is recommended to limit the drug prescription for necessary medications and use it for short time to lessen the adverse of drug-food interactions.13
Moreover, two clinical manifestations may result due to the interaction between drugs and nutrients, these are: first: elevation of drug levels in plasma which elevate the risk of side effects and toxicity, second: reduction of drug plasma levels which cause failure of treatment.14,15,16,17,18,19
After oral administration, glimepiride is almost completely absorbed from the GI tract and the Cmax is reached within 2-3 hours. Taking glimepiride with meals, slightly increases the mean Tmax and slightly decreases the mean Cmax and AUC.20 It was found that after intravenous dosing in normal subjects, the volume of distribution was 113 ml/kg, the total body clearance (CL) was 47.8 ml/min and the protein binding was greater than 99.5%.21
Glimepiride is totally metabolized by the oxidative biotransformation after either IV or oral administration. The main metabolites are cyclohexyl hydroxyl methyl derivatives and carboxyl derivatives. CYP2C9 found to be included in the biotransformation of glimepiride to cyclohexyl hydroxyl methyl derivatives, which is extra metabolized to carboxyl derivatives by enzymes in cytoplasm. The cyclohexyl hydroxyl methyl derivatives possesses about one third of the pharmacological activity in comparison to its parent in an animal model. However, its hypoglycemic effect is not clear in humans.22 These metabolites are excreted in feces and urine.23,24 The present work is focusing on development of a sensitive and simple chromatographic method for quantifying glimepiride in rat plasma, to be followed by examination of any possible interactions of glimepiride with different fruit juices (grapefruit and licorice) on animals experimental.
Materials and Methods
Reagents
Rats plasma, (Harvested from animals from animal house in UOP). Methanol advanced gradient grade (Fisher scientific, B# 1155904), acetonitrile advanced gradient grade (Fisher scientific, B# 1156250), formic acid advanced gradient grade (GPR Rectapur, B# 07L210512), sodium hydroxide powder (VWR international), glimepiride raw material (JPM Co. B# WS/07/272), and clarithromycin raw material (JPM Co. B#0040310095)
Instrumentation
The used was an API Mass spectrometer which consists of: Degasser (Agilent 1260), solvent delivery systems pump (Agilent 1200), auto-sampler (Agilent 1200), thermostat column compartment (Agilent 1200), API 4000 mass spectrometer), ACE 5, C18 (50 x 2.1 mm), 5μm, computer system, windows XP, SP3, data management software 1.5.1).
Bath sonicator Crest model-175T (Ultra Sonics CORP.), Sartorius balance BP 2215, Sartorius pH meter (Professional meter PP-25), and Centrifuge (eppendorf 5417C)
Chromatographic Conditions
Mobile phase is composing of 80% of methanol and 20% of 0.1% formic acid in water. Column type ACE5C18 Column (50×2.1 mm, 5µl), clarithromycin was used as internal standard. Further details and mass parameters are illustrated in Table 1.
Table 1: Chromatographic conditions.
| HPLC conditions | Pump flow rate | Autosampler injection volume | Autosampler temp. | Column oven temp. | |||
| 0.6 ml/min | 5µl | 10oC | 40oC | ||||
| Chromatography | Mobile phase | Mixture of 80% methanol and 20% of 0.1% FA in water | |||||
| Column type | ACE5C18 Column (50×2.1 mm,5µl) | ||||||
| Expected Retention times (minutes) | Glimepiride | Clarithromycin (IS) | |||||
| 0.3 – 0.5 | 0.25 – 0.4 | ||||||
| MRM detection
conditions |
Analytes | Q1 Mass | Q3
Mass |
DP | EP | CE | CXP |
| Glimepiride | 491.485 | 352.1 | 91 | 10 | 19 | 22 | |
| Clarithromycin (IS) | 748.200 | 158.1 | 76 | 10 | 30 | 4 | |
| MS conditions | CUR | Gas 1 | Gas2 | IS voltage | CAD | T | |
| 25 | 75 | 75 | 5500 | 5 | 550 | ||
Stock and Working Solutions
Clarithromycin (IS) Solutions
A stock solution of clarithromycin (IS) at a level of 1 mg/ml was prepared by taking 10mg of clarithromycin and dissolved it in 10ml methanol. Working solutions of IS were prepared by diluting 50.0 μl from previous stock solution into 10.0 ml of methanol, to get a concentration of 5 μg/ml, then further dilution was done by diluting 100 μl (from standard solution of 5 μg/ml) into 250.0 ml of methanol to get a final concentration of 2 ng/ml.
Glimepiride Solutions
To prepare the stock solution of glimepiride 10.0 mg was taken and dissolved in 0.5 ml of DMSO; then the volume was completed to 10.0 ml by methanol to get a concentration of 1.0 mg/ml. Then, 200.0 μl of the prepared solution was diluted into 10.0 ml of 1:1 water/methanol to obtain a concentration of 20.0 μg/ml working solution.
Calibration Curve and Quality Control (QC) Samples in Plasma
Calibration curve of seven standards of glimepiride were prepared by taking 100μl from each working solution and spiked into10 ml of plasma to get concentrations of: 20, 50, 100, 200, 300, 400 and 600 ng /ml. Quality controls (QC) samples were: 60, 250 and 500ng/ml. Each plasma sample was divided to 25 μl in 1.5 ml eppendorf tubes and stored at -30˚C. Standard and quality control samples were used daily during analysis.
Method Validation
Precision and Accuracy
Intra-day precision and accuracy parameters were daily evaluated by analyzing of 6 duplicates of the lower limit of quantification (LLOQ) and QC samples. Three runs of LLOQ and QC were analyzed in three days to evaluate the inter-day variability. The ratios between standard deviation (SD) and the mean were used to find the relative standard deviation (RSD) values or CV%. Results were in percentages.
Accuracy was evaluated by calculating the ratio between the amounts recovered from the control samples with its values existing in the samples (theoretical values). The suitable values of intra-day and inter-day accuracy and precision were under 15%. For the LLOQ, the suitable value must be lower than 20% according to EMEA.
Linearity
Calibration curve of glimepiride was plotted between the ratio of drug peak area (PAR) and area of internal standard against drug concentration (C). The resulted equation: PAR = Slope × C + Intercept used to calculate the unknown concentrations of glimepiride. The nominal values of the drug and the calculated PAR used to determine the slope and intercept. Correlation coefficient (R2) values used to determine the linearity of the plotted curve.
Specificity and Selectivity
Six batches of plasma were used to determine the specificity of the method. Each batch was analyzed as blank and zero samples, and compared to LLOQ to confirm the lack of endogenous peaks.
According to the EMEA 2011, six different batches of suitable blank medium that are independently evaluated must be used to verify the selectivity. Normally, the lack of interfering constituents is accepted where the response is lower than 20% of the LLOQ for the analyte and 5% for IS.
Sensitivity
In sensitivity, the chromatographic response of LLOQ must be ≥ 5 times than the blank response with accuracy 80-120% and precision ≤ 20%. Six replicates of LLOQ plasma samples were prepared along with the calibration curve.
Stability
Stability of glimepiride in rats’ plasma is determined using low and high QC samples (blank plasma spiked with glimepiride at a level of a maximum of 3 times the LLOQ and to the ULOQ) which are analyzed directly upon preparation and again after 24 hours at room temperature. The QC samples were evaluated by the calibration curve, which prepared from newly spiked calibration samples, and the resulted concentrations are compared to the nominal concentrations. The accepted levels of mean concentrations are ±15% of the nominal concentration.
Preclinical Study
Preparation of Glimepiride Solution and Fruit Juices
Glimepiride solution to be given to rats in a dose of 115mg/kg (based on maximum daily dose of human) was prepared by weighing 0.015 g of glimepiride raw material then dissolved in 1.0 liter of 0.1 M sodium hydroxide solution.
Grapefruit; Citrus paradise (Rutaceae) was purchased from local market in Jordan, divided in half and directly squeezed by hand before used without any additions or treatments.
Licorice roots from Glycyrrhizaglabra (Fabaceae) cultivated in Jordan, which were used to prepare the licorice juice. The roots were soaked in distilled water for 1 hour. The wet licorice paste then was taken in a clean white tissue and hold on a holder. Finally, the cold water was allowed to drizzle over the tied licorice cushion in a period of 2 hours. The prepared licorice juice has no additives and it was stored at 4°C and used within 48 hours.
Animal Handling and Study Protocol
Study protocol was approved by ethical committee of the High Research Council, faculty of pharmacy and medical science, University of Petra, Amman, Jordan (No.17/2014). Adult male and female Sprague Dawley laboratory rats were provided by the animal house of University of Petra with an average weight of 270.0 ±30g.
Rats were sited in controlled environment (20-25 ºC) and uncovered to a photoperiod cycle (12 hours light/12hours’ dark) daily. All rats fasted 24 hours before the experiment day.
Rats were divided into 14 groups, each of six rats. Four groups received glimepiride only and another five groups received glimepiride with grapefruit, while the last five groups received glimepiride with licorice. Then each rat received certain amount of a drug solution (per weights) orally by an oral gavage. Two milliliters of each fruit juices were given to the rats prior the administration of the drug, in addition by oral gavage.
Sample Collection and Processing
Blood collected by cutting the rats tail where few drops were taken and put in the Eppendorf tubes. Samples were pooled from each subgroup at the following time points: zero, 0.5, 1.0, 2.0, 3.0, 4.0, and 6.0 hours. Blood samples were collected in a micro-tubes containing Ethylenediaminetetraacetic acid (EDTA) and then after centrifugation at 5,000 RPM for 10 minutes; plasma was taken in labeled eppendorf tubes and stored at -30oC till the analysis.
For extraction 25 μl of plasma sample and 200 μl of internal standard (2 ng/ml clarithromycin in methanol) were taken in a 1.50 ml eppendorf tube and mixed for 1.0 min; then centrifuged for 15 min at 14000 rpm. The supernatant was then transferred into auto-sampler tubes; then analyzed under the chromatographic conditions as shown in Table 1. This procedure was used for rat samples, calibration and quality control samples.
Pharmacokinetic Study
Plasma level -time profile of glimepiride, glimepiride with liquorice, and glimepiride with grapefruit was constructed by plotting average plasma concentration in ng/ml versus time in hours.
Non-compartmental analysis was performed to calculate Cmax, Tmax, AUC-6, MRT-6, Clearance (Cl/F), elimination rate constant (Kel) and terminal elimination half-life (t1/2) for glimepiride alone and another time when it was given with fruit juices using Microsoft Excel 2010.
Statistical Analysis
SPSS version 21 computer software was used for statistical analysis. Paired t-test was used to detect significance in pharmacokinetic parameters using 95% confidence interval.
Results and Discussion
Validation of HPLC-MS Method
Validation of the present analytical method of glimepiride was conducted to evaluate the reliability of the method for the measuring the drug concentration in rat plasma. Figures 1-3 show the chromatogram of glimepiride blank, zero and rat plasma sample after 1 hour.
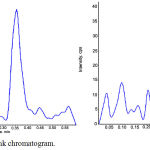 |
Figure 1: Glimepiride blank chromatogram.
|
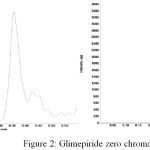 |
Figure 2: Glimepiride zero chromatogram.
|
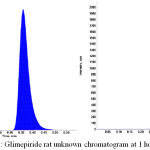 |
Figure 3: Glimepiride rat unknown chromatogram at 1 hour.
|
Accuracy and Precision
Results of inter-day accuracy over the tested concentration range (90 and 108%) in each day are shown in table 2. In comparison to the accepted standards (85-115 %) for all concentrations and for LLOQ (80-120 %), the resulted accuracy was within the accepted ranges. Further, results of intra-day accuracy lied in the same accepted rang.
Inter and Intra-day precision (CV%) was less than 20% for LLOQ and 15% for the other concentrations. The CV% evaluation over the three days was less than 5.80% for (QCmid), which indicates the closeness of the measurements (Table 2).
Table 2: Results of inter and intra- day precision and accuracy.
| Day 1 | LLOQ | QCLow | QCMid | QCHigh |
| Target conc. | 20 ng/ml | 60 ng/ml | 250 ng/ml | 500 ng/ml |
| Calculated conc. ±SD | 19.78± 0.65ng/ml | 54.49±1.84ng/ml | 266.94±9.12ng/ml | 515.89±26.54 |
| SE | 0.27 | 0.75 | 3.73 | 10.84 |
| Accuracy ± SD | 98.88±3.24 | 90.82±3.87 | 106.77±3.65 | 103.18±5.31 |
| CV% | 3.28 | 3.38 | 3.42 | 5.15 |
| Range | 19.4-20.4 | 51.9-56.6 | 250.4-275.1 | 487.5-548.6 |
| Day 2 | ||||
| Target conc. | 20 ng/ml | 60 ng/ml | 250 ng/ml | 500 ng/ml |
| Calculated conc. ±SD | 21.46±0.43 | 54.33±1.54 | 256.19±14.87 | 461.92±10.08 |
| SE | 0.18 | 0.63 | 6.07 | 4.12 |
| Accuracy ± SD | 107.29±2.15 | 90.54±2.57 | 102.48±5.95 | 92.38±2.02 |
| CV% | 1.99 | 2.84 | 5.80 | 2.18 |
| Range | 21-21.9 | 52.1-56.8 | 236.3-274.95 | 452.7-478 |
| Day 3 | ||||
| Target conc. | 20 ng/ml | 60 ng/ml | 250 ng/ml | 500 ng/ml |
| Calculated conc. ±SD | 21.59±0.52 | 61.07±1.09 | 255.99±6.01 | 485.19±18.31 |
| SE | 0.21 | 0.44 | 2.45 | 7.48 |
| Accuracy ± SD | 107.90±2.61 | 101.78±1.81 | 102.39±2.41 | 97.04±3.66 |
| CV% | 2.42 | 1.78 | 2.35 | 3.77 |
| Range | 20.8-22.1 | 59.6-62.8 | 247.8-262.9 | 461.2-504.1 |
Linearity
Linear regression equation was applied to calculate the drug concentration at each validation day, using one unique target concentration for getting the “D area/ IS area” at each of the 3 days of validation and in stability testing.
All R2 values were greater than 0.99 in all validation. Data of the standard curve with regards to correlation, slope, R2 and intercept are shown in Table 3 and Figure 4. Data in the three validation days were within the accepted ranges in terms of linearity.
Table 3: Linearity and linear working range of six calibration curves of glimepiride data based on the measured concentration.
| Calibration
Curve # |
Measured concentration for each standard point (ng/ml) | ||||||
| 20 | 50 | 100 | 200 | 300 | 400 | 600 | |
| 1 | 19.07 | 53.33 | 98.58 | 208.85 | 289.87 | 379.89 | 620.42 |
| 2 | 19.30 | 51.62 | 103.92 | 205.13 | 284.30 | 376.46 | 629.26 |
| 3 | 19.84 | 48.92 | 105.38 | 209.18 | 284.09 | 374.34 | 628.25 |
| 4 | 18.04 | 50.40 | 109.52 | 210.93 | 292.94 | 380.27 | 607.90 |
| 5 | 18.42 | 50.62 | 108.46 | 204.27 | 297.34 | 381.46 | 609.43 |
| 6 | 18.03 | 52.17 | 103.50 | 211.73 | 297.85 | 388.80 | 597.93 |
| Mean ± SD | 18.78±0.74 | 51.18±1.54 | 104.89±3.93 | 208.35±3.03 | 291.07±6.08 | 380.20±4.98 | 615.53±12.49 |
| CV% | 3.93 | 3.01 | 3.75 | 1.46 | 2.09 | 1.31 | 2.03 |
| Accuracy % | 93.92 | 102.35 | 104.89 | 104.17 | 97.02 | 95.05 | 102.59 |
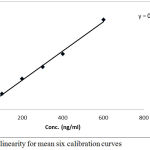 |
Figure 4: Plot of linearity for mean six calibration curves
|
Stability
From Tables 4 and 5, it can be observed that autosampler stability test is within the accepted ranges where it doesn’t exceed 15%.
Data of short term stability is specified by two QC samples (low and high) for glimepiride, after preparation method (autosampler stability), T=10°C.
Table 4: Results of glimepiride QC low samples Autosampler stability at 10°C.
| QC low (60mg/ml) | |||||||
| Time | AUC Drug | AUC IS
|
Ratios | Measured Conc. | Mean Measured | Accuracy % | Stability |
| 0.0 hr | 12281 | 7422 | 1.65 | 58.84 |
58.95 |
98.08 |
100.00 |
| 11965 | 7245 | 1.65 | 58.72 | 97.88 | |||
| 11596 | 6960 | 1.66 | 59.27 | 98.80 | |||
| 24.0 hr | 11922 | 7278 | 1.63 | 59.31 |
58.66 |
98.85 |
99.52 |
| 11000 | 6877 | 1.60 | 57.77 | 96.30 | |||
| 11466 | 7042 | 1.62 | 58.91 | 98.19 | |||
Table 5: Results of glimepiride QC high samples Autosampler stability at 10°C.
| QC low (500 mg/ml) | |||||||
| Time | AUC Drug | AUC IS
|
Ratios | Measured Conc. | Mean Measured | Accuracy % | Stability |
| 0.0 hr | 73234 | 5466 | 13.39 | 497.87 |
497.64 |
99.57 |
100.00 |
| 73043 | 5493 | 13.29 | 494.16 | 98.83 | |||
| 74519 | 5528 | 13.48 | 500.91 | 100.18 | |||
| 24.0 hr | 86069 | 6996 | 12.30 | 482.89 |
488.23 |
96.58 |
98.11 |
| 86981 | 6945 | 12.52 | 491.69 | 98.34 | |||
| 87106 | 6978 | 12.48 | 490.11 | 98.02 | |||
Specificity
Protein extraction procedure was specified and sensitive for glimepiride. Treated blank and zero samples from the six batches used clean chromatogram for specific method (Figures 1, 2 and 3)
Effect of Juices on Pharmacokinetic Parameters of Glimepiride
Glimepiride is metabolized by CYP450 and it is a substrate for p-GP OATP2B1 transporter in human.25 As shown in Figure 5, when glimepiride was administered alone, its serum level reached its maximum (258.711 ± 7.93 ng/ml) after half an hour and then gradually declined to get a minimum concentration of (130.2 ± 22.36 ng/ml) after 6 hours from the administration of glimepiride.
When glimepiride was administered in combination with grapefruit, the maximum serum concentration (266.226 ± 46.48 ng/ml) was reached after half an hour and then gradually declined to reach (131.06 ± 27.58 ng/ml).
On the other hand, combination of glimepiride and licorice showed an increasing in serum concentration approximately twice as much as the concentrations when glimepiride is given alone. At the first half, an hour of administration, it reached its maximum serum concentration (559.585 ± 44.45 ng/ml) and then gradually declined to get a minimum concentration of (81.928 ± 20.84 ng/ml) at the end of follow up period (6 hours).
Licorice significantly (p<0.05) increased the AUC-6, Cmax and t1/2of glimepiride and decreased significantly (p<0.05) clearance and elimination rate constant. But grapefruit juice had no significant (p>0.05) effect on glimepiride pharmacokinetics. The calculated kinetic parameters are shown in Table 6.
A mechanism of this increasing may be due to the suppression of metabolic enzymes required for the metabolism of glimepiride expressed as elongation in elimination half-life and decrease total body clearance as well as increase in AUC0-6. Significant change in elimination parameters suggests an interaction on elimination level. Many studies showed an inhibitory effect of liquorice on P-glycoprotein in the intestinal wall. Data of this study is not enough to characterize possible interaction on absorption level. However, tmax as an indicative parameter for absorption rate was the same when glimepiride was given alone and with liquorice.
While grape fruit juice did not affect any kinetic parameters of glimepiride. This interaction could be of clinical significance, because elevated glimepiride concentrations may increase the risk of hypoglycemia. Concomitant usage of licorice with glimepiride warrants close monitoring of blood glucose.
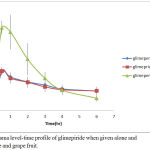 |
Figure 5: Plasma level-time profile of glimepiride when given alone and with liquorice and grape fruit.
|
Table 6: Pharmacokinetic parameters of glimepiride alone and with liquorice and grapefruit juices.
| Parameters | Glimepiride alone | Glimepiride-grape fruit | Glimepiride- liqourice |
| Cmax (ng/ml) | 258.7±7.9 | 266.2±46.5 | 584.5±85.6* |
| Tmax (hr) | 0.500 | 0.500 | 0.500 |
| AUC-6 (ng.hr/L) | 1008.58±22.65 | 984.9±30.43 | 1526.12±35.33* |
| AUMC-6(ng.hr2/L) | 1998.7±35.8 | 1921.98±4 | 2694.58±42.8* |
| MRT-6 (hr) | 1.98±0.4 | 1.95±0.5 | 1.76±0.5* |
| Kel (hr-1) | 0.500±0.01 | 0.510±0.02 | 0.252±0.13* |
| TerminalT1/2(hr) | 1.38±0.3 | 1.35±0.29 | 2.75±0.3* |
| Cl/F (ml/hr) | 29.7±8.4 | 30.45±10.2 | 19.6±6.3* |
*Significant (p<0.05)
Conclusion
A validated bioanalytical procedure with high resolution and sensitivity was developed for the evaluation of glimepiride levels in rat’s plasma. The effect of fresh liquorice beverage on the pharmacokinetic profile for glimepiride was shown to cause an increase in their bioavailability and decrease in its elimination. This is may be due to enzyme activation involved in its metabolism. While administration of grape fruit juice with glimepiride did not affect its pharmacokinetic profile.
Acknowledgment
The research team would like to express their sincere thanks to Faculty of Pharmacy and Medical Sciences – University of Petra for giving them an opportunity to complete this research successfully.
Conflict of Interest
The authors confirm that this article content has no conflict of interest.
References
- Brunetti L and Kalabalik J. Management of type-2 Diabetes Mellitus in Adults. Pharm Ther. 2012;37:687–696.
- Walsky R.L, Astuccio A. V and Obach R. S. Evaluation of 227 drugs for in vitro inhibition of cytochrome P450 2B6. J. Clin Pharmacol. 2006;46:1426–1438.
CrossRef - Nissen S.E, Nicholls S.J, Wolski K, Nesto R, Kupfer S, Perez A, Jure H, Larochellière D.R, Staniloae C.S and Mavromatis K. Comparison of pioglitazone vs glimepiride on progression of coronary atherosclerosis in patients with type 2 diabetes: the PERISCOPE randomized controlled trial. JAMA. 2008;299:1561–1573.
CrossRef - Aravind S, Tayeb K.A, Ismail S.B, Shehadeh N, Kaddaha G, Liu R, Balshaw R, Lesnikova N, Heisel O and Girman O. Hypoglycaemia in sulphonylurea-treated subjects with type 2 diabetes undergoing Ramadan fasting: a five-country observational study. Curr Med Res Opin. 2011;27:1237–1242.
CrossRef - Hermansen K, Kipnes M, Luo E, Fanurik D, Khatami H and Stein P. Efficacy and safety of the dipeptidyl peptidase‐4 inhibitor, sitagliptin, in patients with type 2 diabetes mellitus inadequately controlled on glimepiride alone or on glimepiride and metformin. Diabetes Obes Metab. 2007;9:733–745.
CrossRef - Niemi M, Kivistö K.T, Backman J.T and Neuvonen P.J. Effect of rifampicin on the pharmacokinetics and pharmacodynamics of glimepiride. Br J Clin Pharmacol. 2000;50:591–595.
CrossRef - Gore M, Sadosky A, Leslie D and Sheehan A. H. Selecting an appropriate medication for treating neuropathic pain in patients with diabetes: a study using the UK and Germany Mediplus databases. Pain Pract. 2008;8:253–262.
CrossRef - Sanofi-Aventis. Canada Inc. 2150 St. Elzear Blvd. West Laval, Quebec H7L 4A8, Date of Revision: January 21, 2013, Submission Control No.: 159440 s-a Version 3.0 dated January 21. 2013.
- Chan l. N. Drug-nutrient interaction in clinical nutrition. Curr Opin Clin Nutr Metab Care. 2002;5:327–332.
CrossRef - Lee L, Zhang W, Moy S, Kowalski D, Kerbusch V, Gelderen v.M, Sawamoto T, Grunenberg N and Keirns J. Effects of food intake on the pharmacokinetic properties of mirabegron oral controlled-absorption system: a single-dose, randomized, crossover study in healthy adults. Clin Ther. 2013;35:333–341.
CrossRef - Bailey G, Malcolm J, Arnold O and Spence D.J. Grapefruit juice–drug interactions. Br .J. Clin Pharmacol. 1998;46:101–110.
CrossRef - Dresser G.K, Bailey D.G and Carruthers S.J. Grapefruit juice–felodipine interaction in the elderly. Clin Pharmacol Ther. 2000;68:28–34.
CrossRef - Delvaux M.M and Gay G. Drugs affecting visceral sensitivity: Ready for the prime time?Dig Dis. 2006;24:99–104.
CrossRef - Won C.S, Oberlies N.H and Paine M.F. Mechanisms underlying food–drug interactions: inhibition of intestinal metabolism and transport. Pharmacol Ther. 2012;136:186–201.
CrossRef - Dajeha M, Mallah E, Awada R, Dayyih A.W, Elhajji F, Al-Ani I, Othman B and Arafat T. Determination of carbamazepine in rat plasma in the presence of licorice juice by using HPLC and its pharmacokinetic applications. J. Chem Pharm Res. 2015;7:116–126.
- Al-Shaikhli T, Dayyih A.W, Mallah E, Hamad M, Qina N and Arafat T. Determination of Atorvastatin Pharmacokinetic Parameters by LC/MS-MS with Traditional Liquorice Beverage. Ad Anala Chem. 2015;5:17- 24
- Dayyih A.W, Mallah E, AL-Ani I and Arafat T. Liquorice beverage effect on the pharmacokinetic parameters of atorvastatin, simvastatin, and lovastatin by liquid chromatography-mass spectroscopy/mass spectroscopy. Asian J Pharm Clin Res. 2016;9:174–179.
- Dayyih A.W, Eyad E, Hamad M and Al-Kawaz A. A study of the possible effect of pomegranate juice on the pharmacokinatics of candesartan in rat plasma by using a bioanalyticalmethod- liquid chromatography/mass spectrometry (HPLC/MS/MS). Int J pharm tech. 2016;8:10200–10216.
- Mallah E, Rayyan A.W, Dayyih A.W, Elhajji F, Mansour K, Al-Majal S, and Arafat T. Dose-Dependent Synergistic effect of Pomegranate Juice on the Bioavailability of Sildenafil in Rats by Using HPLC Method. Lat Am J Pharm. 2016;35:1277–12284.
- Davis S.N. The role of glimepiride in the effective management of type 2 diabetes. J Diab Complicat. 2004;18:367-376.
CrossRef - Matsuki M, Matsuda M, Kohara K, Shimoda M, Kanda Y, Tawaramoto K, Shigetoh Y, Kawasaki F and Kotani K. Pharmacokinetics and pharmacodynamics of glimepiride in type 2 diabetic patients: compared effects of once-versus twice-daily dosing. Endocr J. 2007;54:571–576.
CrossRef - Antonesi I.M, Potur R, Potur D, Ghiciuc C.M and Lupuşoru C.P. Pharmacokinetic modeling of glimepiride plasma concentration in healthy subjects. Rev Med Chir Soc Med Nat Iasi. 2010;115:949–953.
- Rosenkranz B, Profozic V, Metelko Z, Mrzljak V, Lange C and Malerczyk V. Pharmacokinetics and safety of glimepiride at clinically effective doses in diabetic patients with renal impairment. Diabetologia. 1996;39:1617–1624.
CrossRef - Rao R.P, Singh S, Jain A K and Srinivasan B.P. Dual therapy of rosiglitazone/pioglitazone with glimepiride on diabetic nephropathy in experimentally induced type 2 diabetes rats. J Biomed Res. 2011;25:411–417.
CrossRef - Lilja J.J, Niemi M, Fredrikson H and Neuvonen P.J. Effects of clarithromycin and grapefruit juice on the pharmacokinetics of glibenclamide. Br J Clin Pharmacol. 2007;63:732–740.
CrossRef

