
Amine Sadat Tajani1, Atoosa Haghighizadeh2, Vahid Soheili1, Salim Mirshahi3 and Omid Rajabi1,4
1Department of Drug and Food control, School of Pharmacy, Mashhad University of Medical Sciences, Mashhad, Iran.
2Department of Research and Development, Dr Rajabi pharmaceutical Company, Mashhad, Iran.
3School of Mechanical Engineering, Sharif University of Technology, International Campus, Tehran, Iran.
4Department of Medicinal Chemistry, School of Pharmacy, Mashhad University of Medical Sciences, Mashhad, Iran.
Corresponding Author E-mail: Rajabio@mums.ac.ir
DOI : https://dx.doi.org/10.13005/bpj/1210
Abstract
The majority of patients and doctors in Iran still prefer to consume the brand-name drugs for treatment of various diseases. Sertraline-HCl is one of the drugs that the generic and brand-name ones distribute widely in the market. In this study, drug product specifications such as content uniformity, uniformity of mass, dissolution test including dissimilarity (F1) and similarity factors (F2) and dissolution efficiency (DE%) values of 8 generic and 3 brands of sertraline-HCl tablets (100 mg) were compared. Regarding to the results, relative standard deviation (RSD) ranges of weight variation test for generic and brand-name samples were 0.88 to 3.43% and 0.70 to 1.22%, respectively. For the amount of active pharmaceutical ingredient (API) per tablet RSD were 4.27 to 28.08% and 4.10 to 4.72%, respectively. Moreover, F1 and F2 in dissolution test indicated the lack of similarity between generic and brand-name ones. In the case of DE%, there was similarity between brand-name samples while most of the generic drugs showed less DE% (P<0.005). Consequently, it seems that the distribution of API in generic samples was not homogenous. The average amounts of API in most of generic samples were also less than 100 mg. Finally, the amount of API per tablet, DE% and drug release pattern of the generic drugs show lack of consistency for a suitable formulation.
Keywords
API; Sertraline; Bioequivalence; Dissolution test;Drug release pattern
Download this article as:| Copy the following to cite this article: Tajani A. S, Haghighizadeh A, Soheili V, Mirshahi S, Rajabi O. In Vitro Bioequivalence Study of 8 Generic and 3 Brands of Sertraline-HCl Tablets in Iran Market. Biomed Pharmacol J 2017;10(3). |
| Copy the following to cite this URL: Tajani A. S, Haghighizadeh A, Soheili V, Mirshahi S, Rajabi O. In Vitro Bioequivalence Study of 8 Generic and 3 Brands of Sertraline-HCl Tablets in Iran Market. Biomed Pharmacol J 2017;10(3). Available from: http://biomedpharmajournal.org/?p=16438 |
Introduction
Bioequivalence study is based on the evaluation of diverse brands of a similar drug and its dosage forms. Generally, two different formulations of a similar medicine are called bioequivalent when it is demonstrated that their dissolution rate and absorption is identical (Abbirami et al., 2013). Since production and consumption of generic drugs are growing, the bioequivalence studies are also increasing. Nowadays, pharmaceuticals become more expensive because the original drugs’ cost rises. They can be cheaper by substituting generic copies (Abbirami et al., 2013, Hailu et al., 2013). However, the process of approving generic drugs is not as precise of brand medications add evidences show variable therapeutic reactions to equivalent brand pharmaceuticals and their generic copies (Desmarais et al., 2011). Moreover, batch-to-batch variations have also been reported. The reasons may be caused by the dissimilarity in rate and degree of absorption, diversity in the purity of active pharmaceutical ingredient (API), type of excipients, proportion between them and producing variables including the influence of mixing method, granulation procedure and coating parameters (Pal et al., 2014, Parvin et al., 2012). Therefore, post marketing monitoring is employed to improve the possible problems of an approved medicine.
Bioequivalence studies are conducted in two ways: in vitro and in vivo. In vivo bioequivalence research is usually performed in humans and animals by measuring both rate and extent of drug absorption after a drug has been administered (Abbirami et al., 2013). In contrast, In vitro bioequivalence research is performed in dissolution equipment. All the essential biological conditions are simulated and samples are collected and analyzed periodically. In vitro studies enable us to have a control over the system. Additionally, it allows mimicking the biological conditions. In vitro studies reduce both cost and number of tests and also have benefits in the field of ethical considerations, drug performance and stability studies (Hailu et al., 2013, Abbirami et al., 2013, Poongothai et al., 2011).
Sertraline hydrochloride (Sertraline-HCl) belongs to SSRI family which specifically inhibits neuronal serotonin reuptake. Its efficacy has been shown in different psychological disorder including major depressive disorder (MDD), obsessive-compulsive disorder (OCD), panic disorder, dysthymia, social phobia, post-traumatic stress disorder and premenstrual dysphoric disorder (Almeida et al., 2005, Koytchev et al., 2004, Xu et al., 2014). Considering to the widespread applications of this drug, it is necessary to compare different generic copies with brand ones.
In the present study, the drug product specifications such as content uniformity, uniformity of mass, dissolution test through various statistical methods including dissimilarity factor (F1), similarity factor (F2) and dissolution efficiency (DE%) values of 8 generic and 3 brands of sertraline-HCl tablets (100 mg) had been evaluated and were compared through analysis of variance.
Materials and Methods
Eight generic and three brands of sertraline-HCl having label strength 100 mg were purchased from a retail pharmacy in Mashhad, Iran. All samples were performed within product expiration dates (Table 1). Methanol and acetonitrile (HPLC grade), phosphoric acid, sodium acetate and glacial acetic acid were purchased from Merck. Pure sertraline-HCl was a gift sample from Sobhan Pharmaceutical Co., Iran.
Uniformity of Weight (Anonymous, 2011)
The average tablet weight was determined by weighing 20 tablets individually using a digital analytical balance (AND GF-300, Japan).
Uniformity of Content (Anonymous, 2011)
Preparation of Standard Solution for Sertraline-HCl- 50 mg of pure sertraline-HCl was dissolved in a 1000 mL volumetric flask and made up the volume with methanol and 0.1% (V/V) phosphoric acid (1:1).
Preparation of Sample Solution for Sertraline-HCl Tablets- 30 tablets from each company were selected randomly. 10 tablets of 30 were chosen. Each tablet was placed individually in a 500 mL volumetric flask. 250 mL phosphoric acid 1% was added to the flask and sonicated for 15 min with intermittent shaking to disperse. 200 mL methanol was added to the flask and sonicated for an additional 10 min. Then the solution was diluted with methanol to the volume at 20°C. 25 mL of the solution was transferred to another 100 mL flask and diluted with methanol and 0.1% (V/V) phosphoric acid (1:1). 50 mL of the solution was passed through a nylon filter of 0.22 µm and collected. The experiment was repeated for 20 other tablets if necessary, according to the method described.
Chromatographic System
The analysis of sertraline-HCl in each solution was conducted by injection of different samples into a KNAUER HPLC (Germany). The HPLC was equipped with an Ascentis® ES-Cyano HPLC Column (4.6 mm × 25 cm; 5 µm, Sigma-Aldrich) and a UV detector (KENAUER S2600) set at 210 nm at 30°C. The employed mobile phases were methanol and 0.1% (V/V) phosphoric acid (1:1). The flow rate was set to 1.5 mL/min and the injection volume was 10 µL.
Method of Analysis
The percentage of sertraline in each sample was calculated by the following equation:
Result = (rU/rS) × (Mr1/Mr2) × 100 (2.1)
Which rU and rS are peak response from the sample and standard solution, and Mr1 and Mr2 are molecular weight of sertraline and sertraline-HCl, respectively.
For calculation of acceptance value (AV) the following formula was used:
Acceptance value = │M-X│+ KS (2.2)
In which M is the reference value, X is the mean of individual contents expressed as a percentage of the label claim, K is the acceptability constant (If the number of individuals is 10 then K=2.4, and if the number of individuals is 30, then K=2.0), and S is the sample standard deviation.
Dissolution Test
Dissolution test has performed on 6 tablets of each brand using the USP monograph method (Anonymous, 2011) with 900 mL acetate buffer (containing 3.0 g/L of sodium acetate trihydrate and 1.6 mL/L of glacial acetic acid, adjusted with glacial acetic acid to pH=4.5); in an automated dissolution tester (Pharm test, PTWS 3E, Germany) using the USP apparatus 2 (paddle) method. Dissolution studies were carried out with automated dissolution tester. The bath temperature and paddle speed were set at 37°C and 75 rpm, respectively. 5 mL samples were withdrawn and replenished with the same volume of fresh medium using a bulb pipette 5.0 mL with 5 min interval. The samples were passed through a nylon filter of 0.22 µm and collected.
Standard Solution
A solution of sertraline-HCl (0.056 mg/mL) in acetate buffer (with the earlier mentioned mixture and pH) was prepared.
Chromatographic System
Analysis of sertraline-HCl in each sample were conducted by injection of 10 µL into a KNAUER HPLC (Germany), equipped with an Ascentis® ES-Cyano HPLC Column (4.6 mm × 25 cm; 5 µm, Sigma-Aldrich) and an UV detector (KENAUER S2600). The absorption wave length was set at 210 nm at 40°C. The employed mobile phases were acetonitrile and 0.1% (V/V) phosphoric acid (1:3). The flow rate was set to 1.5 mL/min.
The percentage of dissolved sertraline was taken by the following equation:
Result = (rU/rS) × (CS/L) × (Mr1/Mr2) × D × V × 100 (2.3)
Which rU and rS are peak response from the sample and standard solutions, and Mr1 and Mr2 are molecular weight of sertraline and sertraline-HCl, respectively. CS is the concentration of standard solution (0.056 mg/mL), L is label claim (100 mg), V is the volume of medium (900 mL) and finally, D is dilution factor for the sample solution (0.0222).
Fit Factors (Kumpusiri and Maneesatid., 2005, Andrade et al., 2002, Shah et al., 1998)
For comparison of in vitro dissolution profiles, similarity and difference factors are emphasized by US FDA. In this study, the dissolution test was performed in such a way that similarities and differences between all samples (generic and brands) were compared. In this section Zoloft was chosen as a reference. Moreover, the differences and similarities for dissolution pattern between the samples of each group were also examined. In this regard, those with maximum dissolution rate, was considered as a reference and other samples were compared by that. In addition, the dissolution test results were used to determine the dissolution efficiency for any pharmaceutical company.
Similarity Factor (F2)- F2 emphasizes on the comparison of closeness of two comparative formulations. The F2 parameter is commonly used to establish similarity of two dissolution profiles. The FDA defines F2 as the logarithmic reciprocal square root transformation of one plus the mean squared (the average sum of squares) differences of drug percent dissolved between the test and the reference products. The formula to find similarity factor is as follows (Anonymous, 2011):
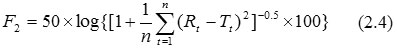
Rt and Tt are respectively the dissolved cumulative percentage of the reference and test product at the selected time points. Two profiles are considered to be the same when F2=100. F2 value results in 50 at an average difference of 10% for all measured time points. F2 values between 50 and 100 indicate similarity of two dissolution profiles. Therefore, a quick way to establish similarly of two profiles is to see if differences in dissolution results at each sampling time are less than 10%. F2 is suggested for evaluating product formulations and to find out whether there exists any manufacturing differences (Andrade et al., 2002, Shah et al., 1998, Moore and Flanner, 1996).
Dissimilarity Factor (F1)- F1 focuses on the difference of dissolved (in percent) between reference and test at various time intervals. So, the factors directly compare the difference between the percent of drug dissolved per unit time for a test and a reference product. F1 is used to calculate the approximate percent error in drug release profile. F1 should be between 0 and 15. F1 is given as (Anonymous, 2011):
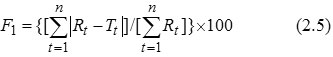
Rt and Tt are respectively the dissolved cumulative percentage of the reference and test product at the selected time points (Anderson et al., 1998).
Zoloft was usedas thereferencetothe similarityanddissimilarityof dissolution pattern for differentcompanies. For this trial, the average chart of dissolution test for tablets of each pharmaceutical company was compared with Zoloft pattern.
In order to assessment of variations in dissolution profiles for each company, comparison between dissolution rates of the selected tablets was carried out. The dissolution pattern of tablet with maximum solubility rate was considered as a reference for the same group.
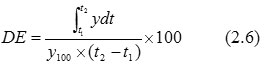
Dissolution Efficiency (DE) (Vaughan and Tucker, 1976)– DE is the area under the dissolution curve within a time range (t2 – t1) expressed as a percent of the dissolution curve at maximum dissolution y100, over the same time frame (Shah et al., 1998). In this study t1 and t2 were 0 and 15 min.
Results and Discussion
Uniformity of Dosage Units
Weight variation– 10 tablets of each brands weighted and the mean weight, SD and RSD were calculated, and illustrated in Table 2. Factors that affect tablet weight includes tooling of the compression machine, head pressure, machine speed and flow properties of the powder (Gad, 2008). Studying the RSD% of the tablet weights shows that both generic and brand-name tablets have RSD less than 5% which is statistically acceptable. Most SD was observed for “A” with RSD=3.43%.
Table 1: Mean Weight, SD and RSD% for uniformity of weight test used for different sertraline-HCl tablets.
| Formula Code | A | B | C | D | E | F | G | H | I | J | K |
| Mean Weight (g) | 0.30 | 0.31 | 0.26 | 0.30 | 0.47 | 0.30 | 0.23 | 0.30 | 0.30 | 0.42 | 0.30 |
| SD | 0.010 | 0.002 | 0.003 | 0.002 | 0.006 | 0.003 | 0.002 | 0.003 | 0.002 | 0.005 | 0.003 |
| RSD (%) | 3.43 | 0.88 | 1.37 | 0.94 | 1.44 | 1.16 | 0.94 | 1.22 | 0.70 | 1.21 | 1.22 |
Content Uniformity
Content uniformity is the degree of uniformity in the amount of API among dosage units. The results of the sertraline content uniformity test based on USP 2013 (general chapter 905) for different companies are shown in Table 3 (Anonymous, 2011). The results indicated that all brand-name tablets passed this test whereas just only one generic tablet (“G”) was accepted. While the amount of API in brand-name samples is closer to the maximum acceptable level, the average amount of API in generic tablets is often less than the minimum. The SD of API in generic samples was much higher than brand ones.
Table 2: Amount of sertraline-HCl in different tablets
| Formula code | A | B | C | D | E | F | G | H | I | J | K |
| Mean Content (mg) | 83.24 | 83.25 | 83.67 | 88.29 | 85.80 | 100.76 | 99.15 | 97.25 | 102.99 | 101.67 | 103.12 |
| SD | 23.37 | 12.16 | 8.86 | 17.50 | 18.93 | 7.43 | 4.21 | 9.25 | 8.27 | 4.86 | 4.69 |
| N | 30 | 30 | 30 | 30 | 30 | 30 | 10 | 30 | 30 | 10 | 10 |
| Acceptance Value | 62.00 | 32.96 | 32.54 | 45.21 | 50.56 | 14.86 | 10. 10 | 19.74 | 18.04 | 11.85 | 12.97 |
| RSD (%) | 28.08 | 15.54 | 10.60 | 19.82 | 23.72 | 7.37 | 4.24 | 9.514 | 8.03 | 4.78 | 4.55 |
In other side, the dissolution pattern of all tablets confirmed that generic drugs have little resemblance to Zoloft, whereas brand-name drugs are very similar to it (Table 4).
Table 3: F1 and F2 of dissolution pattern used for tablets of various manufactures vs. dissolution pattern of reference sample (Zoloft)
| Formula Code | A | B | C | D | E | F | G | H | I | J |
| F1 | 21.74 | 43.84 | 14.05 | 30.8 | 17.8 | 22.78 | 9.776 | 10.58 | 10.94 | 10.97 |
| F2 | 35.88 | 23.36 | 46.9 | 32.12 | 47.36 | 38.1 | 55.31 | 52.66 | 54.27 | 50.11 |
Dissolution Test
On the other hand, dissolution profiles of different sertraline-HCl tablets are compared with each other (Figure 1). The dissolution profile of 6 studied tablets in dissolution test indicates that the brand-name drugs have very similar patterns. Conversely, the dissolution pattern of generic drugs has no resemblance to each other, basically (Table 4 and 5).
Table 4: Inside comparison of factors, similarities and differences related to the tablet dissolution, selected from each company
| Formula Code | A | B | C | D | E | F | G | H | I | J | K |
| F1 | 81.38 | 17.71 | 11.58 | 27.45 | 17.84 | 34.43 | 15.29 | 20.69 | 10.61 | 11.31 | 10.05 |
| F2 | 22.74 | 45.31 | 49.7 | 37.08 | 42.36 | 37.58 | 40.94 | 38.57 | 55.98 | 56.11 | 59.35 |
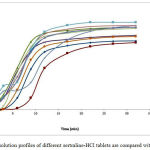 |
Figure 1: dissolution profiles of different sertraline-HCl tablets are compared with each other
|
Average DE% of 6 tablets of each pharmaceutical company is shown in Table 6. The results displayed that Zoloft, Asentra, Sertraline-Hexal and two of the generic drugs (G, E) have the most DE%. There was a significant difference between dissolution efficiency of brands and 6 other generics (P<0.005). RSD for 5 generic drugs is more than the rest (11.59-17.87).
Table 5: Average DE% of tablets for all companies with their SD and RSD%.
| Code | A | B | C | D | E | F | G | H | I | J | K |
| DE% | 58.78 | 56.73 | 68.06 | 66.24 | 77.17 | 66.83 | 74.22 | 68.06 | 73.62 | 75.08 | 74.24 |
| (mean) | |||||||||||
| SD | 9.31 | 7.09 | 7.89 | 10.74 | 13.78 | 4.09 | 4.33 | 4.31 | 3.25 | 3.41 | 3.28 |
| RSD% | 15.84 | 12.5 | 11.59 | 16.21 | 17.86 | 6.12 | 5.83 | 6.33 | 4.41 | 4.54 | 4.42 |
The average percentage of drug dissolved in 15 and 30 minutes was also determined. The results showed that the average percent of dissolution for tablets of one generic pharmaceutical company was less than the standard of pharmacopoeia (80% of the label). However, the SD of generic tablets were significantly higher than the brand-name ones (p<0.005). The average percentage of drug dissolved in 15 minutes was more than 60% for all tablets. At this time, the SD of generic drugs for brands were significantly higher (p<0.005). Percentage of drug dissolved in 15 and 30 minutes were declared in the Table 7. Considering to the dissolution test all generic medications, except one, were approved. However, the other examined parameters showed poor quality control in the production of generic pharmaceuticals. Therefore, it is recommended that the evaluation of generic products is not only limited to the dissolution test, and more calculations like DE and similarity should be evaluated.
Table 6: Percent of drug dissolved in 15 and 30 minutes
| Code | A | B | C | D | E | F | G | H | I | J | K |
| Drug dissolved% in 30 min | 99.09 | 78.87 | 95.57 | 80.91 | 87.39 | 86.03 | 96.93 | 97.05 | 97.16 | 99.15 | 103 |
| SD | 21.21 | 10.12 | 18.21 | 7.56 | 3.32 | 8.21 | 12.55 | 12.24 | 3.72 | 1.85 | 2.44 |
| CV% | 21.4 | 12.83 | 19.05 | 9.34 | 3.8 | 9.54 | 12.94 | 12.61 | 3.82 | 1.87 | 2.37 |
| Drug dissolved% in 15 min | 76.1 | 61.2 | 90.3 | 75.2 | 82.1 | 77.9 | 89.3 | 92.2 | 89.9 | 93.2 | 96.8 |
| SD | 31.31 | 5.31 | 30.22 | 13.21 | 6.56 | 23.12 | 5.65 | 16.55 | 7.31 | 8.11 | 1.12 |
| CV% | 41.1 | 8.68 | 33.46 | 17.57 | 7.99 | 29.68 | 6.32 | 17.95 | 8.13 | 8.7 | 1.14 |
Conclusion
In the current experiment, multi brands and generics of sertraline HCl tablets were compared through in vitro bioequivalence studies to provide an idea about therapeutic activity of the dosage form. Despite the acceptable weight deviation test for all tablets, content uniformity test of 5 tablets of 8 generic manufacturers were unacceptable. However, the average amount of API in the samples of mentioned companies is also less than the standard of pharmacopoeia (less than 90% of the label). Dissolution pattern, considering F1 and F2 factors, illustrates that the brand-name samples follow up a similar pattern, whereas the generic samples do not pursue a specific model and they lack similarity to brand ones. No great similarity between tablets of the same company can be seen. Therefore, due to the impact of dissolution rate on drug absorption it is expected that the treatment process faced disruptions, which in turn leads to the consumer tendency to the brands.
This research indicated the lack of adequate supervision of quality control and quality assurance departments for sertraline-HCl (100 mg) tablets. In addition, the manufacturing part needs to be more careful about the selection and formulation of excipients type and proportion. Finally, usage of F1, F2 and DE% are recommended techniques to achieve generic drugs with maximum similarity to the brand ones. Future in vitro bioequivalence studies are necessary for other pharmaceuticals and dosage forms.
Acknowledgement
We thank Dr.Masoud goharimanesh (Department of Mechanical Engineering, Ferdowsi University of Mashhad) and Parisa tavakkoli (Sun Air Research Institute, Ferdowsi University of Mashhad) for their valuable discussions. The authors appreciate the Research Council of Mashhad University of Medical Sciences (MUMS) for the financial support.
References
- Abbirami V., Sainithya P., Shobana A., Devi D. R & Hari B. V. A Review on In-vitro Bioequivalence Studies and its Methodologies. International Journal of ChemTech Research. 2013;5:2295.
- Almeida S., Portolés A., Terleira A., Filipe A., Cea E & Caturla M. C. Comparative bioavailability/bioequivalence of two different sertraline formulations: A randomised, 2-period × 2-sequence, crossover clinical trial in healthy volunteers. Arzneimittel-Forschung/Drug Research. 2005;55:191-197.
- Anderson N., Bauer M., Boussac N., Khan-Malek R., Munden P & Sardaro M. An evaluation of fit factors and dissolution efficiency for the comparison of in vitro dissolution profiles. J Pharm Biomed Anal. 1998;17:811-822.
CrossRef - Andrade C. B. M., Mylius L. C., Silva N. M., Steppe M., Schuck V. J. A., Shapoval E. S & Costa T. D. Evaluation of the dissolution efficiency and similarity factor f2 for the comparison of dissolution profiles in vitro. Rev Bras Farm. 2002;83:19-26.
- Anonymous Usp34-Nf29, Baltimore, United Book Press. 2011.
- Desmarais J. E., Beauclair L & Margolese H. C. Switching from brand-name to generic psychotropic medications: A literature review. CNS Neuroscience and Therapeutics. 2011;17:750-760.
CrossRef - Gad S. C. Pharmaceutical manufacturing handbook: production and processes, New Jersey, John Wiley & Sons. 2008.
- Hailu G. S., Gutema G. B., Hishe H. Z., Ali Y. S & Asfaw A. A. Comparative In vitro Bioequivalence Evaluation of Different Brands of Amoxicillin Capsules Marketed in Tigray, Ethiopia International Journal of Pharmaceutical Sciences and Nanotechnology. 2013;6:1966-1971.
- Koytchev R., Ozalp Y., Erenmemisoglu A., Van Der Meer M. J & Alpan R. S. Serotonin reuptake inhibitors: Bioequivalence of sertraline capsules. Arzneimittel-Forschung. Drug Research. 2004;54:629-633.
- Kumpusiri S & Maneesatid P. The dissolution procedure: Development and validation. Pharmacopeia forum. 2005.
- Moore J. W & Flanner H. H. Mathematical comparison of curves with an emphasis on in-vitro dissolution profiles. Pharm Tech. 1996;20:64-74.
- Pal T. K., Ghosh U & Panda M. Comparative Bioequivalence Study of Different Brands of Telmisartan Tablets Marketed in India by Dissolution Modeling and Quality Control Tests. International Journal of Pharmaceutical and Phytopharmacological Research (eIJPPR). 2014;3:1-22.
- Parvin Z. M., Peyman N. M., Saeed G., Mahboob N & Hadi V. In-vitro bioequivalence study of 8 brands of metformin tablets in Iran market. Journal of Applied Pharmaceutical Science. 2012;2:194.
- Poongothai S., Balaji V., Madhavi B., Reddy A. R., Ilavarasan R & Karrunakaran C. M. A Sensitive Dissolution Test Method for the Development and Validation of Levetiracetam Tablets by Reverse Phase-HPLC Technique. International Journal of PharmTech Research. 2011;3:1023-1032.
- Shah V. P., Tsong Y., Sathe P & Liu J. In vitro dissolution profile comparison-statistics and analysis of the similarity factor, f2. Pharm Res. 1998;15:889-896.
CrossRef - Vaughan D. P & Tucker G. T. An analysis of the applications of dissolution efficiency. J Pharm Pharmacol. 1976;28:932-933.
CrossRef - Xu Z. S., Zhu H. Y & Tang C. R. Development and validation of a HPLC method for determination of sertraline in human plasma and its application to bioequivalence study. Latin American Journal of Pharmacy. 2014;33:326-331.

