Manuscript accepted on :November 16, 2010
Published online on: 25-11-2015
Plagiarism Check: Yes
Ashwini Kumar Khandelwal, T. Chakraborty*, M. Baidya, P. K. Shibil and G. Nagesh
Krupanidhi College of Pharmacy, Chikkabellandur, Carmelram Post, Bangalore- 35 India.
Abstract
Normal development in children is very essential to have a healthy life which can be given by proper diet and physical activities. The main goal of this survey was to find out the percentage under or over development of children and the main factors responsible for it. A survey was made on the basis of simple questionnaire which was filled by the children volunteers with the help of our investigation team and their teachers. The children volunteers were selected randomly from different primary school in Bangalore of age group 6-14 including both genders. All the data filled by children volunteers were collected, screened and statistically validated. The number of volunteers both males and female were M-56.09% & F-43.9% respectively and it was found that 96% of the children were under developed and 2.2% were normally developed. The main reason of under development was found to be the eating habits, not playing healthy games. Only 6.5% of children have normal diet as prescribed by paediatrician and the remaining 93.5% of children were not found to take a normal diet. The percentage of the children who do not go for playing due to home work was 84.13%. Hence awareness among parents should be created in order to regulate under development of children. They should offer a wide variety of food to ensure that their child is getting enough. The community pharmacist along with other medical professionals should join hands to educate the parents and their child for better growth in them since they are future of our nation.
Keywords
Child development; questionnaire; under developed
Download this article as:| Copy the following to cite this article: Khandelwal A. K, Chakraborty T, Baidya M, Shibil P. K, Nagesh G. Community Based Survey on the Child Development. Biomed Pharmacol J 2010;3(2) |
| Copy the following to cite this URL: Khandelwal A. K, Chakraborty T, Baidya M, Shibil P. K, Nagesh G. Community Based Survey on the Child Development. Biomed Pharmacol J 2010;3(2). Available from: http://biomedpharmajournal.org/?p=1625 |
Introduction
Physical growth and maturation are often used as indicators of child health because they are sensitive to nutritional deficiencies, infection, and poverty. Growth is a very adaptable process that will slow in the face of extreme nutritional deficiency, for example, as a mechanism to conserve nutrients for body functions essential to the child’s survival. Growth will resume or even catch up at faster rates than normal when the nutritional deficits are remedied. This sensitivity to health and environmental constraints makes growth an excellent indicator of the adequacy of nutrition and the health of individuals and of populations. As basic indicators of health, pediatricians compare the attained stature and weight of children and their rates of growth with the expected values for healthy children or with growth standards1.
When nutritional energy (calories from food) is in excess of what the body uses and what is expended in physical activity, it is stored in adipose tissue. This fat tissue is accumulated within the body and subcutaneously (under the skin). The growth in weight of children and measurements of the thickness of the subcutaneous fat by calipers are used as indicators of overweight and obesity. Sometimes the weight of children is expressed as an index relative to stature (calculated by dividing the weight, in kilograms, by the square of stature, in meters) to yield the body mass index (BMI). BMI standards are also commonly used to define overweight and obesity and to relate these conditions to various health outcomes2,3.
Physical growth includes many aspects of the biological development of children that can reflect genetics, nutrition, health, and the environment. The aspects of physical growth are central to the child’s progress toward adulthood, and they inevitably interact with psychological, behavioral, and social aspects of the developing child4,5.
Objective
The main goal of this survey was to find out the percentage of child development with refers to body weight, height and BMI, and fiend out the obeys or underdevelopment and correlate their reason behind that, which may create awareness among the parents and the society.
Materials and Methods
The survey was conducted on school students of age group 6-14years including both genders about their physical development and other normal regular activity. The survey was conducted in different schools of Bangalore. The survey was made on the basis of simple questionnaire which was prepared by the skilled investigation team by taking the help of, pharmacist, paediatrician and standard journals. The different questioner include body weight, Height, BMR (measured by investigator team by standard weighing machine), food habit include intake of green vegetables, vitamins, fruits, and other physical and mental activity. The investigators were trained in the college regarding the survey. The questionnaire was filled by the volunteers them selves with the help of investigation team. It was done over a month from 27th June 2010 to 9th July 2010. The investigator team was actively responsible to answer the queries of the volunteers related to the questionnaire6.
Results and Discussions
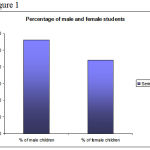
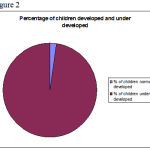
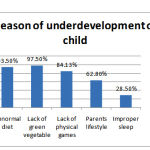
All the data collected were screened and statistically validated. The total number of volunteers both males and femaleM-56.09%& F-43.9% (Table 1 and Figure 1). From the Body weight, Height and BMR data it was found that 96% of the children were under developed and 2.2% were normally developed (Table 2 and Figure 2). The main reason correlated with the under development in children was found to be the eating habits which include more intake of junk food and having lack of green vegetable, vitamins, and essential diet like milk and egg. The other important reason was found that most of the children are addicted with computer game or watching TV even they were not playing healthy games which may be because of home work, private tuitions, some time the parent’s lifestyle also plays an important factor for this. The data showed that only 6.5% of children have normal diet and the remaining 93.5% of children were found not to take a normal diet. Only 2.5% of the children like to have green vegetables. The percentage of the children who do not go for playing due to home work was 84.13%. The percentage of the children who were under developed due to their parent’s life style was 62.8%. The percentage of children who do not attain a proper sleep was 28.5% (Table 3, figure 3).
Table 1: Percentage of male and female students
| % of male children | % of female children |
| 56 | 43.9 |
Table 2: Percentage of children developed and under developed.
| % of children normally developed | % of children under developed |
| 2.2 | 96 |
Table 3: Reasons of under development in children.
| Reasons | Percentage |
| Abnormal diet | 93.5 |
| Lack of green vegetable | 97.5 |
| Lack of physical games | 84.13 |
| Parents lifestyle | 62.8 |
| Improper sleep | 28.5 |
 |
Figure 1:
|
 |
Figure 2:
|
 |
Figure 3:
|
Conclusion
Hence awareness should be created in order to regulate under development. Parents play a big role in their child’s life. They should offer a wide variety of food to ensure that their child is getting enough nutrition.
The community pharmacist along with parents and other medical professionals should join hands to educate the children’s for better growth in them since they are future of our nation.
This survey proves to be a stepping stone to bring about the awareness between the mass about how important it is to live a healthy life. I am proud that our institution was the one to initiate this propaganda but it is equally important for the Karnataka govt. to carry out the large scale surveys across Karnataka. Though Bangalore being a metropolitan, results was staggering so there is no doubt that the conditions would be even more pitiable in the rest of the districts across Karnataka. Hence the govt. should provide subsidy’s to improve the socio-economic condition in Karnataka as well as India.
Acknowledgement
We are very much thankful to the chairman of the krupanidhi Institution Dr. Prof. Suresh Nagpal to giving us opportunity and helping us morally to carry out the survey.
Refrencess
- Buckler, J. M. H. A Reference Manual of Growth and Development, 2nd edition. Oxford: Blackwell Science, 1997.
- Eveleth, Phyllis B., and James M. Tanner. Worldwide Variation inHuman Growth, 2nd edition. Cambridge, : Cambridge University Press, 1990.
- Himes, John H., ed. Anthropometric Assessment of Nutritional Status. New York: Wiley, 1991.
- Malina, Robert M., and Claude Bouchard. Growth, Maturation, and Physical Activity. Champaign, IL: Human Kinetics, 1991.
- Da Silva JV, Timóteo AK, dos Santos CD, Fontes G, da Rocha EM.Food consumption of children and adolescents living in an area of invasion in Maceio, Alagoas, Brazil. Rev Bras Epidemiol.2010 Mar;13(1):83-93.
- Tarini A, Bakari S, Delisle H The overall nutritional quality of the diet is reflected in the growth of Nigerian children. Sante. 1999 Jan-Feb;9(1):23-31.


