
Meenakshi Sood
Department Jaypee University of Information Technology, Waknaghat, Solan, H.P. India.
Corresponding Author E-mail: Meenakshi.sood@juit.ac.in
DOI : https://dx.doi.org/10.13005/bpj/1170
Abstract
The problem of diagnosis and treatment of epileptic seizures to aid neurophysiologists suggests the development of automated seizure onset detection systems. The purpose of the quantitative research is to determine the best classifier having highest rates of classification. This research work compares the classification results between seizure and non-seizure and inters ictal activity using Neural Network, Support Vector Machine and Radial Basis function machine learning techniques. It has been illustrated from results that the neural network classifier outperforms for the present research work. The differences between classification accuracy exhibited by the different classifiers are small, but the superiority of neural network as compared to support vector machine classifier and radial basis function was sustained by classification acuuracy, sensitivity, specificity and ROC curve.
Keywords
Electroencephalogram; Neural networks; Receiver Operating Curve Support Vector Machine;
Download this article as:| Copy the following to cite this article: Sood M. Performance Analysis of Classifiers for Seizure Diagnosis for Single Channel EEG Data. Biomed Pharmacol J 2017;10(2). |
| Copy the following to cite this URL: Sood M. Performance Analysis of Classifiers for Seizure Diagnosis for Single Channel EEG Data. Biomed Pharmacol J 2017;10(2). Available from: http://biomedpharmajournal.org/?p=14706 |
Introduction
Various neuro-imaging techniques are available as X‐ray, angiography, electroencephalogram (EEG), magnetoencephalogram (MEEG) CT scan, ultrasound, single photon emission computed tomography (SPECT) functional magnetic resonance imaging (fMRI), positron emission tomography (PET) to analyze and infer electro‐physiological phenomenon occurring in human brain.1 Out of these techniques EEG is less expensive, more precise, has excellent time resolution and can be acquired non‐invasively, which makes this technique more frequently used. The electroencephalogram (EEG) signals provide vital information about the activity of human brain in terms of electrical characteristics. EEG signals are recorded from human scalp as the electrical fluctuations produced on the scalp.2 These voltage fluctuations are caused by the flow of billions of neurons ionic current that are transported across the membranes and charge the neurons. The wave of ions reaches the electrodes on the scalp and produces the voltage difference that is measured by voltmeter whose readings are measured as the EEG potential. Neuron generates too small of a charge and it is the summation of thousands of neurons acting synchronously, possessing similar spatial orientation which is measured as EEG signal.
As EEG signals are non-invasive electrical brain signal, they are captured with the help of electrodes placed on the scalp (sometimes in form of a cap) at specific locations. Electrodes are cup-shaped with EEG gel that acts as an interface material between the electrode and the skin as there is no direct contact between skin and the electrode material. The electrodes provide enough volume to contain an electrolyte and capture the electrical signal.3
So the resultant signal developed at the terminals is collected by the electrode and passed on to the electronic circuitry. The standard method used by EEG machines to describe the location of scalp electrodes is “10-20” system. This is an International Standard of placing and positioning of the electrodes on the human scalp for measuring brain activity.4 The “10” and “20” refer to the distances between adjacent electrode that are either 10% or 20% of the total front-back or right-left distance of the skull. Each electrode placed at the scalp is identified by a letter F, T, P and O for frontal, temporal, parietal, and occipital respectively and a specific number is allotted to identify the hemisphere location. The odd numbers 1,3,5,7 represent left hemisphere and even numbers 2,4,6,8 represent right hemisphere as depicted in Figure 1.
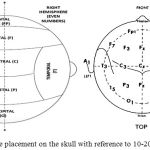 |
Figure 1: Electrode placement on the skull with reference to 10-20 International system.
|
Epilepsy is characterized by abnormal electrical activity in the brain and is considered as recurring neurological brain disorder.5 Epileptic seizure is result of excessive and hyper synchronous firing of large number of neurons in the brain. Sudden and excessive neural activity leads to epileptic seizures that are sudden, brief and recurrent. During seizure, occurrence of strange sensations, change in emotions convulsions and loss of consciousness are noticed.6
EEG is one of the main diagnostic tests for epilepsy and an effective clinical tool for monitoring, diagnosing and prognosis of neurological disorders. The onset of a clinical seizure is characterized by sudden changes in the morphology of EEG, but some abnormality in EEG patterns may occur due to different conditions. It is not easy to detect the changes in brain rhythms because of small amplitudes, minute variations and waveforms from the scalp EEG. Moreover, the conventional methods of detection or prediction include visual scanning of EEG signals that is very tedious, time consuming and may be inaccurate. Hence, it is indispensible to obtain correct diagnosis for the treatment of epilepsy after analysing the EEG signals using consistent processing method.7 Thus a model is proposed to make the detection and prediction using EEG signals that also involves comparison by the use of Support Vector Machine (SVM), Radial Basis Function (RBF) and Neural Network.
In the literature, various methods have been employed to classify these signals using various machine learning algorithms such as neural networks, fuzzy inference system, wavelets, statistical methods and many other.8-11 Authors in12 used the empirical model decomposition (EMD) to develop a methodology and used SVM for detection of epileptic seizure whereas, authors in13 used a cascade of wavelet-approximate entropy to develop a model for feature extraction in the epileptic EEG signal classification. Authors in14 designed a method based on the EMD for the classification of ictal and seizure-free EEG signals. Authors in15 have done a quantitative research using power spectral density method to compare classifier in order to determinate which of them has highest rates of classification.
The objective of present work is to develop a computer aided classification system that can automatically diagnose the epilepsy using EEG signals. To come up with the optimal diagnostic system various classifiers are used and their performances are analysed in terms of performance metrics.
The contribution of the present research work is to find out the best classification system using the derived features characterizing the EEG signals. The use of restricted number of features and 10-fold cross-validation make proposed classification system easy to implement and reliable. Authors have worked on various classifiers in16 and in the present paper, the work is extended by exploring the ability of various classifiers for designing optimal CAD (computer aided classification) systems to model and classify EEG signals. The apparent potential of Neural networks, Support Vector machine, K-Nearest neighbour, Radial Basis function is exploited to propose a generative classifier. Our proposed CAD diagnosis system is completely automated that will help the clinicians in their daily screening of epileptic patients.
Methodology
Advancement in signal processing and machine learning techniques is making it possible to aid a neurologist by automatically analyse EEG data to detect epileptic patterns.
Analysed Data
In the present work, data used for the research work is made available by University of Bonn, Germany and is in public domain.17 The data used has recordings of 100 single-channel EEG signals of 23.6 s duration. Signals were recorded with 128-channel amplifier system, digitized using 12 bit resolution and sampled at a sampling rate of 173.61Hz. The data set comprises the signals of set Z (as normal condition), set F (as inter-ictal condition) and signals in set S(exhibiting seizure activity) are chosen for this work. Exemplary EEGs of each class are depicted in Fig.2. Several pre-processing steps are to be carried out in order to reduce noise and artifacts and a notch filter is required to eliminate interference induced by external power mains and equipment. The values of the attributes are standardized by normalizing by max-min approach.
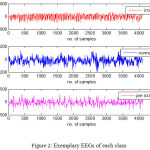 |
Figure 2: Exemplary EEGs of each class
|
Methods
The purpose of this research work is to identify the features of the EEG signals pertaining to epileptic disorder and to construct a computer aided diagnostic system that uses EEG features to accurately classify seizure activity. To analyze and classify the EEG signals with enhanced accuracy and precision various computational techniques are employed which posses the quality of generalization and good predictive power.18 Main objective of this research work is to come up with the best possible classifier exhibiting these properties, so different classifiers that are already used in literature are compared with respect to their performances. All the statistical features are collected and a feature vector is constituted that is used by the entire above mentioned machine learning algorithms. A detail description of the proposed algorithms is discussed in the following section.
Feature Extraction and Selection
To extract a suitable feature set from e epileptic EEG signals is a challenging task as these features are of prime importance for classification. Any successful diagnostic system based on classification requires a feature set which is unrelated, informative and best representation of the signals. This work has considered statistical features, mean, standard deviation, maximum, energy, entropy, skewness and kurtosis. These features are calculated from each set of every class to achieve representative characteristics of the original signals.19 One of the features for all the three classes is depicted in Fig 3. The features from all the 100 signals of one class are framed together, and similar technique is applied for all the three hundred case. Thus a final feature set is constituted after using features ranking methods and are arranged according to their clinical significance. The ANOVA demonstrated the use of different features by obtaining the p-value less than 0.005.This feature set is used as input to the classifier using machine learning algorithm, and training and testing sets are generated. 10-fold cross-validation technique is employed to reduce any bias of training and test data.20 These methods reduce the complexity of the system without affecting the classification performance.
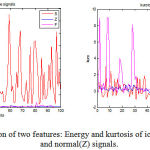 |
Figure 3: Depiction of two features: Energy and kurtosis of ictal(S), inter-ictal(F) and normal(Z) signals.
|
Classification
Various classifiers used for diagnostic system are briefed in this section. The feature vector framed out of all the features of different type of signals is given as input to the classifiers. Based on various performance indices, the performance of classifiers are evaluated for this particular problem. As the main objective of this work is to find out the classifier that best suits this research problem, different classifiers are evaluated after being trained and tested exclusively for each type of signal.
Artificial Neural Network (ANN) Classifier
ANNs are non linear classifiers that are arranged in three layers viz., input, hidden and output layer. These networks simulate the biological neuron and are capable of performing computational tasks.21 The number of neurons in the input layer denotes the number of features selected and, number of outputs denotes the number of classes to be classified. The large the number of neurons in hidden layer, more is the complexity. Artificial network adapts itself by sequential training algorithm and its architecture.
Support Vector Machine (SVM) Classifier
SVM is a machine learning algorithm and is most popular algorithm used for classification that uses a hyper plane to separate the data by optimizing the margin between two classes. SVM tries to represent the feature points in space which are mapped in a way that different categories can be divided by a boundary by a clear gap that is as wide as possible. For non linear problems, SVM have ability to learn with different kernel function for classification by changing the different kernel function, as linear, polynomial, radial basis function.22 The hyper plane maximizes the margin that is the distance between the hyper plane and the nearest points from each class that are called as support vectors.
Radial Basis Function (RBF) Classifier
The design of a neural network can also be perceived as a curve-fitting (approximation) problem in a high-dimensional space. The multidimensional surface is found to represents a best fit to the training data that is further used to interpolate the test data. This network consists of three layers: nonlinear input layer to connect the network to the environment, hidden layer of high dimensionality and the linear output layer that produces the response. Dimension of the hidden space in an RBF network is made high by applying nonlinear transformation prior to a linear transformation23
Performance Evaluation
For evaluating the performance of a classifier and validate the performance of the proposed method an appropriate criterion is an important concern to make correct predictions. In this paper, the performance of the proposed method is assessed by calculating classification accuracy, confusion matrix, evaluating performance of the classifier in terms of training, testing and validating performances and by plotting receiver operating characteristic (ROC) curve. The exhaustive description of these performance evaluation measures are available in references24
Results and Discussion
In this Section, the proposed methodology is applied on the available database as discussed Section 2. The technique is employed to classify two-class EEG signals from datasets for two cases Case I : Set F vs Set S and Case II: Set S vs Set Z. We experimented with five classifications, namely Artificial Neural Network, Radial Basis Function, and Support Vector Machine (SVM) with different kernels functions. The features are ranked using SPSS software and technique is implemented using MATLAB.
The classification system consist of three layers of artificial NN with tan-hyperbolic and softmax function as the activation function for hidden and output layers respectively with Cross Entropy as error function and BFGS (Broyden-Fletcher-Goldfarb-Shanno) as the technique used for training neural network.25 To avoid over fitting during training of the network , 70% of the data set is employed for training, 15% of the data set for testing and 15% for validation. Such random sampling has been performed 10 times and best 3 independent models have been created for case I and case II as depicted in Table 1a) and 1 b). It is observed in this table that the MLPNN model with 9 nodes in the hidden layer is the better choice for case I giving 99.66% validation performance and for case II to differentiate between class S and class Z , hidden layer with seven nodes gives 100% accuracy. Table 2 depicts the confusion matrix for the best MLPNN model chosen for both cases from which can calculate sensitivity specificity, false rate and classification accuracy.
Table 1a: Summary of active networks (S-F)
| Index | Net. name | Training performance | Test
performance |
Validation performance | Hidden activation | Output activation |
| 1 | MLP 13-5-2 | 96.428 | 100.000 | 96.666 | Identity | Softmax |
| 2 | MLP 13-7-2 | 97.857 | 100.000 | 96.666 | Identity | Softmax |
| 3 | MLP 13-9-2 | 100.000 | 100.000 | 99.666 | Identity | Softmax |
Table 1b: Summary of active networks (S-Z)
| Index | Net. name | Training perf. | Test perf. | Validation perf. | Hidden activation | Output activation |
| 1 | MLP 13-16-2 | 99.000 | 100.000 | 99.000 | Logistic | Softmax |
| 2 | MLP 13-7-2 | 100.000 | 100.000 | 100.000 | Identity | Softmax |
| 3 | MLP 13-5-2 | 98.000 | 99.000 | 99.000 | Exponential | Softmax |
Table 2: Confusion matrix for both the cases
| Predicted category | ||
| Category F | Category S | |
| MLP 13-9-2-F | 96 | 1 |
| MLP 13-9-2-S | 0 | 98 |
| Category S | Category Z | |
| MLP 13-7-2-S | 100 | 0 |
| MLP 13-7-2-Z | 0 | 100 |
For this research work, the other classifier used was Support Vector Machine (SVM). The performance of SVM is based on various kernel functions employed. We have chosen three kernel functions to make our research work more generalized linear, polynomial and radial basis.26 Number of SVs are calculated with particular value of gamma and henceforth classification summary is tabulated in Table 3 a) and b) for radial basis function kernel and Table 4 a) and b) for polynomial function respectively.
Table 3a: Overall performance for SVM classifier with radial basis kernel function for Case I
| Class
Name |
Classification summary (S-F)
Kernel: Radial Basis Function (gamma=0.077) |
||||
| Total | Correct | Incorrect | Correct(%) | Incorrect(%) | |
| F | 100 | 100 | 0 | 100.00 | 0.0000 |
| S | 100 | 97 | 4 | 97.00 | 3.0000 |
Table 3b : Overall performance for SVM classifier with radial basis kernel function for Case II
|
Class Name |
Classification summary (Z_S)
Kernel: Radial Basis Function (gamma=0.077) |
||||
| Total | Correct | Incorrect | Correct(%) | Incorrect(%) | |
| S | 100 | 100 | 0 | 100.0000 | 0.00 |
| Z | 100 | 100 | 0 | 100.0000 | 0.00 |
Table 4a : Overall performance for SVM classifier with polynomial kernel function for Case I
|
Class Name |
Classification summary (S-F)
Kernel: Polynomial (degree=3.000, gamma=0.077) |
||||
| Total | Correct | Incorrect | Correct(%) | Incorrect(%) | |
| F | 100 | 100 | 0 | 100.000 | 0.000 |
| S | 100 | 96 | 1 | 96.000 | 4.000 |
Table 4b : Overall performance for SVM classifier with polynomial kernel function for Case II
|
Class Name |
Classification summary (Z_S)
Kernel: Polynomial (degree=3.000, gamma=0.077) |
||||
| Total | Correct | Incorrect | Correct(%) | Incorrect(%) | |
| S | 100 | 100 | 0 | 100.00 | 0.000 |
| Z | 100 | 91 | 9 | 91.00 | 9.000 |
It is observed from the above tables 3 and table 4 that SVM with radial basis function gives the 100% accuracy for classification between ictal and normal candidate whereas 97% accuracy is achieved for classifying ictal and inter-ictal cases. It is also observed that higher rate of classification accuracy is achieved for ictal and normal cases a as compared to the classification of case II i.e ictal and inter ictal cases.
The third category of classifiers used for this research work is radial basis function as it was inferred from the previous experimentation that SVM gave the best results with RBF kernel. Again, various models were experimented with the dataset and the best three models depicting good classification results are reported. Table 5 a) shows the performance of the models in terms of training, testing and validating for classification. Table 5 b) and 5 c) gives the confusion matrix for both the cases. After reviewing the results, it is observed that classification accuracy is better for differentiating ictal and normal condition as compared to ictal and inter ictal state, following the same trend as for other classifiers.
Table 5a: Summary of active networks with RBF networks
| Index | Net. name | Training perf. | Test perf. | Validation perf. | Hidden activation | Output activation |
| 1 | RBF 13-5-2 | 92.14286 | 96.6667 | 86.66667 | Gaussian | Identity |
| 2 | RBF 13-5-2 | 93.57143 | 100.0000 | 93.33333 | Gaussian | Identity |
| 5 | RBF 13-30-2 | 92.85714 | 100.0000 | 86.66667 | Gaussian | Softmax |
Table 5b: Confusion matrix for Case I
|
Predicted category |
Inter ictal (f) | Ictal (s) |
| Inter ictal (f) | 91 | 2 |
| Ictal (s) | 9 | 98 |
Table 5c: Confusion matrix for Case II
| Predicted category | Normal (z) | Ictal (s) |
| Normal (z) | 95 | 4 |
| Ictal (s) | 5 | 96 |
Finally, to substantiate the classification results ROC curves were plotted for all the models and it was seen that maximum area under curve was found to be of ANN that substantiate our experimentation for this research problem. Fig 4 represents the ROC curve for this work.
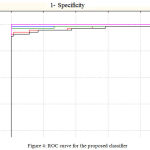 |
Figure 4: ROC curve for the proposed classifier
|
Conclusion
The proposed methodology is a step towards modelling the epilepsy prediction as a classification task for two different classes: ictal and normal state and ictal and inter ictal state.. To come up with better model showing highest classification accuracy and good sensitivity and specificity five different classification algorithms were used to classify normal and abnormal patients. Analysing the results comparatively it can be inferred that out of all the tested models MLPNN gave the best results in terms of CA, confusion matrix and misclassification rate followed by SVM with RBF kernel. Lower classification for the same architecture is given by SVM with linear kernel and polynomial kernel. MLPNN does not require feature space dimensionality reduction and is less prone to over fitting and obtain good generalization performance. The results obtained from this research work shows that the MLPNN model has potential in designing EEG based diagnostic system.
References
- Rajapakse C.,Cichocki A and Sanchez V. D. Independent component analysis and beyond in brain imaging: EEG, MEG, fMRI, and PET”, In Proc. of IEEE Conf. on Neural Information Processing, 2002;1:404-412.
CrossRef - Srinivasan., Eswaran C and Sriraam N. Artificial neural network based epileptic detection using time-domain and frequency-domain features. J. Med. Syst. 2005;29(6):647–660.
CrossRef - Ulbert I., Halgren E., Heit G., Karmos G. Multiple Microelectrode-recording System for Human Intracortical Applications. Journal of Neuroscience Methods. 2001;106(1):69-79.
CrossRef - Teplan. Fundamentals of EEG Measurement. Measurement Science Review. 2002;2:1-11.
- Atlas: Epilepsy Care in the World. World Health Organization. 2005.
- Gotman. Automatic recognition of epileptic seizures in the EEG.Electroen Clin Neuro. 1982;54:530–540.
- Rivero 0. G., Dorado J.,Rabu-nal l. R and Pazos A. Automaticepileptic seizure detection in EEGs based on line length feature and artificial neural networks. J NEUROSCI METH. 2010;91(l):101-109.
- Rabbi A. F., Azinfar L., Fazel-Rezai R. Seizure prediction using adaptive neuro-fuzzy inference system. Conference proceedings : Annual International Conference of the IEEE Engineering in Medicine and Biology Society IEEE Engineering in Medicine and Biology Society Conference. 2013;2013:2100-3.
CrossRef - Subasi A. Application of adaptive neuro-fuzzy inference system for epileptic seizure detection using wavelet feature extraction. Computers in Biology and Medicine. 2007;37(2):227-244.
- Adeli., Zhou Z.,Dadmehr N. Analysis of EEG records in an epileptic patient using wavelet transform. J. Neurosci. Meth. 2003;123(1):69–87.
- Ocak. Automatic detection of epileptic seizures in EEG using discrete wavelet transform and approximate entropy. Exp, Syst. Appl. 2009;36(2):2027-2036.
CrossRef - Li S., Zhou W., Yuan Q., Geng S and Cai D. Feature extraction and recognition of ictal EEG using EMD and SVM’. Computers in Biology and Medicine. 2013;43(7):807-816.
CrossRef - Shen C. P., Chen etal. High-performance seizure detection system using a wavelet-approximate entropy-fSVM cascade with clinical validation. Clinical EEG and Neuroscience. 2013;44(4):247–256.
CrossRef - Pachori R. B and Patidar S. Epileptic seizure classification in EEG signals using second-order difference plot of intrinsic mode functions. Computer Methods and Programs in Biomedicine. 2014;113(2):494-502.
CrossRef - Wang R., Wang J., Yu H., Wei X., Yang C., Deng B. Power spectral density and coherence analysis of Alzheimer’s EEG. PubMed. 2015;9(3):291-304.
CrossRef - Sood M., Bhooshan V. S. Design and Development of Prediction Model to Detect Seizure Activity Utilizing Higher Order Statistical Features of EEG signals. Research Journal of Pharmaceutical, Biological and Chemical Sciences. 2014;5(3):1129-1145.
- Andrzejak., Lehnertz K., Mormann F., Rieke C., David P and Elger C. Indications of nonlinear deterministic and finite dimensional structures in time series of brain electrical activity: Dependence on recording region and brain state. Rev. E., 2001;4(6).
- Liang F., Wang H. C and Chang W. L. Combination of EEG complexity and spectral analysis for epilepsy diagnosis and seizure detection.EURASIP J. Adv. Signal Process. 2010;20:853434-1–853434-15.
- Yadollahpour A and Jalilifar M. Biomedical & Pharmacology Journal Seizure Prediction Methods: A Review of the Current Predicting Techniques. 2014;7(1):153-162.
- Sood M., Bhooshan V. S. Parameter-selective based CAD system for epileptic seizure classification. International Journal of Applied Engineering Research. 2015;10(10):25389-25407 .
- Trejo L. J., Kubitz K., Rosipal R., Kochavi R. L & Montgomery L. D. EEG-Based Estimation and Classification of Mental Fatigue. Psychology. 2015;16:572-589.
CrossRef - Lay-Ekuakille et al., “Entropy index in quantitative EEG measurement for diagnosis accuracy,” IEEE Trans. Instrum. Meas. 2014;63:1440-1450.
CrossRef - Aslan K., Bozdemir H et al., Cenk Şahin, Seyfettin Noyan Oğulata and Rızvan Erol, A Radial Basis Function Neural Network Model for Classification of Epilepsy Using EEG Signals. J Med Syst. 2008;32:403–408.
CrossRef - Das., Bhuiyan M. I. H., Alam S. M. S. Classification of EEG signals using normal inverse Gaussian parameters in the dual-tree complex wavelet transform domain for seizure detection. Signal, Image and Video Processing. 2016;10(2):259-266.
CrossRef - Yadollahpour A & Nasrollahi H. Quantitative Electroencephalography for Objective and Differential Diagnosis of Depression: A Comprehensive Review Global. Journal of Health Science. 2016;8(11):249-256.
CrossRef

