
K. Manju1, R.S.Sabeenian1 and A.Surendar2
1Department of Electronics and Communication Engineering Sona college of technology Salem, Tamil Nadu.
2Department of Electronics and Communication Engineering, Vignan’s University, Guntur.
Corresponding Author E-mail: Manju.kandaswamy@gmail.com
DOI : https://dx.doi.org/10.13005/bpj/1118
Abstract
Human eye is considered to be the most beautiful creation of god which is affected by 3 deadliest diseases. These diseases cause irreversible vision loss. They are listed as Cataract, Diabetic retinopathy and Glaucoma. Cataract is age related eye disease. Diabetic retinopathy is caused due to increase of sugar in blood level. DR is found only in people who have sugar. Glaucoma is caused by increase in the intraocular pressure. This pressure is to maintained in the range 12-22mmHg. This pressure is increased if the fluid inside the eye gets clotted inside the eye. This clot causes an acute or wide angle between the iris and cornea. This determine the type of glaucoma. There are three methods used to identify glaucoma by ophthalmologist. They are cup to disc ratio, ISTN value and intraocular pressure. In this paper we analyze different techniques used to calculate CDR value and ISTH value. We have found that adaptive threshold segmenting after histogram and smoothing operation provide us better results. They are fast in calculation and would help in early detection of glaucoma by the ophthalmologist.
Keywords
CDR; ISTN value; Glaucoma; Intraocular pressure
Download this article as:| Copy the following to cite this article: Manju K, Sabeenian R. S, Surendar A. A review on Optic Disc and Cup Segmentation. Biomed Pharmacol J 2017;10(1). |
| Copy the following to cite this URL: Manju K, Sabeenian R. S, Surendar A. A review on Optic Disc and Cup Segmentation. Biomed Pharmacol J 2017;10(1). Available from: http://biomedpharmajournal.org/?p=13691 |
Introduction
Human eye being the most important sensory organ allowing us to view an object or a place. This is made possible by the rods and cones present inside the eye. The eye is not a perfect sphere. It is made of two pieces. The small frontal unit is transparent and more curved. It is called the cornea which is 8mm in radius and is linked to the larger while part called the sclera. The second is the sclerotic chamber (12mm thickness). The ring connecting the cornea and sclera is limbus. The center of the eye is the iris which is the colored circular structure. Pupil which is black in color controls the amount of light entering the eye. This is obtained by the iris’s dilator and sphincter muscles.
Light which enter the eye through cornea then the pupil and then passes through the lens. The lens focuses the light on the light sensitive cells of the retina. This light wave is then converted to electrical signal and is carried to the brain by the optic nerves. The size of an adult human eye is 24.2mm diameter, a volume of six cubic cm and 7.5gms in mass.
The eye is made of 3 coats. Fibrous tunic being the outermost layer composes of cornea and sclera. Vascular tunic layer also known as uvea has choroid, ciliary body and iris. The innermost is the retina. The aqueous humor is a fluid that is in anterior chamber that is between iris and the lens. The lens is suspended by fine transparent fibers. The ealirance of the pupil is about 4mm in diameter. In a brigal place, it is 2mm to 8mm in a dark place. We can determine the objects depth and distance because of vison through both the eyes. Six muscles totally control the movement of the eye.
The retina has several layers of neurons. These neurons layers are interconnected by synapses. Among the two photoreceptor cells rods function in dim light and cones functions in day light rods gives us black and white vision and the cones help us to see the color in them. The rarer photoreceptor is the ganglion cell. They take care about the reflexive response. In daylight of the retina has 10 distinct layers.
Inner limiting membrane – It is the basement membrane.
Nerve fibre layer – They are axons of the ganglion cell.
Ganglion cell layer – They contain the nuclei of the ganglion cell.
Inner plexiform layer.
Inner nuclear layer – They contains the nuclei of the amacrine cell, bipolar cell and horizontal cell.
Outer plexiform layer – In this layer the protection of the rods and cones ends in the rod spheant and cones pedicle.
Outer nuclear layer – Consists of the cell bodies of rod and cone.
External limiting membrane – This layer separates the inner resonant portions.
Layer of rods and cones – Thus layer consists of rod and cone cells.
Retinal Pigment Epithelium (RPE) – The closet layer to choroids. This layer is single layer of caboidal cells.
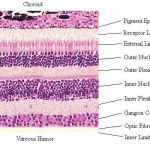 |
Figure 1
|
The retina consists of 75 to 150milion rods and 7 million cones. The retina is about 22mm in diameter. The optic disc is a part of the retina called as blind spot because it lacks the photoreceptors. Macula is temporal to the disc. It center is called fovea. It is a pit responsible for our sharp vision. This area lacks rods. The retina is 0.5mm thick.
The most common diseases that affect the eye and is fatal are diabetic retinopathy and glaucoma. Diabetic retinopathy is mainly due to sugar level in the blood. The most dangerous is glaucoma because it cannot be identified until it has affected the vision. This vision loss due to glaucoma is irreversible. The common types of glaucoma are open angle, closed angle and normal tension glaucoma. Open angle glaucoma is developed over time. It first affects the side vision and later the central vision leading to blindness. It is not accomplished by pain. Closed angle glaucoma normally involves sever eye pain, blurred vision redness of eye. The causes for glaucoma are increased pressure in eye, family history, migraines, high blood pressure and obesity. Normal tension glaucoma occurs due to optic nerve damage with normal pressure. The pressure value should not go about 21mmHg or 2.8kpa. This pressure is known as intraocular pressure. This pressure is due to the production of liquid aqueous humor by ciliary processes. It normally drains through the trabecular meshwork. This liquid flows to the posterior chamber bounded by the lens rim, anteriorly by the iris. This liquid than flows to the pupil into anterior chamber. The meshwork helps drains humor is a schlemme’s canal into sclera plexuses and general blood circulation.
In open angle glaucoma the mesh reduces the flow, which usually absorbs the aqueous humor and thereby increasing resistance. This process is totally painless. Increases the pressure in eye. In closed angle final roll moves forward and completely closes the iridoconeal angle. The liquid does not flow from posterior to anterior. It gets accumulated and increases the blood pressure. With measured pain neo vascular glaucoma is caused by proliferative diabetic retinopathy or central retinal vain occlusion (CRVO). This is mainly due to the development of abnormal vessels and blocks the drainage. Toxic glaucoma is unexpected increase of intraocular pressure. It can sometimes be 80mmHg. The absolute glaucoma is the end stage, where there is no vision. Glaucoma is also called in babies and is called congenital glaucoma. This is mostly inherited. The other types of glaucoma are secondary, pigmentary pseudo exfoliative, traumatic urido corneal endothelial syndrome and uveitre gluaucoma.
Glaucoma is the disease that affects human eye sight. The first is cataract. This affects about 11 to 67 million people globally. It is known as the “Silent thief of sight”. Glaucoma is from ancient Greek word glaukos meaning blue, green or gray.
To identify glaucoma, the measurement of intraocular pressure is very important, anterior chamber angle examination and the optic nerve examination too. Mostly the change in cup to disc ratio, rim appearance and vascular changes are also noted. Depending on the degree of blockage the patients are given medication or undergo surgery. The corrective surgery clears blockage and help the aqueous liquid to flow and reduce the eye pressure. Tonometry and ophthalmoscopy are mostly used to identity glaucoma. Tonometry is used to measure the pressure inside the eye (12-22mmHg) (millimeter of mercury) opthalmoscopy is used by the doctors to examine the optic nerve of the glaucoma patients. They further take two more tests perimetry and gonioscopy. Perimetry gives the map of complete vision. This test helps to identity if the vision is affected by glaucoma. Gonioscopy tells about the angle when iris meets the cornea. The angle is measures to see if it is wide or narrow. One more test called pachymetry is made to calculate the thickness of cornea. This thickness has an influence on the pressure of the eye. The cup disc ratio guides us to identify the progress of glaucoma. Optic disc is the place where the optic nerve and blood vessels enter the retina. It is also called the location of blind spot. The optic disc is mostly flat or can have a certain amount of cupping. Due to the increase in the intraocular pressure this cup size enlarges and takes max of the disc area. The cup disc ratio is the diameter of the cup portion of the optic disc with the total diameter of the optic disc. The normal value of CDR is 0.7. A larger value may be due to glaucoma. Calculated ISTN value also helps to validate whether the patient has got glaucoma. ISTN stands for Inferior, Superior, Temporal and Nasal distance that the cup makes with the disc The condition to be satisfied is that the inferior distance or area should be greater than the superior region. The temporal should be more than the nasal area.
Literature Review
The author, Ayushi Agarwal et al has calculated two value to identify glaucoma. They have found cup to disk ratio and rim to disk ratio. They have used the fundus image. The first step is obtaining the region of interest. The region of interest is the optic disc. The center of the optic disc is found by calculating the maximum value. The red channel of the extracted ROI is taken for the segmentation of the optic disc as the suppression of the blood vessels are easy in this plane. Otsu thresholding method is used for segmentation. While the segmentation of the optic cup is done with the green channel. The mean and standard deviation values are calculated. After analyzing the histogram of the green plane the threshold value is set. Then the cup is segmented. The NRR is obtained by subtracting the segmented disk and cup. The NRR is split into four quadrants. These quadrants are named as Inferior, Superior, Nasal and Temporal. The inferior and temporal region are taken to calculate the total disk area. The rim to disk ratio is obtained by dividing the inferior and temporal area by the disk area. Here 0.4 is taken as the threshold value after being tried on 50 images. The images used are from Venu eye research center, New Delhi. The accuracy obtained is 90% in this algorithm.
The author, Shradha Gulia et al also uses the green plane of the fundus image. They find that in the red plane it is very difficult to separate the cup and disc. In the blue plane the contrast is not good. So they have decided to take the green plane. They calculate the mean, SD and variance. The histogram is also obtained for the green plane image. Now the threshold for the segmentation of cup and disc is calculated by the following formula
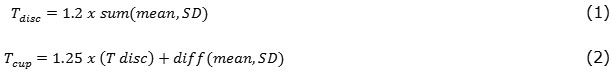
The threshold of cup segmentation is more compared to the disc because the cup is the brightest region. The CDR value is calculated by computing the disc and cup area. The ratio of the area is called CDR. This is the threshold value used to identify whether the patient is glaucomatous from the fundus image. This value is set as 0.3 by the author. The author has used 110 fundus images from Venu eye research center, New Delhi and obtained a accuracy of 90%.
The author, Santhakumar R et al uses the red channel of the RGB fundus image. After smoothing is done by Gaussian filter the vertical and horizontal bin are separated. The average intensity value of the bin is calculated and replaced. The maximum value of the horizontal and vertical bin is calculated to decide the threshold. With this threshold value the image is binarized to localize the optical disc. After the splitting and multiplying, the standard deviation of the path is calculated. The maximum of standard deviation helps in finding the local location and the contour of the disc. The author has used 3 databases Messidor, Diaret DB, Optomed and obtained a result of 98% 97% and 90% accuracy respectively.
The author, Malay Kishore Dutta et al concentrate on the optic cup enlargement and CDR value to identify glaucoma. The fundus image is prepossessed. In the prepossessing step the histogram of the image is obtained. From the histogram a threshold value is computed to separate the foreground pixels from background pixels. In this paper the author AND’s the blue plane and green plane to help in segmentation of the cup if the red plane does not produce a better identification of the cup disc region. For optic disc and cup segmentation the image is converted into a gray scale image. The histogram is obtained and represented as a bar graph. This is divided into two halves. Number of pixels in both the regions are found and then their difference is obtained. This is the number of pixels that are needed for segmentation. This value is used to set the threshold for optic disc segmentation. 10% of this is used to segment optic disc and 1/40th part is used for segmenting optic cup. Circular Hough transform is used to find the center and radius of the segmented cup and disc. CDR threshold used to identify glaucoma is set as 0.75. They have obtained an accuracy of 90%. Fundus images are obtained from Venu eye research center, New Delhi. They have obtained the ground truth from an ophthalmologist.
The author, Ashish Issac et al has used the red plane of the image for optic disc segmentation and green plane for optic cup segmentation. In the prepossessing step the mean and standard deviation is calculated. This value is subtracted from the channel to remove the high grey values. The remaining pixels represent the optic disc and cup in their respective channels.To obtain the threshold value histogram smoothing is done on the planes. Smoothing operation is done by Gaussian window of size m x 1. After the smoothing the threshold value is calculated from the mean, standard deviation of the plane and the Gaussian filter.
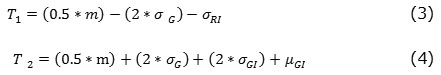
Where, m is the size of Gaussian window, σG is the SD of Gaussian filter, σGI SD of the green plane σRI SD of the red plane, µGI mean of the green plane. T1 is the disc threshold and T2 is the cup threshold value. Morphological operations are performed over the segmented image. They have used 63 images and obtained an accuracy of 92.06%.
The author, Boris Lesay et al has compared three methods of optic disc localization with certain amount of modifications. The first method is Fast radial symmetry transform for which the false contour is removed by setting a parameter value Gama. This value is obtained by taking the gradient. The second method is the Hough Transformer, in this method the author has altered the radius “a” and “b” values. The last method is a histogram method based on templates, in which the author has made changes by calculating the weighted value of the templates. The Database used is MESSIDOR. The results obtained 92.3 8%in FSTT, 89.4 7% in HIST and 71.2 4% in HOUGH accuracy in detecting the optic disc
The author, Sara Omid et al has used region growing based segmentation to segment the optic disc. To obtain the seed of region growing algorithm the histogram of the fundus image is obtained. With the help of the histogram the threshold value is obtained, to binarize the image. Thresholding method is used because the optic disc is the bright region of the fundus image after binarization process morphological open and close are used to remove the unwanted data near the region of interest. The smoothing of the image is then performed to smooth the nerve bending near the optic disc region. The author uses average 5×5 filter for the smoothing operation. Region growing is done keeping in mind two conditions, first is that the difference between the pixel and the seed should be less than X. whose value is determined by the histogram. second is that it should have 8-point Connectivity to at least 1 pixel in the optic disc region. This algorithm has been used in 150 fundus image taken from Sahid Labbaji Nedjad imaging center and obtained a specificity and sensitivity of 98.1 % 97.2 % respectively. The ground truth is obtained from ophthalmologist.
The author, Amira Soltani et al has tried to segment the fundus image using the edge detection technique. They have used CV open source and worked in VB.net. They have compared three types of Edge detection techniques Laplacian, Sobel and Canny edge detector. Among the three it is being found in the analysis that Canny edge detection technique produces a perfect contour with good localization. Canny edge detection technique uses 2 threshold values. The maximum threshold value is set at 150 and minimum threshold to be set at 60. This has provided them a better detection technique on complexity of calculation. The Sobel and Laplacian method provides a good detection but have to be preprocessed for the noise removal. Laplacian technique provides good contour detection but they are blur and not clear. The author has concluded saying Canny edge detection is effective in the edge detection technique.
The author, M. Nahid Reza et al has used curve operator method to identify the optic disc. The operator has been used on images of 3 standard database after separating the lighter image for the LAB color space. First step in the proposed method is to convert the fundus image from color image space to LAB color space. Then use a circular brightness property of to identify the optic disc. The brightness of the optic disc does not take a normal distribution along the disc, it is gradient (ie) the brightness increases as we move towards the center. Then the operator is used to identify the optic disc by plotting the upward and downward variations. The author has found out that the optic disc can be identified using this method for a particular database. The success rate of this algorithm is 8.7 65% for STARE, 95.38 % for DIARETDB0 and 94. 38 % for DIARETDB1.
The author, Suman Sedai et al uses the fact that the optic disc is the brightest region in the fundus image with the nerve leaving out the disc. The author uses and non-overlapping sliding window approach on the red channel. Otsu’s thresholding method is used to segment the vessels. These are used to localize the optic disc. Further the author uses Canny edge detection to obtain a binary image, over which Circular Hough transform is kept 0.997 radius and range of 250 to 500 pixels is used. Cascade regression is used to segment the optic disc and cup. They have used images from DRISHTI study. The proposed method in this paper has provided F-score of 0. 95 compared with the other methods.
The author, Namita Sengar et al first splits the fundus image into 4 regions. Where among the four A B C D the C and D region has always the probability of having the optic disc. This helps the author to reduce unnecessary calculations and data processing. After this the average mean value of the regions are calculated to further localized the optic disc. The region with maximum mean value will have the optic disc. Then using morphological operation on the binarized image the author segments the optic disc. Standard database are used by the author is MESSIDOR and DRIVE and an accuracy of 90% and 95% respectively.
Conclusion
Glaucoma is an eye disease that is a second major cause of vision loss. Glaucoma can affect anyone. Even children can be affected from glaucoma. Glaucoma can be identified only after 50% vision is lost. It makes itself evident only after it damages 25% of the eye tissues. This eye disease is known as the silent thief of vision. The three major methods used by an ophthalmologist to identified glaucoma is by checking the intraocular pressure, CDR value and ISTN value. Ophthalmologist suggests that a normal CDR with increased IOP can be suspect of glaucoma. Similarly, a high CDR and low IOP can also be a suspect. A glaucoma patient is supposed to have a high CDR, high IOP and low Inferior region or area. In the papers we have reviewed about the CDR value and ISTN value calculated to help the ophthalmologist to identify glaucoma. The CDR threshold value is set at 0.3 if it is the cup area by disc are and 0.6 if it’s the cup diameter by disc diameter, the ISTN comparison is made to check if the Inferior region is the maximum region of the rest three. The standard database used in these papers are DRISHTI, MESSIDOR, DRIVE, STARE, DIARETDB0, DIARETDB1. It is being found that CDR calculation is better if adaptive thresholding methods with morphological operations are used. Thresholding after histogram equalization and smoothing also provides an evident result. In all the algorithm the authors have used red plane for segmenting Optic disc and green plane for segmenting optic cup. All the algorithms have produced a result above 90%.
References
- Amira Soltani, Tahar Battikh, Imed Jabri, Yosra Mlouhi, Med Najeh Lakhoua ” Study of contour detection methods as applied on optic nerve’s images for glaucoma diagnosis” CoDIT’16 – April 6-8, 2016, Malta.
- Suman Sedai, Pallab K. Roy, Dwarikanath Mahapatra, Rahil Garnavi “Segmentation of Optic Disc and Optic Cup in Retinal Fundus Images using Shape Regression” IEEE ,2016 pp no 3260-3264.
- Ayushi Agarwal,Sharadha Gulia,Somal Chaudhary,Carlos M.Travieso,Jesus B.Alonso-Hernandez,” A novel approach to detect glaucoma in retinal fundus image using cup disk and rim-disk ratio ” international work conference on bio inspired intelligence,IEEE,2015,pp139-143.
- Boris Lesay,Jarmila Pavloviová, Miloš Oravec, Veronika Kurilová “Optic Disc Localization in Fundus Images” IEEE, 2016.
- Ayushi Agarwal, Shradha Gulia, Somal Chaudhary, Malay Kishore Dutta, Radim Burget, and Kamil Riha “Automatic Glaucoma Detection using Adaptive Threshold based Technique in Fundus Image” IEEE, 2015 pp no 416-420.
- Ashish Issac, M. Parthasarthi, Malay Kishore Dutta “An Adaptive Threshold Based Algorithm for Optic Disc and Cup Segmentation in Fundus Images” 2015 2nd International Conference on Signal Processing and Integrated Networks (SPIN) IEEE, 2015 pp no 143-147.
- Nahid Reza, Mohiuddin Ahmad “Automatic Detection of Optic Disc in Fundus Images by Curve Operator” Proceedings of International Conference on Electrical Information and Communication Technology (EICT 2015), IEEE, 2015 pp no 143-147
- *Santhakumar R, 1, E R Rajkumar ,1 Megha Tandur Geetha K S,2 Kumar Thirunellai Rajamani,3 Girish Haritz 3 “A Fast Algorithm for Optic Disc Segmentation in Fundus Images” 2016 Intl. Conference on Advances in Computing, Communications and Informatics (ICACCI), Sept. 21-24, 2016, Jaipur, India, IEEE, 2016 pp no 716-719
- Namita Sengar1, Malay Kishore Dutta1, M. Parthasarathi1, Sohini Roychowdhury2, Radim Burget3 “Fast Localization of the Optic Disc in Fundus Images using Region-based Segmentation” 2016 3rd International Conference on Signal Processing and Integrated Networks (SPIN), IEEE, 2016 pp no 529-532.
- Malay Kishore Dutta, Amit Kumar Mourya, Anushikha Singh, M.Parthasarathi Radim Burget & Kamil Riha “Glaucoma Detection by Segmenting the Super Pixels from Fundus Colour Retinal Images” 2014 International Conference on Medical Imaging, m-Health and Emerging Communication Systems (MedCom) , IEEE, 2014 pp no 86-90.
- Sara Omid, Zeinab Ghassabi, Jamshid Shanbehzadeh, S. Shervin Ostadzadeh,” Optic Disc Detection in High-Resolution Retinal Fundus Images by Region Growing”, 2015 8th International Conference on BioMedical Engineering and Informatics (BMEI 2015) IEEE, 2015 pp no 101-105.
- Surendar, A., and M. Arun. “Efficient DNA Sequence Analysis for Reduced Gene Selection Using Frequency Analysis.”
- Surendar, A., & George, A. A real-time searching and sequencing assembly Platform based on an fpga implementation for Bioinformatics applications.International Journal of Pharma and Bio Sciences.

