Manuscript accepted on :
Published online on: 20-11-2015
Plagiarism Check: Yes
K. Pradhepa, S. Karkuzhali, D. Manimegalai
Department of Information Technology, National Engineering College, Kovilpatti, Tamilnadu, India.
DOI : https://dx.doi.org/10.13005/bpj/626
Abstract
Glaucoma is an eye disease that leads to vision loss without any major symptoms. Detecting the disease in time is important because it cannot be cured. Due to raised Intra-Ocular Pressure (IOP), the Optic Nerve Head (ONH) gets damaged and the assessment of ONH is more promising because it consists of Optic Disc (OD) and Optic Cup (OC) in retinal fundus image. OD and OC detection is important preprocessing step to diagnose glaucoma. In this paper, we proposed a segmentation of OD by FeatureMatch (FM) technique and OD is localized using medial axis detection. The correspondence between the OD reference image and any input image is found by FM. This correspondence provides a distribution of patches in the input image that are closest to patches in the reference image. The proposed work is evaluated using DRIONS-DB that consists of 110 images. The OD is correctly localized in more than 60 images. The performance measures such as Root Mean Square Error (RMSE) and Mean of Structural SIMilarity (MSSIM) are calculated. The average computational time for this proposed work is about 14 secs. The average RMSE of the proposed work is about 0.05389.
Keywords
Glaucoma; optic disc; optic cup; localization; FM
Download this article as:| Copy the following to cite this article: Pradhepa K, Karkuzhali S, Manimegalai D. Segmentation and Localization of Optic Disc Using Feature Match and Medial Axis Detection in Retinal Images. Biomed Pharmacol J 2015;8(1) |
| Copy the following to cite this URL: Pradhepa K, Karkuzhali S, Manimegalai D. Segmentation and Localization of Optic Disc Using Feature Match and Medial Axis Detection in Retinal Images. Biomed Pharmacol J 2015;8(1). Available from: http://biomedpharmajournal.org/?p=1019 |
Introduction
Glaucoma is a chronic eye disease which can be controlled but not cured. Glaucoma is caused by the increase in the intraocular pressure. It is the third leading cause of blindness in India and second leading cause of blindness Worldwide. It is estimated to affect 16 million people in India and 80 million people worldwide by 2020.
There is a small space in front of the eye called anterior chamber. Clear fluid flows in and out of the anterior chamber; this fluid nourishes and bathes nearby tissues. If a person has glaucoma, the fluid does not drain properly but it drains too slowly out of the eye or the fluid is not produced properly. Unless this pressure is brought down and controlled, the ONH may become damaged, leading to vision loss. OD is the entry point of the ONH and it gets damaged due to pressure. OD is also the entry and exit point for the major blood vessels that supply blood to the retina. OD is vertically oval shape. There is a central depression of variable size in the OD which is called Optic Cup (OC). The OC depth depends on the cup area in normal eyes. In normal eyes, the shape of the cup is horizontal diameter being about 8% bigger than the vertical diameter. Cup to Disc Ratio (CDR) is calculated as the ratio of Vertical Cup Diameter (VCD) to Vertical Disc Diameter (VDD). CDR is a prime indicator to detect Glaucoma.
There are two main types of Glaucoma: Open Angle Glaucoma (OAG) and Closed Angle Glaucoma (CAG). OAG is the most common form of glaucoma. If OAG is not treated, it may cause gradual loss of vision. CAG is rare and different from OAG. Treatment of CAG involves surgery to remove a small portion of the iris. The tests for detection of glaucoma are: (1) Eye Pressure Test, (2) Gonioscopy, (3) Perimetry test, and (4) ONH Damage. Assessment of damaged ONH is more promising and superior to visual field test for glaucoma screening. Along the various glaucoma risk factors, CDR is commonly used and well accepted. A larger CDR>0.3 indicates a higher risk of glaucoma [1].
During the analysis of retinal images, the important pre-processing step is the detection of OD. The localization of OD is based on two major assumptions: (1) OD is the brightest region (2) OD is the origin point of retinal vasculatures. Though OD is the brightest region, the shape, color and texture show large variation in the presence of Glaucoma [2]. A simple matched filter was proposed to roughly match the direction of vessels at the OD center. Then the retinal vessels were segmented using a simple 2-D Gaussian matched filter. The segmented vessels were filtered using local intensity to represent the final OD center [3]. A geometrical parametric model was proposed to describe the general direction of retinal vessels at any given position in the image. Model parameters were identified by means of simulated annealing technique and these values were the coordinates of OD [4]. A line operator was designed to capture circular brightness structure, which calculated the image brightness variation along the multiple line segments of specific orientation that passes through each retinal image pixel [5]. A novel algorithm called fuzzy convergence to determine the origination of the blood vessel network. A fuzzy segment model was proposed by a set of parametric line segments [6]. Morphological filtering was used to remove blood vessels and bright regions other than the OD that affect segmentation in the peripapillary region [7]. Mahfouz and Fahmy [8] described a fast technique that requires less than a second to localize the OD. The technique was based upon obtaining two projections of certain image features that encode the x- and y- coordinates of the OD. A circular transformation was designed to capture both the circular shape of the OD and the image variation across the OD boundary simultaneously [9]. A blob detector was run on the confidence map, whose peak response was considered to be at the location of the OD [10]. In the paper [11], Qureshi et al. proposed an efficient combination of algorithms for the automated localization of the OD, macula. They proposed adopting the following OD detectors found to achieve better predictive accuracy when combined; based on pyramidal decomposition, based on edge detection, based on entropy filter, based on Hough transformation and based on feature vector and uniform sample grid. The location of OD was found by fitting a single point-distribution-model to the image that contained points on each structure. The method can handle OD and macula centered images of both the left and the right eye [12].
This paper proposes FM maps to segment OD and detection of medial axis to localize OD. FM denotes the correspondence between a source image and target image, such that every patch in target image maps to a corresponding patch in source image, if it minimizes the Euclidean distance between them.
Materials and Methods
Database Used
In this work, 110 images obtained from DRIONS-DB database were used. This is a public database for benchmarking ONH segmentation from digital retinal images. The database consists of 110 colour digital retinal images. Initially, 124 eye fundus images were selected randomly from an eye fundus image base belonging to the Ophthalmology Service at Miguel Servet Hospital, Saragossa (Spain). From this initial image base, all those eye images (14 in total) that had some type of cataract (severe and moderate) were eliminated and, finally, the image base with 110 images was obtained.
For the selected 110 images, all those visual characteristics related to potential problems that may distort the detection process of the papillary contour. The mean age of the patients was 53.0 years (S.D. 13.05), with 46.2% male and 53.8% female and all of them were Caucasian ethnicity. 23.1% patients had chronic simple glaucoma and 76.9% eye hypertension. The images were acquired with a colour analogical fundus camera, approximately centred on the ONH and they were stored in slide format. In order to have the images in digital format, they were digitised using a HP-PhotoSmart-S20 high-resolution scanner, RGB format, resolution 600×400 and 8 bits/pixel.
Preprocessing
Preprocessing of images commonly involves removing low-frequency background noise, normalizing the intensity of the individual particle images, removing reflections, and masking portion of images. Image preprocessing is the technique for enhancing data images prior to computational processing. Fig 1 shows the block diagram for the proposed work.
Before processing the retinal images for OD detection, it is necessary to preprocess the retinal images to handle the illumination variations caused due to image acquisition under various conditions. A retinal image is pre-processed by Adaptive Histogram Equalization (AHE) and then the RGB image is converted to grayscale image. The histogram matching is performed between the source image and target image and then the image is converted to HSV color space.
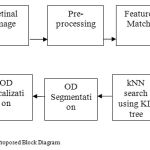 |
Figure 1: Proposed Block Diagram |
Featurematch
In a pair of images or regions source image A and target image B, the correspondence map for every patch in A to a patch in B which is closest under a patch distance metric, such as Euclidean distance is called the Nearest Neighbour Field (NNF). The basis of FeatureMatch (FM) is that every patch is approximated to a low dimensional feature and these features are used to find the nearest-neighbours. The Table I. shows the features extracted by FM in order to represent the p x p patch in low dimension.
kNN search using KD tree
k Nearest-neighbour search has been solved efficiently for low dimensional data using various types of tree structures. To construct a KD-tree, at each node, the points are recursively partitioned into two sets by splitting along one dimension of the data, until one of the termination criteria is met i.e., the maximum leaf size (the leaf contains fewer than a given number of points) or the maximum leaf radius (all points within the leaf are contained within a hyper-ball of given radius), or a combination of both. The controlling parameters are the dimension along which the split happens and the split value, commonly the maximum variance dimension is split along the median value. k-NN search on this KD-tree is performed, for which the leaf node where the query point would be contained is found first, and then nearby nodes are explored by backtracking. A sorted list of the k-closest points found so far is maintained, as well as the maximum radius around the query point that has been fully explored. Skipping the nodes farther from k-th closest point found, each candidate node point is added to a list of points sorted by distance. When the distance of the k-th neighbour is less than the maximum explored radius, the search is terminated [14].
OD Segmentation using Local Adaptive Thresholding
Local Adaptive Thresholding is the simplest method of image segmentation. From a grayscale image, thresholding can be used to create binary images. The simplest property that pixels in a region can share is intensity. So, a natural way to segment such regions is through thresholding, the separation of light and dark regions. Thresholding creates binary images from grey-level ones by turning all pixels below some threshold to zero and all pixels above that threshold to one. The feature matched output is converted to binary image by applying the threshold value of 30.
OD Localization using medial axis detection
Medial axis of an object is the set of all points having more than one closest point on the object’s boundary. Finally, the OD is located by calculating the center_row and center_column by taking average between the minimum number of rows (columns) and maximum number of rows (columns) respectively. The intersection point of this center_row and center_column is marked as the OD.
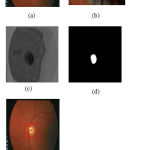 |
Figure 2: (a) Input Image, (b) Reference Image, (c) FM Output, (d) OD segmentation, (e) OD Localization |
Results and Discussion
Fig. 2. Shows the output for the proposed work. Fig. 2(a) is the input image obtained from DRIONS-DB database. The single reference image used for dictionary is not unique in any way, and a healthy retinal image can serve as the reference image. The reference image is obtained by manually cropping the OD from the retinal fundus image. The preprocessing is done and the histogram equalization is applied to both the reference image and the input image and the OD is identified as shown in fig. 2(b). The low dimensional features are computed simultaneously for both the reference image and input image and k-D tree is constructed. k-NN search is performed to locate the reference OD in the input image. Fig. 2(c) shows the Featurematched image which is obtained after the k-NN search. Then thresholding value is applied by trial and error method that must suits for all the images of the database and fixed as 30. So, the FM output is segmented by applying a threshold value of 30 and shown in fig. 2(d). Finally, fig. 2(e) shows the OD localized image by intersecting the center_row and center_column. The fig. 3 shows the output for various images in the database. The fig. 4 shows the incorrect results of OD segmentation due to illumination variation in the retinal image. Because of the incorrect OD segmentation, the OD is localized incorrectly. The Table. II shows the performances such as RMSE and mean of SSIM for various correctly segmented OD images. The average MSSIM is about 78% and this average depends on the reference image that is manually cropped. The average MSSIM can be increased by changing the reference image.
Table 1: Extracted Features
|
S.no |
Notation |
Name of the features |
| 1 | μR | Mean of Red channel in a image |
| 2 | μG | Mean of Green channel in a image |
| 3 | μB | Mean of Blue channel in a image |
|
4 |
μXg | Mean of X gradients of the patch |
| 5 | μYg | Mean of Y gradients of the patch |
|
6 |
WH1 | First frequency component of Walsh Hadamard Kernels |
| 7 | WH2 | Second frequency component of Walsh Hadamard Kernels |
| 8 | Pmax |
Maximum value of the patch |
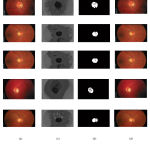 |
Figure 3: Sample results. From left to right columns: (a) the original images, (b) FM output, (c) Segmented output, (d) OD Localized output |
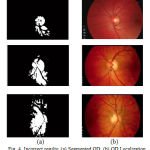 |
Figure 4: Incorrect results: (a) Segmented OD, (b) OD Localization |
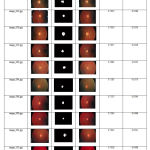 |
Table 2: Correct results with its performance Measures |
Conclusion
In this paper, we have proposed a method for segmenting the OD in the retinal image using FM and the location of OD is marked by detecting the central axis of the segmented OD. The accuracy of this method depends upon the single reference image which is used as a dictionary to locate OD and how well the FM map localises the OD location. Due to illumination, the localisation may not converge around the correct OD location. The disadvantage in this work is the selection of threshold to segment OD and so the parameter tuning method is proposed. This issue can be solved by using maximum likelihood map. The future enhancement of this work is to calculate CDR using segmented OD and OC and to classify the retinal image as normal or abnormal image.
References
- Cheng, J., Liu, J., Xu, Y., Yin, F., Wong, D.W.K., Tan, V., Tao, D., Yu Cheng, C., Aung, T., Wong, T. Y. Superpixel classification based optic disc and optic cup segmentation for glaucoma screening. IEEE Transactions on Medical Imaging., June 2013,;32( 6): 1019-1032.
- Avinash Ramakanth, S., Venkatesh Babu, R. Approximate nearest neighbour field based optic disc detection. Computerized Medical Imaging and Graphics., 2014; 32: 49-56.
- Youssif, A. A. A., Ghalwash, A. Z., Ghoneim, A. A. S. A. Optic disc detection from normalized digital fundus images by means of a vessels’ direction matched filter. IEEE Transactions on Medical Imaging., 2008; 27(1): 11-18.
- Forrachia, M., Grisan, E., Riggeri, A. Detection of optic disc in retinal images by means of a geometrical model of vessel structure. IEEE Transactions on Medical Imaging., 2004; 23(10): 1189-1195.
- Lu, S., Lim, J. H. Automatic optic disc detection from retinal images by a line operator. IEEE Transactions on Biomedical Engineering., 2011; 58(1): 88-94.
- Hoover, A., Goldbaum, M. Locating the optic nerve in a retinal image using the fuzzy convergence of the blood vessels. IEEE Transactions on Medical Imaging., 2003; 22(8): 951-958.
- Yu, H., Barriga, E. S., Agurto, C., Echegaray, S., Pattichis, M. S., Bauman, W., Soliz, P. Fast localization and segmentation of optic disc in retinal images using directional matched filtering and level sets. IEEE Transactions on Information Technology in Biomedicine., 2012; 16(4): 644-657.
- Mahfouz, A. E., Fahmy, A. S. Fast localization of the optic disc using projection of image features. IEEE Transactions on Image Processing., 2010; 19(12): 3285-3289.
- Lu, S. Accurate and efficient optic disc detection and segmentation by a circular transformation. IEEE Transactions on Medical Imaging., 2011; 30(12): 2126-2133.
- Sinha, N., Babu, R. V. Optic disc localization using l1 IEEE International Conference on Image Processing., 2012; 2829-2932.
- Qureshi, R. J., Kovacs, L., Harangi, B., Nagy, B., Peto, T., Hajdu, A. A combining algorithms for automatic detection of optic disc and macula in fundus images. Computer vision and Image understanding., 2012; 116(1): 138-145.
- Niemeijer, M., Abramoff, M. D. Segmentation of the optic disc, macula and vascular arch in fundus photographs. IEEE Transactions on Medical Imaging., 2007; 26(1): 116-127.
- Li, H., Chutatape, O. Automated feature extraction in color retinal images by a model based approach. IEEE Transactions on Biomedical Engineering., 2004; 51(2): 246-254.
- Ramakanth, S. A., Babu, R. V. Featurematch: A general ANNF estimation technique and its application. IEEE Transactions on Image Processing., 2014; 23(5): 2193-2205.


