P. P .V. Sudheer, R. Tejas and M. R. Ebenezar Jebarani
Department of E.C.E, Sathyabama University, Chennai, India.
DOI : https://dx.doi.org/10.13005/bpj/614
Abstract
In the present scenario, various scientific methodologies and advanced procedures are undergoing significant development to achieve an increase in crop yield and productivity,thereby reducing manual labour. Certain techniques involve the analysis and measurement ofbiological factors such as Tidal Volume, Germination and Survival Percentage, Plant height etc. This project proposes to measure the Leaf Area Index for estimating the plant growth and to provide an analysis of the plant quality to check if the plant is in a good condition or not. Direct and manual measurements of LAI prove to be time-sensitive and laborious. The use of sophisticated instruments such as LAInet and MODIS proveexpensive[7] . To overcome these limiting factors, a simple, cost effective real time hardware system has been designed. Image processing techniques like image segmentation, binarization, morphology and pixel statistics are used to identify the occurrence of diseases .Information obtained is transmitted to the land owner’s mobile through GSM module.
Keywords
Leaf Area Index; Pixel; RGB colour model; Calibration Factor
Download this article as:| Copy the following to cite this article: Sudheer P.P.V, Tejas R, Jebarani M. R. E. An estimation of crop leaf area index using image processing and gsm technology. Biomed Pharmacol J 2015;8(1) |
| Copy the following to cite this URL: Sudheer P.P.V, Tejas R, Jebarani M. R. E. An estimation of crop leaf area index using image processing and gsm technology. Biomed Pharmacol J 2015;8(1). Available from: http://biomedpharmajournal.org/?p=1289 |
Introduction
Analysis and estimation of Leaf Area Index is of prime importance in the agricultural sector. Various techniques have been implemented in an attempt to measure LAI [3] . Plant disease management has also become important as it has a critical impact on crop productivity and yield.
Various approaches have been implemented in order to predict the occurrence of diseases. They include molecular methods, serological methods, gaseous and plant metabolite profiling, spectroscopic and imaging techniques [2]. The first three approaches, despite being accurate and precise, pose a limitation to several factors including cost, dependency on the plant species and other environmental factors. Hence, spectroscopic and imaging techniques are cost effective and are easier to follow as they are species-independent, and are also independent of environmental factors [6] .Moreover, these techniques also enable large scale monitoring of the plants over a widespread location.
Leaf Area measurements can be categorized as direct and indirect LAI measurements. The former involves leaf gathering, area calculation and measurement of weight of dried leaves to derive the ratios of leaf area and mass per unit ground area[9]. The existing method provides an accurate and reliable means to estimate LAI, and hence is considered to be efficient. However, applying these methods in evergreen species is invasive.
This may prove laborious and cumbersome, especially in case of remote measurements [8].
Indirect methods, on the other hand, employ a non- destructive procedure and are easier to implement[5].These methods are given preference in cases where the values are to be measured from large remote areas [4] . The indirect methods include contact and non- contact measurements which involve gap fraction distribution and gap size distribution [2] .
The indirect methods provide an inaccurate measurement of LAI as they fail to account for several environmental factors such as humidity and arid regions in comparison with the direct methods [1] .
Proposed Methodology
A web camera is used to capture the images of the plant. The video captured by the camera is then converted into several frames and each and every frame is processed individually. At first, an RGB frame is subjected to a colour combination process,i.e., if green coloured component pixels are greater than red and blue components, the pixel value is assigned white colour. If the difference between green and blue colour component is greater thana particular threshold, the pixel is set white while remaining pixel values are zero.
These operations, when performed sequentially, result in a black and white image. Morphological features are used to eliminate unwanted components having pixel size .After segmentation of the leaf area from thewhole image;disease estimation is carried out. A sequence of steps is followed in order to estimate the LAI, thequality and the occurrence of the disease.
- Image resizing
- RGB Model
- Colour Combination
- Binarization
- Identification of diseased portions
- Image Morphology
- Thresholding
- Leaf Area Index Calculation
Image Resizing
The proposed system, when implemented in a real time environment, consists of a web camera which is capable of capturing the images successively or to capture a video. At the time of capturing images, the dimensions of the captured image is then resized by implementing the imresize() command in MATLAB.
The output of a resized image will have the same number of rows and columns as specified in the imresize() command. This is done according to the dimensional compatibility of the camera.
RGB Model
The image of the plant or the leaf is then subjected to an RGB colour model. This model is capable of representing the entire colours of the image in terms of three primary colours i.e., Red, Green and Blue colours respectively. Hence the first stage involves obtaining the RGB equivalent of an input image.
Colour Combination Process
This RGB image is then subjected to a colour combination process. This step is dependent based on the type of leaf images obtained and environmental conditions such as sunlight and climatic changes.
The colour combination process compares the intensities of the green pixels with those of the blue and red pixels. This is done in order to extract any green pixels present in the image. This is because, the green coloured pixels are assumed to be the healthy regions of the plant.
Binarization
Binarization refers to the process of assigning a binary digit, to convert any image into its black and white equivalent, according to the pixel intensities of an RGB image.
This technique is performed by selecting a threshold value and comparing it with all the other pixel values. White pixels are recognized if their values exceed the threshold. It is important to identify the correct threshold. Adaptive binarization is used to overcome the limitations of ordinary binarization technique.
The steps from 1 to 4 when performed sequentially correspond to the segmented image obtained and hence this process is called as image segmentation. The image is segmented into two areas, one being the leaf and the other being the background.
Thus the segmented image will be equivalent to the input image, with the replacement of green pixels with white. The non-green areas are designated as black, which may account for two factors: one, owing to the diseased area of the leaf, the second being the leave’s background.
Identification of the diseased portions
Here, the average value for each pixel is assigned first by identifying all the white pixels of the segmented image i.e., the green areas of the leaf.
The average value is then calculated byevaluating the ratio of total intensity of the green pixels to the number of green pixels.
Thus, on complementing the green areas, we obtain the diseased portions of the leaf.
ImageMorphology
Morphology in MATLAB is performed by using the bwareaopen() function. This function is used to remove small objects i.e.; objects consisting of a very few pixels.
They correspond to the diseased area since they have very less intensity values. The result is again, another binary image, where all small objects are removed.
Thresholding
In this process, average values are being taken into account for estimating the plant quality. The total number of centroids is calculated for those areas which have maximum green pixel intensity and a particular critical value is set, exceeding which the leaf is diseased. Within the critical value, the leaf is not diseased. A predefined command, known as viscircles(), is used to represent the diseased areas in the form of small circles.
Leaf Area Index calculation
Leaf area is obtained by finding the number of green coloured pixel elements the. The LAI is calculated by multiplying the leaf area by a calibration factor.
L= (h*w) * Calibration Factor ^ 2
LAI=Leaf Area in Square Cm /L.
Where;h and w refer to the height and width of the image.
Calibration Factor can be adjusted depending on the dimensions of the background
Hardware implementation
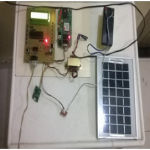
An automated system has been introduced to intimate the landowner about plant growth in terms of Leaf area, quality and disease occurrence through GSM. In addition, the humidity levels of the environment are sent in the form of SMS.A detailed description of the hardware design is given below
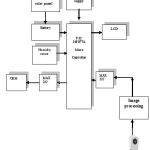 |
Fig 1 : Hardware Design |
Realtime hardware implementation
 |
Click here to view figure |
Simulated Results
Simulations are performed in MATLAB 2012a version
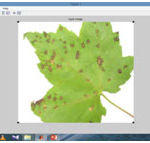 |
Fig 2: Input Image ofa Diseased Leaf |
Fig 2 shows the input image obtained from the digital camera. From the image, it can be observed that the image has two main components i.e.; the leaf and the background image.
Hence, in order to obtain the segmented image i.e.; to separate the individual components, the input image is resized and then subjected to a colour combination process based on the RGB model, followed by binarization technique.
Filtering of noise is also done in order to obtain a clear image which can be processed subsequently
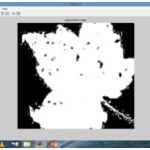 |
Fig 3:Segmented Image-1 |
Fig 3 represents the input image after theimage segmentation process. The entire image is segmented into two regions, namely the background region and the region corresponding to the leaf.
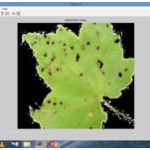 |
Fig 4: Segmented image-2 |
Fig. 4 is subjected to thresholding.
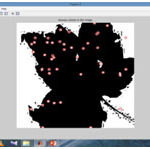 |
Fig 5: Disease occurrence in the image |
Fig 5 is obtained after performing morphological operations on the segmented images. Disease identification is done based on calculating the number of centroids. They are represented in the form of small circlesby using the viscircles() function. Depending on the number of centroidsand the average value, the LAI and plant quality can be monitored.
Conclusion
Thus, areal time automated system for measuring the vegetation LAI using image processing has been developed where remote monitoring of the fields is feasible by designing a hardware system. One of the advantages of such a system is that it is cost effective and accurate. A non-invasive procedure is employed for theestimation of LAI in comparison with direct methods of measurement.
References
- Abdullah N.E, Rahim A.A, Hashim.H, Kamal.M.M.”Classification of rubber tree leaf diseases using multilayer perceptron neural network”.In:2007 5thstudent conferenceon research and development, IEEE. 2007, pp16.
- Bréda N.J.J.,“Ground-based measurements of leaf area index A review of methods, instruments and current controversies,” J. Exp. Bot., vol. 54, no.392, pp. 2403–2417, 2003.
- Lang A.R.G and X.Yaquina,” Estimation of crop leaf area index from transmission of direct sunlight in discontinuous canopies”, Agri Forest Meteorol, vol. 3,Aug 1986 pp 229-243.
- Liu.J, Elizabeth Pattery ”Retreival of LAI from canopy digital photography over agricultural crops”, vol 150, Oct 2010, pp 1485-1490.
- Phadikar.S and Sil.J,” Rice disease identification using pattern recognition techniques”.IEEE, Khulna, pp 420–423.
- PugoyRADL,MarianoVY,”Automated rice leaf disease detection using colorimage analysis” in :3rd international conference on digital image processing, volume 8009.SPIE, Chengdu,ppF1–F7.
- Wiwart.M, Fordonski.GSuchowilska.E,” Early diagnostics of macro nutrient deficiencies in three different legume species by color image analysis”.Comput Electron Agric 200965:125–132.
- YonghuaQu , Yuzhen Zhang and JindiWang,”A DBN fusioned algorithm for estimating LAI using the time series data frominsitu measurements to remote sensing observations”,vol 33,2012,pp 1106-1125.
- Yuvan.Y , Shandshan , Kui.W , J.Weija.P, ”FOCUS: A cost effective real time approach for large scale crop monitoring using sensor networks ”, IEEE sixth International Conference on the Mobile Ad Hoc and Sensor Systems,2009,pp 544-553


