Ganesh Babu. T. R1, R. Sathishkumar2 and Rengaraj Venkatesh3
1Electronics and Communication, Shri Andal Alagar College of Engineering, India 2Electronics and Communication, Sri Venkateswara College of Engineering, India 3Chief Medical Officer, Aravind Eye Hospital, India.
DOI : https://dx.doi.org/10.13005/bpj/544
Abstract
Automatic retinal image analysis is emerging as an important screening tool for detection Glaucoma, which causes the blindness. Segmentation of optic disc, optic cup neuro retinal rim and retinal blood vessels provide important parameters for detecting and tracking this disease. This paper proposes an approach for the automatic detection of optic disc and optic cup using spatially weighted fuzzy c-mean clustering method and region of interest (ROI) based segmentations. It can be used to automatically segment neuro retinal rim. The blood vessels in the optic disc region are segmented by local entropy thresholding. The ratio of area of blood vessels and neuro retinal rim in the inferior Superior side to area of blood vessels and neuro retinal rim in the inferior superior nasal temporal (ISNT) side is combined with the CDR for the classification of fundus image as normal or glaucoma by using back propagation neural network (BPNN) and support vector machine (SVM) classifier. A batch of 300 retinal fundus images are used to assess the performance and a classification rate of 96 % is achieved.
Keywords
Glaucoma; Spatially weighted fuzzy c – mean clustering; Local entropy thresholding; Support vector machine; Neural network classifier
Download this article as:| Copy the following to cite this article: Babu.T. R. G, Kumar R. S, Venkatesh R. Segmentation of Optic Nerve Head for Glaucoma Detection using Fundus images. Biomed Pharmacol J 2014;7(2) |
| Copy the following to cite this URL: Babu.T. R. G, Kumar R. S, Venkatesh R. Segmentation of Optic Nerve Head for Glaucoma Detection using Fundus images. Biomed Pharmacol J 2014;7(2). Available from: http://biomedpharmajournal.org/?p=3269 |
Introduction
Glaucoma, is the major cause for blindness [1], is initiated due to increase in intraocular pressure (greater than 21mm of Hg) and it leads to damage to optic nerve [2]. The cup to disc ratio value of more than 0.3 indicates the presence of glaucoma. The colour fundus images are used to track the same by its anatomical structures such as blood vessels, optic cup, optic disc and macula for a normal retina. In a normal eye physical diameter of the optic disc is about 1.5 mm that is placed 3 to 4 mm to the nasal side of the fovea. A small depression seen at front of the optic nerve head is known as the cup and is smaller than the optic disc. A number of studies have reported on the same. In 2006, Yandong Tang et al presented an automatic segmentation of the papilla in a fundus image based on the Chan-Vese model and a shape restraint. The results show a good performance in detecting the papilla shapes and computing the shape feature parameters. It also shows that the method is robust to noise and object deformity [3]. A.A.Vlachokosta et al presented a preliminary study on the association of vessel diameter variation and glaucoma. It involves the extraction of vessel centerlines by means of differential calculus and the geometrical alignment of the images using the chamfer matching algorithm [4]. Sekhar et al presented an automated localization of retinal optic disc using fundus image for the detection of glaucoma, with the morphological processing. For detecting the main circular feature within the positive horizontal gradient image within this region of interest, Hough transform is used [5]. D.W.K. Wong et al presented a level set based automatic cup to disc ratio determination using retinal fundus images in ARGALI. Here variational level set is used for disc segmentation and threshold level set for cup segmentation. An ellipse fitting is also used here for boundary smoothening [6]. J. Liu et al presented optic cup and disc extraction from retinal fundus images for determination of cup to disc ratio using threshold method and variational level set method. Further, SWFCM method is used for optic disc and optic cup segmentation. Elliptical and morphological methods are used for smoothing the cup boundary. The features used in the method to detect the glaucoma are CDR and ISNT ratio applied to the retinal RIM area. Also, the inferior superior nasal temporal (ISNT) rule is applied to the retinal blood vessels in the optic disk to assist glaucoma diagnosis [7].
System Overview and Methodology
The simplified work flow of the glaucoma detection system is shown in Figure 1, in which the automated scheme for determination of CDR consists of segmentation of the optic disc and optic cup by using spatially weighted fuzzy c-mean clustering algorithm. The input fundus image is converted into gray scale image. The Figure 2(a) shows the original RGB fundus image in Green plane (G) that is considered for the analysis and then the brightest point is identified, so as to select the region of the optic disc. After analyzing 100 number of fundus images of size 1504 x 1000 pixels, it is decided to consider a square of size 200 X 200 pixels with the brightest pixel as the centre point and this region is found to cover the entire optic disc along with a small portion of other regions of the image. The Figure 2(b) shows the identified region where optic disc is located. The ROI image contains the optic disc, cup and the blood vessels. Hence the blood vessels must be blurred in order to obtain better segmentation of optic disc and cup region by adjusting the image intensity and morphological closing [10]. The results are shown in Fig. 2 (c) and Fig. 2 (d).
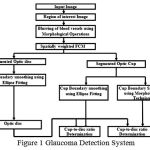 |
Figure 1: Glaucoma Detection System
|
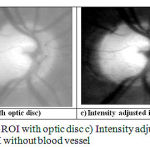 |
Figure 2: a) Input image b) ROI with optic disc c) Intensity adjusted image d) ROI without blood vessel
|
Segmentation of Optic Disc and Optic Cup
The spatial weighted fuzzy C mean clustering algorithm (SWFCM) is applied to the images. The drawback of the Fuzzy C Means clustering (FCM) is, sensitive to noise and does not consider the spatial information of pixels [11]. To overcome the same, SWFCM is used. The spatial relationship is important in clustering and to exploit the same via [12]

Where represents a square window centered on pixel in spatial domain. Larger window size may blur the images and the lower window size does not remove the noise at high density. Therefore, 5 x 5 window sizes are used. The spatial function represents the probability that the pixels belong to the ith cluster. The spatial function of pixel is large if the majority of its neighborhood belongs to the same clusters. The spatial function is incorporated into membership function by

Where p and q are controlling parameters of both functions. The spatial functions strengthen the original membership in a homogenous region. However, this formula reduces the weighting of a noisy cluster in noisy pixels by the labels to its neighboring pixels. As a result misclassified pixels from noisy region or spurious blobs can easily be corrected. The spatial FCM with parameter p and q is denoted If p = 1 and q = 0, then SFCM1,0 is identical to the conventional FCM [13]. The clustering is a two-pass process at each iteration. The first pass is the same as that in standard FCM to calculate the membership function. In the second pass, the membership information of each pixel is mapped to the spatial domain and the function is computed. The FCM iteration proceeds with the new membership that is incorporated with spatial function. The iteration is stopped when the maximum difference between two cluster centers at two successive iterations is less than 0.00001. After the convergence, defuzzification is applied to assign each pixel to a specific cluster for which the membership is maximal. The algorithm flows are given below.
Step 1: Generate the random number with the range from 0 to1 to be the initial memberships. Let us consider the number of cluster is N, so

Where

Step 2: Map into the pixel position and calculate the modified membership using (2). To compute objective function

Step 3: Update the center using
Step 4: Repeat steps 2 to step 4 until
![]()
Where
vi is the ith cluster center, (let vi = 3) and m is fuzziness parameter (m = 2). The segmented image has three clusters, namely cup, disc, and background as shown in the Figure 3(a).The optic disc and cup clusters are separated from the clustered image to determine the cup to disc ratio.
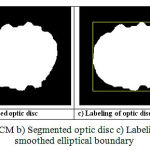 |
Figure 3: Image of a) SWFCM b) Segmented optic disc c) Labeling of optic disc region d) smoothed elliptical boundary
|
Detection of Optic Disc and area calculation
In order to form the optic disc, background cluster is eliminated by searching the corner cluster index. Then optic disc and optic cup cluster are made as true pixels. The Fig. 3(b) shows the segmented optic disc image. The elliptical fitting is applied for smoothening optic disc boundary, as described in [14, 15]. The labeling is applied to form the rectangle containing the whole disc region as shown in Fig 3(c). The centroid of the rectangle is taken as a centre to draw an ellipse by
X = a*(cosα cosβ) – b*(sinα sinβ) (7)
Y = a*(cosα sinβ) + b*(sinα cosβ) (8)
where β = 0o, α varies from 0 o to 360 o
Area = πab (9)
Where a is the major axis length (half of the rectangle width) and b is minor axis length (half of the rectangle height). The inscribed in the rectangle as shown in Fig. 3(d). The optic cup is identified by selecting the cluster index at the brightest point in the ROI image. The Figure 4(a) shows the optic cup and its areas is computed by elliptical method and the resulting image is shown in Figure 4(b). The shape of the optic cup may not be exactly circular, hence the elliptical fitting lead to error in area calculation for CDR. So the morphological operations are applied to use the actual shape. The identified cup region from the clusters may have holes and they will have to be filled up for correct area calculation. The morphological dilation is performed on this identified cup to fill the hole as shown in Figure 4(c).
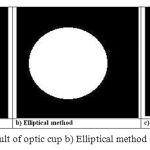 |
Figure 4: Images of a) Result of optic cup b) Elliptical method c) Morphological method
|
The CDR values are calculated by the algorithm. Fig.5(a) and 5 (b) shows the results obtained by using elliptical method for a normal and abnormal subject respectively [15]. Fig.5 (c) and 5(d) shows the results obtained by the proposed morphological method for a normal and abnormal subject respectively. Cup to disc ratio range for normal condition is from 0.1 to 0.3. If the cup to disc ratio exceeds 0.3, then it indicates the presence of glaucoma [16]. Using these results the presence of glaucoma can be identified.
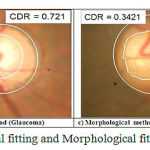 |
Figure 5: Images of Elliptical fitting and Morphological fitting (Normal and Glaucoma)
|
Isnt Analysis
The ISNT ratio is calculated for retinal blood vessels in the disc area and in the retinal RIM area [17]. The Figure 6(a) shows the four quadrants of the fundus image. The upper quadrant and lower quadrants are superior (S) and Inferior (I) respectively. Nasal (N) is the quadrant close to nose and the last quadrant is the temporal (T) one. The blood vessels are enhanced by the matched filter to obtain matched filter response. An entropy thresholding scheme differentiates the blood vessels and background [18]. The length filtering technique removes the misclassified pixels. Then the vascular intersection detection is performed by a window based probing process. The Figure 6(b) and 6(c) shows the ROI abnormal fundus image and segmented blood vessels image for abnormal subjects. Most blood vessels are concentrated in the superior and the inferior regions and cover about 27% of the optic disc area [19].
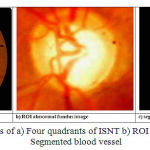 |
Figure 6: Images of a) Four quadrants of ISNT b) ROI of abnormal c) Segmented blood vessel
|
A shift in the optic nerve head causes a slight increase in the area covered by the blood vessels in the nasal regions and decreases the area covered in superior and inferior regions. The ratio of the sum of blood vessels area in the inferior and superior region to area of blood vessels in the sum of the nasal and temporal region will show a difference between normal and glaucoma images. A glaucomatous eye has lower ISNT ratio [19]. A mask image (200 x 200) is used to measure the area of the blood vessels in the ISNT quadrant. The mask is rotated by 90º each time and is used to obtain the area covered by blood vessels in each quadrant. The mask fits the image perfectly as both the cropped image and the mask have the same dimensions of 200 x 200. The Fig.7 (a1), 7(a2), 7(a3) and 7(a4) show the corresponding blood vessels in each quadrant mask. The area of the blood vessels is evaluated by the counting of the white pixel in the region. In order to get the ISNT ratio, the sum of the area of the inferior and the superior regions of the blood vessels is divided by the sum of the area of the nasal and the temporal region of the blood vessels. The neural rim configuration becomes available for the diagnosis of glaucoma according to the ISNT rule [20]. The detection of rim distances in four directions can assist the correct verification of ISNT rule and then improve the correct diagnosis of glaucoma at early stages. The Figure 7 (b1), 7(b2), 7(b3) and 7 (b4) shows the RIM area in the surrounding of optic disc. The image which has low ISNT ratio indicates glaucomatous eye.
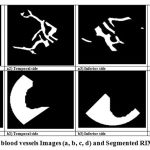 |
Figure 7: Segmented blood vessels Images (a, b, c, d) and Segmented RIM area in (e, f, g, h)
|
Results and Discussion
The developed algorithm is tested on 50 normal and 50 glaucoma images based on CDR, ISNT ratio for blood vessels and ISNT ratio for neural retinal rim. Table 1 shows the CDR range, mean and mean error of the SWFCM clustering method.
Table 1: CDR range, mean and mean error of the SWFCM clustering method
| S No | Parameters | Normal Images | Abnormal Images |
| 1 | Mean value of CDR using Elliptical Method | 0.3148 | 0.5871 |
| 2 | Mean value of CDR using Morphological Method | 0.2907 | 0.5468 |
| 3 | CDR ranges of Elliptical method | 0.192 to 0.399 | 0.409 to 0.921 |
| 4 | CDR ranges of Morphological Method | 0.142 to 0.361 | 0.421 to 0.876 |
| 5 | Mean error of CDR using Elliptical Method | 3.06% ( 3.83% for FCM) | |
| 6 | Mean error of CDR using Morphological Method | 1.67% (3.52% for FCM) | |
The error values for the same set of images with FCM are shown in the Table 1 for comparison. The error is reduced in SWFCM because the cup region is correctly identified by taking the pixel correlation into consideration. The Figure 8 shows the scatter plot of cup to disc ratio between observed and gold standard using morphological method. The Figure 9 shows the scatter plot of cup to disc ratio between observed and gold standard using elliptical method. A high degree of correlation is found between the results obtained by cup – disc area ratio. The correlation coefficient for elliptical method is 0.977 and for morphological method is 0.981.
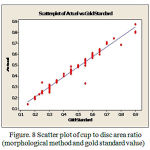 |
Figure 8: Scatter plot of cup to disc area ratio (morphological method and gold standard value)
|
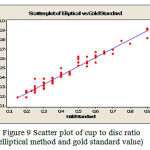 |
Figure 9: Scatter plot of cup to disc ratio (elliptical method and gold standard value)
|
It is inferred that a linear regression is obtained from the scatter plot which gives the relation between observed value and gold standard value. Even though there is a high correlation, the mean error in above analysis differs. In morphological method, the mean error is 1.67% whereas in elliptical method the mean error is 3.06%. Hence the morphological method is more efficient than the elliptical method. The ISNT mean values for all these images are listed in Table 2. From the table, it is obvious that the glaucoma eye has lower ISNT whereas the normal eye has larger ISNT.
Table 2: Results of ISNT ratios
| S.No | Features | Normal condition | Glaucomatous condition |
| 1 | ISNT (BV) | 0.688 to 2.912 | 0.432 to 1.0621 |
| 2 | ISNT (RIM) | 1.2009 to 2.786 | 0.8868 to 1.2106 |
| 3 | Mean values for ISNT Ratio using
blood vessels |
1.254 | 0.85006 |
| 4 | Mean values for ISNT Ratio using
retinal RIM |
1.21 | 1.12 |
| 5 | Standard Deviation for ISNT Ratio
using blood vessels |
0.3656 | 0.1599 |
| 6 | Standard deviation for ISNT Ratio
using RIM |
1.609 | 1.071 |
Detection of glaucoma by classifier
In this work, the total fundus images of 300 patients have been used, in which 50 are normal patient and 250 are glaucoma patients. Features such as cup to disc ratio, ISNT ratio (blood vessels), ISNT ratio (RIM area) are computed for both the samples. Due to overlapping problems and find relation between the features, initially back propagation neural network (BPNN) is used for classification. Table 3 shows the range of features in fundus image. To test the validity of the features, we used the BPNN. The Table 4 shows the result in which the accuracy is 89.33%. To improve the same, SVM classifier applied and linear kernel is used to map the training data. The results of the classifier are shown in Table 5, in which the classification accuracy is improved to 94.9%. Finally the Tabl.6 show the classification results of data.
Table 3: Range of features in Fundus image
| S.No | Features | Normal Range | Abnormal Range |
| 1 | CDR | 0.142 to 0.361
(morphological method) |
0.421 to 0.876
(morphological method) |
| 2 | ISNT (BV) | 0.688 to 2.912 | 0.432 to 1.0621 |
| 3 | ISNT (RIM) | 1.2009 to 2.786 | 0.8868 to 1.2106 |
Table 4: Data set that are correctly classified by BPNN
| Type of Image | No. of Data Sets Used for Training | No. of Data Sets Used for Testing | Correctly Classified Test Data | Percentage Correctly Classified (%) |
| Normal | 35 | 15 | 13 | 86.66% |
| Glaucoma | 165 | 85 | 81 | 95.29% |
| Average | 90.975% | |||
Table 5: Data set that are correctly classified by SVM
| Type of Image | Number of samples used for Training | Number of samples Used for Testing | Correctly Classified Test Data | Percentage Correctly Classified (%) |
| Normal | 35 | 15 | 14 | 93.33% |
| Glaucoma | 165 | 85 | 82 | 96.47% |
| Average | 94.9% | |||
Table 6: Data set and classification results
| Classifier | TN | TP | FP | FN | Sensitivity | Specificity | Positive Predictive value | Accuracy |
| SVM | 14 | 82 | 1 | 3 | 96.47% | 93.33% | 98.83% | 96% |
| BPNN | 13 | 81 | 2 | 4 | 95.29% | 86.66% | 97.59% | 94% |
Conclusion
A fast and reliable detection method for finding the optic disc, optic cup, retinal blood vessels and neuro Retinal RIM area has been presented in this work. The method of considering the ISNT rule is applied to neuro retinal rim and can be used as an additional feature for distinguishing between normal and glaucoma. Progressive loss of neuro retinal rim tissues gives as accurate result to detect early stage of glaucoma.The features such as CDR, ISNT rule applied to blood vessels and ISNT rule applied to neuro retinal RIM area are computed automatically and the performance of the proposed algorithm is tested in two different classifiers. The results show that the maximum classification rate of 93% for glaucoma is achieved using the SVM classifier.
References
- Xiaoyang Song1, Keou Song2, Yazhu Chen,” A Computer-based Diagnosis System for Early Glaucoma Screening”, Proceedings of the IEEE conference on Engineering in Medicine and Biology, pp. 6608-661, China, September 2005,
- George and L. Vijaya First World Glaucoma day, March 6, 2008: Tackling glaucoma challenges in India Indian J Ophthalmol. 2008 Mar-Apr; 56(2):97-8.
- Yandong Tang et al, “Automatic Segmentation of the Papilla in a Fundus Image Based on the C-V Model and a Shape Restraint, Proceedings of the international conference on Pattern recognition, vol.1, pp 183-86, USA 2006
- A.Vlachokosta et al, “ Preliminary study on the association of vessel diameter variation and Recognition,2006
- Sekhar, W.Al –Nuaimy and A.K.Nandi, “ Automated localization of retinal optic disc using houghtransform”, IEEE Transactions, pp.1577-1580,August 2008.
- W.K.Wong et al, “Level set based automatic cup to disc ratio determination using retinal fundus images in argali”, IEEE Transactions, 2008.
- Liu, D. W. K. Wong, J.H. Lim, X. Jia, F. Yin, H. Li, W. Xiong, T. Y. Wong, “ Optic Cup and Disk Extraction from Retinal Fundus Images for Determination of Cup-to-Disc Ratio”, IEEE Explore pp. 1828-1832.
- Kavitha and S.Shenbagadevi (2005),“Automatic detection of optic disc and exudates in glaucoma challenges in India’ Indian Journal of Ophthalmology, Vol.56, No.2, pp. 97-98.retinal images”, Proceedings of ICISIP,pp.501-506.
- Walter and J.C.Klein,”Automatic analysis of color fundus photographs and its application to the diagnosis of diabetic retinography,”in Handbook of Biomedical Image Analysis,vol.2,pp.315-368,2005.
- Jiang, A. Bainridge-Smith, A. B. Morris, ‘Blood Vessel Tracking in Retinal Images’, Proceedings of Image and Vision Computing New Zealand 2007, pp. 126–131, Hamilton, New Zealand, December 2007.
- R. Pal, K. Pal and J. C. Bezdek, “A mixed c-means clustering model,”Proceedings of the IEEE International Conference on Fuzzy Systems, vol. 1, pp. 11-21, Jul. 1997.
- Mohamed Ali Mahjoub- Improved FCM Algorithm applied to Color Image Segmentation, Canadian Journal on Image Processing and Computer Vision Vol. 2, No. 2, pp 16-19, February 2011
- Keh-Shih chuang, Hong-Long Tzeng, Sharon Chen, Jay Wu, Tzong- Jer Chen , “Fuzzy C-Means clustering with spatial information for image segmentation”, Journal of Computerized medical imaging and graphics, Vol 30,(2006), pp 9-15.
- Fitzgibbon, M. Pilu, and R. B. Fisher, “Direct least square fitting of ellipses,” IEEE T Pattern Anal, vol. 21, pp. 476-480, May 1999.
- R. Ganesh Babu,S.ShenbagaDevi- Automatic detection of glaucoma using fundus image.European Journal of Scientific Research Vol.59 No.1 (2011), pp.22-32.
- Greaney, M. J., Hoffman, D. C., Garway-Heath, D. F., et al. Comparison of optic nerve imaging methods to distinguish normal eyes from those with glaucoma. Invest. Ophthalmol. Vis. Sci. 43:140–145, 2002.
- NogaHarizman, MD et.al – The ISNT rule and differentiation of normal from glaucomatous eye arch ophthalmol/vol 124 american medical association nov2006 pp 1579-1583.
- Thitiporn Chanwimaluang and Guoliang Fan an efficient blood vessel detection algorithm for retinal images using local entropy thresholding.IEEE conference 2003 pg no(v-21 to v-24).
- Al.Automated Diagnosis of Glaucoma Using Digital Fundus Images. Journal of medical systems volume 33, issue 5, pp337-346.C
- Chih-Yin Ho et al An automatic fundus image analysis system for clinical diagnosis of glaucoma2011 International Conference on Complex, Intelligent, and Software Intensive Systems pp(559-564)


