Preventive Administration of Glucocorticoids Does not Suppress Lipopolysaccharide-Induced Neuroinflammation
 , , 2, Viktoriya Maystrenko2, , 2Marina Karpenko 2
¹Institute of Biomedical Systems and Biotechnology, Peter the Great St. Petersburg Polytechnic University, Saint Petersburg, Russia
²Laboratory of Neurochemistry, I.P. Pavlov Dept. of Physiology, Institute of Experimental Medicine, Saint Petersburg, Russia
Corresponding Author E-mail: lena98.98.89@gmail.com
Download this article as:
ABSTRACT:Glucocorticoids are widely prescribed to limit inflammation, yet their action within the brain may differ depending on when they are given relative to an inflammatory challenge. This work examined how dexamethasone and methylprednisolone, administered before an endotoxin challenge, modify the early and delayed molecular and morphological consequences of systemic endotoxemia. Adult male rats of the Wistar strain were allocated to saline, bacterial endotoxin (1 mg per kg body weight), either steroid alone (2 mg per kg body weight), or a steroid given two hours in advance of the endotoxin. Brain tissue was sampled two days and ten days after the challenge. Sections of prefrontal cortex and hippocampus stained with haematoxylin and eosin were examined for structural alterations, and transcript abundance of TNF-α, IL-1β, iNOS and the microglial marker IBA-1 was measured in the same regions by reverse-transcription quantitative PCR. Endotoxin raised transcript abundance of all four markers in both regions at both sampling points, together with histological signs of neuronal injury, namely acidophilic neurons and reduced neuronal cellularity. Prior steroid exposure lowered part of the two-day transcriptional response, whereas several markers remained above control values on day ten, most consistently in the hippocampus; neither steroid given alone evoked a reproducible transcriptional response. Because the doses employed were not equipotent, the two steroids were not compared with each other. Partial and non-sustained attenuation, together with residual transcriptional and structural alterations on day ten, is compatible with a priming-like shift in reactivity of the neuroinflammatory compartment, and indicates that the timing of steroid administration deserves consideration during systemic inflammation.
KEYWORDS:Dexamethasone; Hippocampus; Lipopolysaccharide (LPS); Methylprednisolone; Neuroinflammation; Prefrontal cortex
Introduction
Neuroinflammation is a key component across a broad spectrum of neurological and psychiatric conditions, among them Alzheimer’s disease, depression, multiple sclerosis, the sequelae of traumatic brain injury, and infectious lesions of the brain and spinal cord (central nervous system, CNS).1-4 Neuroinflammation is not confined to the role of a secondary process: numerous studies confirm that inflammatory reactions in the brain can not only accompany neurodegeneration but also initiate it, exacerbating neuronal damage.1,2,5
Modern treatment options for conditions involving neuroinflammation are still limited. Glucocorticoids (GCS) remain the main class of drugs for alleviating acute inflammation in multiple sclerosis, autoimmune encephalitis, and brain oedema of tumor or infectious origin.6,7 In neurological practice, GCS are predominantly synthetic preparations with high glucocorticoid activity, such as Dexamethasone (Dex) and methylprednisolone (MP). Dexamethasone has demonstrated pronounced neuroprotective and anti-inflammatory effects in clinical and experimental models of brain injury, including TBI and LPS-induced neuroinflammation.8-10 MP is one of the most extensively studied glucocorticoids and has been evaluated in clinical trials for spinal and brain injury.11 Dexamethasone serves as the reference compound when neuroprotective and anti-inflammatory properties of this class are examined experimentally; methylprednisolone provides a clinically grounded comparator under conditions of experimental endotoxinaemia. Due to their widespread clinical use, confirmed anti-inflammatory effects and scientific interest, Dexamethasone and methylprednisolone were chosen as the focus of this study. Because the doses applied here are not equipotent, the two compounds were not compared with one another directly.
Of particular interest is the study of the dual effects of GCS on markers of neuroinflammation. GCS are traditionally regarded as potent anti-inflammatory agents, owing to their ability to significantly suppress pro-inflammatory gene expression and inhibit microglial activity. However, compelling evidence indicates that under certain conditions – high doses, chronic exposure or preventive administration prior to an immune stimulus – GCS can enhance the inflammatory response in the brain (microglial ‘priming’), increase expression of the NLRP3/NLRP1 inflammasomes and contribute to neuronal damage.5,12-16 A key factor appears to be the timing of GCS administration relative to the inflammatory trigger: administered after inflammation develops, GCS show predominantly anti-inflammatory effects; administered beforehand, they may sensitize brain immune cells to the subsequent stimulus (“duality” of action).12,16,17 However, the mechanisms underlying this dual effect have not yet been fully elucidated. At the same time, the regional specificity of GCS effects in CNS structures remains relevant.
Available data indicate that different brain structures respond differently to both neuroinflammation and glucocorticoids. Of particular interest is the hippocampus, considered one of the most sensitive targets of stress-induced, inflammatory and GCS-mediated effects, whereas the prefrontal cortex exhibits pronounced but qualitatively distinct reactivity. Experimental data confirm that this regional heterogeneity is evident not only between the hippocampus and other brain structures, but also within the hippocampus itself. Thus, one study analyzed IL-1β, IL-6 and TNF expression in the dorsal and ventral hippocampus following injection of Dexamethasone, LPS and their combination. In the dorsal hippocampus, LPS caused a significant increase in TNF and trends toward increased IL-1β and IL-6, whereas Dexamethasone alone tended to increase IL-1β, and the Dex+LPS combination induced further changes in the cytokine profile. In the ventral hippocampus, only trends towards increased IL-1β (Dex+LPS) and TNF (Dex alone) were observed. These data indicate that even within a single anatomical structure, GCS effects can vary significantly.18
It has been shown that chronic stress or prior glucocorticoids exposure can enhance LPS-induced NF-κB signalling together with transcription of TNF-α, IL-1β and iNOS in the hippocampus and prefrontal cortex, whereas other structures, including the hypothalamus, show different, sometimes opposite, effects. Even a single Dexamethasone administration can induce pronounced region-specific changes in various brain regions, highlighting the heterogeneity of the cerebral response to GCS and the need to analyse both the general and regional neuroinflammatory profile.17,19
The experimental model of endotoxinaemia (administration of lipopolysaccharide-LPS) is widely used to reproduce a systemic inflammatory response involving the CNS. This model allows the investigation of molecular mechanisms regulating neuroinflammation under the influence of various pharmacological agents, including GCS.12,16,20,21 Studying the dual effects of glucocorticoids in a model of experimental endotoxinaemia is crucial for evaluating the risks and therapeutic benefits of their use in acute and chronic brain diseases.
Thus, the aim of the study was to investigate the effects of preventive administration of Dexamethasone and methylprednisolone on pro-inflammatory cytokines and the morphological state of the rat brain in an LPS-induced endotoxinaemia model.
Materials and Methods
Animals
Experiments were performed on 120 male Wistar rats weighing 250 ± 20 g, supplied by the Federal State Unitary Enterprise ‘RAPPOLOVO Laboratory Animal Breeding Centre’ (Leningrad Oblast, Russia). Rats were kept five per cage under controlled conditions: 22–23 °C, relative humidity 45–65 %, and a 12/12 h light–dark schedule. Pelleted feed and water were freely available. Only clinically healthy animals with no prior exposure to any drug entered the study. Handling and all subsequent procedures complied with the internal regulations of the Institute, with the Guide for the Care and Use of Laboratory Animals (US National Institutes of Health), and with national requirements (Order of the Ministry of Health of the Russian Federation No. 267 of 19 June 2003; Guidelines for the Use of Laboratory Animals, Moscow, 2005). The protocol received approval from the local ethics committee of the Institute of Experimental Medicine, which adheres to the NIH standards of animal care (Opinions No. 6/20 of 21 October 2020 and No. 4/25 of 25 December 2025).
Experimental design
- All animals received two intraperitoneal injections 2 h apart, irrespective of group allocation. The first injection (nominal time 0 h) contained a glucocorticoid or 0.9% NaCl; the second (2 h) contained LPS or 0.9% NaCl. The administration schedule by group is given in Table 1. The number of manipulations and the interval between injections were therefore identical across all groups.
- The 48 h time point was selected as the point at which acute systemic cytokinaemia has already resolved, and the 240 h time point as a delayed point allowing transient and persistent courses of the process to be distinguished. The dose of 2 mg/kg corresponds to the middle of the range applied in rodent models of endotoxaemia.
- At the end of the observation period animals were anaesthetised with Zoletil (tiletamine/zolazepam, Virbac, France) at 20 mg/kg intraperitoneally. Decapitation was performed after loss of pain sensitivity, verified by absence of response to tail pinch.
- At 48 h after treatment, five animals from each experimental group were euthanised by decapitation using a laboratory guillotine, after which the brains were rapidly removed. The same procedure was performed at day 10 for the remaining animals. The brain was rapidly removed, and the prefrontal cortex (PFC), hippocampus, and other regions selected for descriptive histological screening were identified using a stereotaxic atlas. Samples intended for molecular analysis were frozen and stored at -80°C.
- Experiment 1 evaluated histological evidence of neuronal injury and glial-associated morphological changes after LPS and/or glucocorticoid administration (Figure 1A).
- Experiment 2 quantified IL-1β, TNF-α, iNOS, and IBA-1 mRNA expression in the prefrontal cortex and hippocampus at 48 h and 10 days (Figure 1B).
Table 1: Experimental treatment regimen for each study group.
|
Group |
Treatment | Route of Administration | Dose | Number of Animals | Time points for sample collection |
|
Control |
0.9% sodium chloride solution |
Intraperitoneal, single dose |
1 ml |
5 |
48 hours |
| 5 |
10 days (240 hours) |
||||
|
LPS |
LPS | 1 mg/kg | 5 | 48 hours | |
| 5 |
10 days (240 hours) |
||||
|
Dex |
Dex | 2 mg/kg | 5 | 48 hours | |
|
5 |
10 days (240 hours) |
||||
| Dex+LPS |
Dex+LPS |
2 mg/kg +1 mg/kg |
5 |
48 hours |
|
| 5 |
10 days (240 hours) |
||||
|
MP |
Methypred |
2 mg/kg |
5 | 48 hours | |
| 5 |
10 days (240 hours) |
||||
|
MP +LPS |
MP +LPS | 2 mg/kg
+1 mg/kg |
5 | 48 hours | |
| 5 |
10 days (240 hours) |
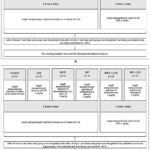 |
Figure 1: Experimental timeline and study design. (A) Histological assessment. (B) RT-qPCR assessment of inflammatory and microglial markers. Glucocorticoids were administered 2 h before LPS; tissues were collected at 48 h and 10 days. |
Histological examination
Brains were immersed in 10 % neutral buffered formalin and left to fix for 24 h, then dehydrated and infiltrated with paraffin by conventional histological procedure. Sections cut at 5–7 µm were mounted and stained with haematoxylin and eosin.22,23 Evaluation was performed on an Accu-Scope 3000 SERIES light microscope (USA) under 200× and 400× objectives. Micrographs were acquired with a TOUPCAM UCMOS05100KPA camera and processed in ToupView 3.7.7892 (Hangzhou ToupTek Photonics Co., Ltd., China).
The whole brain was initially screened to identify regions with reproducible morphological abnormalities. The hippocampus and prefrontal cortex were selected for detailed evaluation. For each animal, three paraffin sections at comparable anatomical levels were examined per region, with five non-overlapping fields evaluated per section. Multiple sections and fields from the same animal were treated as subsamples and were not considered independent observations. Findings were recorded as present or absent at the animal level.
The prespecified morphological features were acidophilic neuronal necrosis (neuronal shrinkage, nuclear pyknosis, intensely eosinophilic cytoplasm), chromatolysis, reduced neuronal cellularity, and altered composition of the glial cell population. Haematoxylin and eosin staining does not permit identification of glial cell phenotype; findings were therefore recorded as descriptive morphological features without inference regarding the reactive state of any particular cell type. Slides were coded and assessed by one observer blinded to group allocation. The histological analysis was exploratory and descriptive.
RNA extraction
Frozen tissue samples of 50–100 mg were processed with the ExtractRNA reagent (#BC032, Evrogen, Russia) following the phenol–chloroform procedure supplied by the manufacturer. Chloroform extraction was repeated twice; nucleic acid was then precipitated with isopropanol, rinsed twice in 70 % ethanol, dried in air, and taken up in 20 µL of RNase-free water (#W4502, Sigma). Yield and purity were checked on a NanoDrop 2000 spectrophotometer (Thermo Scientific, USA), with an A260/A280 ratio above 1.9 in every sample. Material was held at −80 °C pending reverse transcription.
Total RNA concentration was determined spectrophotometrically and sample concentrations were equalised accordingly; RNA integrity was assessed by electrophoresis in a 1% agarose gel. Reaction specificity was confirmed by melting curve analysis: a single peak corresponding to the specific product was observed in all cases. A no-template control was included on every plate.
Reverse transcription
Complementary DNA was synthesised from 2 µg of RNA per reaction with the Reverta kit (#SK022S, Evrogen, Russia), following the protocol supplied with the reagents. Products were kept at −20 °C until use.
Real-time PCR
Transcript abundance was quantified for two pro-inflammatory cytokines, interleukin-1β (IL-1β) and tumour necrosis factor α (TNFα), for inducible NO synthase (iNOS), and for IBA-1, the gene encoding the microglial marker IBA-1. Reaction conditions were optimised separately for each primer pair; sequences are listed in Table 2. Amplification was carried out on a Bio-Rad CFX96 Real-Time System (Bio-Rad Laboratories, USA) with qPCRmix-HS SYBR 5x (#PK147L, Evrogen, Russia). The programme comprised initial denaturation at 95 °C for 15 min, followed by 40 cycles of 95 °C for 15 s, X °C for 30 s and 72 °C for 5 s (annealing temperature X per primer pair, Table 2), and a melting curve recorded from 65 °C to 95 °C. Normalisation was performed against peptidylprolyl isomerase A (PPIA), selected on the basis of validation studies in which this gene showed stable expression in the rat prefrontal cortex and hippocampus and on its established use as an internal control in models of systemic LPS-induced inflammation . To verify that the results did not depend on the choice of normaliser, the data were additionally recalculated against 18S rRNA. Amplification efficiency was determined for each primer pair during assay optimization using serial dilutions of the template. Amplification efficiencies for all primer pairs were approximately 100% (range, 99–101%), indicating near-doubling of the amplicon amount during each amplification cycle.
The delta-delta CT method (ΔΔCt) was used to determine the fold change in gene expression relative to the control group. The results are given as bar charts. Each biological sample obtained from an individual animal was analysed in three technical RT-qPCR replicates. Technical replicates were averaged before statistical analysis, and the animal was treated as the experimental unit.
Table 2: Primers used for real-time PCR analysis
|
Name |
Primer sequences (5’ → 3’) |
Annealing temperature, °C (Х) |
|
PPIА* |
F: GATTTGGCTATAAGGGTTC R: GTTGTCCACAGTCGGAGA |
60 |
| IL-1β | F: CACCTCTCAAGCAGAGCACAG R: GGGTTCCATGGTGAAGTCAAC |
64 |
|
TNFα |
F: CCAGGTTCTCTTCAAGGGACAA R: CTCCTGGTATGAAATGGCAAATC |
64 |
| iNOS | F: CAGAAGCAGAATGTGACCATCAT
R: CGGAGGGACCAGCCAAATC |
58 |
|
IBA-1 |
F: GAAGCGAATGCTGGAGAAAC R: CCTCCAATTAGGGCAACTCA |
58 |
* – Peptidyl-prolyl isomerase A
Statistical analysis
Computations were carried out in Statistica 10 and GraphPad Prism 9, with the animal taken as the experimental unit. Molecular data are reported as mean ± SD alongside individual animal-level observations. Distribution was checked by the Shapiro-Wilk test. Within each brain region and time point, a two-way ANOVA was fitted with LPS exposure (absent/present) and glucocorticoid treatment (saline/dexamethasone/methylprednisolone) as factors, followed where appropriate by pairwise comparisons with Tukey adjustment. Main effects of LPS, main effects of treatment, and the LPS × treatment interaction are reported separately, each with its F statistic, degrees of freedom and p value. The threshold for significance was p < 0.05. Given the small number of animals per group, histological findings were handled as exploratory descriptive outcomes.
Results
LPS induces persistent morphological evidence of neuronal injury, whereas glucocorticoid preventive administration does not provide consistent morphological protection
According to the results of histological analysis of the rat brain tissue samples examined, the most pronounced changes were observed in the prefrontal cortex (PFC) and hippocampus (Table 3). In LPS-treated animals, microscopic nuclear morphological features consistent with microglial activation were detected; the nuclei of microglial cells changed shape, becoming more oval and rod-shaped in outline (Fig. 2 A, B). At the first time point (48 h), nuclear morphological features consistent with microglial activation were observed in 4 out of 5 rats. At later observation time points, specifically the second time point (10 days) following LPS administration, such features were detected in 3 out of 5 animals. Signs of microglial activation were also noted in other experimental groups – Dex+LPS and MP+LPS – with the described signs recorded in 2 out of 5 animals at both time points (Fig. 2 C, D). During histological examination of brain tissue samples from the animals, clear histological signs of acidophilic neuronal necrosis were identified. These changes were observed in various regions of the brain, such as the cortex, hippocampus and thalamus (Table 3). Neuronal morphological changes, such as pyknotic nuclei, swollen acidophilic cytoplasm and neuronal processes, were observed in animals in the LPS group at both time points upon analysis of sections of the prefrontal cortex and hippocampus (Fig. 2E).
Forty-eight hours after LPS administration, signs of acidophilic necrosis were observed in the cortical region in 3 out of 5 animals in the LPS group, whereas in the groups receiving GCs (Dex, MP) and the combined Dex+LPS and MP+LPS groups, the identified change was detected in 1–2 out of 5 rats. At the later time point (10 days after LPS administration), signs of acidophilic necrosis of neurons in the prefrontal cortex were noted in two males from the LPS group; in the treatment group, large foci of acidophilic necrosis were observed.
Pathological changes were more pronounced in the hippocampus. As early as 48 hours after treatment, characteristic pathological changes were observed in the LPS group (4 out of 5 animals), whilst administration of Dexamethasone was accompanied by the appearance of isolated foci of necrosis (1 out of 5 animals). In the Dex and MP groups, foci of necrosis were observed (2 out of 5 rats). By day 10, more pronounced necrotic changes, including large acidophilic necrosis (2 out of 5 rats), were detected in the Dex/ MP and Dex+LPS/ MP +LPS groups (Fig. 2 F). At the second time point of the experiment, acidophilic necrosis was detected in all animals (5 out of 5) in the LPS group.
Forty-eight hours after LPS administration, chromatolysis, a morphological change in neuronal nuclei in response to injury, was observed in animals that had received LPS alone (Fig. 2G). This change was observed in one male in the midbrain and thalamus, and in another in the midbrain and pons.
In a subset of animals, a marked decrease in cell density was observed in the prefrontal cortex and hippocampus, which was interpreted as reduced neuronal cellularity (Fig. 2H). Forty-eight hours after LPS administration, a reduction in cell density was recorded in the prefrontal cortex in three rats from the LPS group and in one male from the experimental groups Dex, Dex+LPS, MP, and MP+LPS. Long-term changes in the form of reduced neuronal cellularity in the prefrontal cortex were recorded in three animals that had been administered LPS; pathological changes in the other study groups were detected in one animal (Fig. 2 I).
During the acute phase, 48 hours after LPS administration, a reduction in cell density was observed in the hippocampus region in three males from the LPS group. At later observation time points, 10 days after LPS administration, it was found that reduced neuronal cellularity in the hippocampal region was detected in 4 out of 5 animals in the LPS group and in 1 out of 5 rats that had previously received GCs (Fig. 2 J), as well as in 2 out of 5 rats in the Dex and MP groups (Fig. 2 K). No microscopic changes were observed in the control group (Fig. 2 L). No overt leukocyte infiltration or morphological features suggestive of reactive astrogliosis were observed in hematoxylin- and eosin-stained sections.
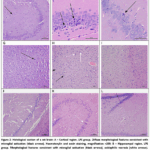 |
Figure 2: Histological section of a rat brain: A – Cortical region. LPS group. Diffuse morphological features consistent with microglial activation (black arrows). Haematoxylin and eosin staining, magnification ×200; |
Table 3: Summary results of histological examination of the brains of animals at post-mortem histological assessment at 48 hours and 10 days after LPS administration (number of animals in the group exhibiting this finding)
|
Changes identified |
Control | LPS | Dex | Dex+LPS | Меthypred | MP
+LPS |
||||||
| 48 h | 10 d | 48 h | 10 d | 48 h | 10 d | 48 h | 10 d | 48 h | 10 d | 48 h |
10 d |
|
|
♂/5 |
♂/5 | ♂/5 | ♂/5 | ♂/5 | ♂/5 | ♂/5 | ♂/5 | ♂/5 | ♂/5 | ♂/5 |
♂/5 |
|
|
Altered composition of the glial cell population |
– | – | 4 | 3 | – | – | 2 | 2 | – | – | 1 | 2 |
| Acidophilic necrosis, cortex | – | – | 3 | 2 | – | 1 | 1 | 1 | – | 1 | 1 |
1 |
|
Acidophilic necrosis, hippocampus |
– | – | 4 | 5 | 1 | 1 | 1 | 2 | 1 | 1 | 1 | 1 |
| Acidophilic necrosis, thalamus | – | – | – | 1 | – | – | – | – | – | – | – |
1 |
|
Chromatolysis |
– | – | 1А; 1Б | – | – | – | – | – | – | – | – | – |
| Neuronal loss, cortex | – | – | 3 | 3 | 1 | – | 1 | – | 1 | – | 1 |
– |
|
Neuronal loss, hippocampus |
– | – | 3 | 4 | – | 1 | 1 | 1 | 1 | – | 2 |
2 |
Notes:
A – midbrain and thalamus regions;
B – midbrain and pons regions.
Preventive GCs administration attenuated selected inflammatory mRNA responses at 48 h, but marker expression remained elevated at 240 h
Forty-eight hours after LPS administration, the effects of LPS exposure and glucocorticoid treatment on IL-1β, TNF-α, iNOS, and IBA-1 mRNA levels in the prefrontal cortex were assessed using two-way ANOVA. For IL-1β, a significant LPS × treatment interaction (F(2, 24) = 7.039, p = 0.0039) and a significant main effect of LPS (F(1, 24) = 26.01, p < 0.0001) were observed, whereas the main effect of treatment was not significant (F(2, 24) = 1.071, p = 0.3586). For TNF-α, the LPS × treatment interaction (F(2, 24) = 6.746, p = 0.0047) and the main effect of LPS (F(1, 24) = 62.72, p < 0.0001) were significant, whereas the main effect of treatment was not (F(2, 24) = 2.223, p = 0.1301). For iNOS, the LPS × treatment interaction was not significant (F(2, 24) = 0.685, p = 0.5138), while significant main effects of LPS (F(1, 24) = 27.93, p < 0.0001) and treatment (F(2, 24) = 4.002, p = 0.0316) were detected. For IBA-1, a significant LPS × treatment interaction (F(2, 24) = 7.126, p = 0.0037) and a significant main effect of LPS (F(1, 24) = 5.477, p = 0.0279) were observed, whereas the main effect of treatment was not significant (F(2, 24) = 0.077, p = 0.9263). At the 48-hour time point, intraperitoneal administration of LPS led to a 2.7-fold increase in IL-1β mRNA levels, a 2.1-fold increase in TNF-α, a 1.5-fold increase in iNOS, and a 2.1-fold increase in IBA-1 in the prefrontal cortex compared with the control group (p < 0.0001, p < 0.0001, p = 0.0167, and p = 0.0023, respectively).
Forty-eight hours after the start of the experiment, intraperitoneal LPS administration increased IL-1β mRNA levels 2.7-fold, TNF-α 2.1-fold, iNOS 1.5-fold and IBA-1 2.1-fold in the PFC relative to the control group (p < 0.0001, p < 0.0001, p = 0.0167 and p = 0.0023, respectively).
In the PFC, expression levels of the pro-inflammatory cytokines IL-1β and TNF-α, of inducible NO synthase (iNOS) and IBA-1 in the Dex and MP groups did not differ from control (p > 0.05, Tukey’s post hoc test). In the Dex+LPS group, IL-1β, iNOS and IBA-1 did not differ from the LPS group (p > 0.05, Tukey’s post hoc test), whereas TNF-α mRNA was 1.5-fold lower than in the LPS group (p = 0.0057, Tukey’s post hoc test). In the MP+LPS group, iNOS and IBA-1 did not differ from the LPS group (p > 0.05, Tukey’s post hoc test), whereas IL-1β mRNA expression was 1.5-fold lower than in the LPS group (p = 0.0436, Tukey’s post hoc test), indicating a partial reduction of pro-inflammatory markers in the PFC under preventive GCs administration at the early time point (Fig. 3A–D).
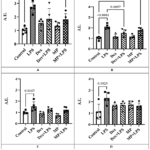 |
Figure 3: The mRNA level of IL-1β (А), TNF-α (В), iNOS (С), IBA-1 (D) in the rat prefrontal cortex 48 hours after administration of LPS. Click here to View Figure |
Forty-eight hours after LPS administration, the effects of LPS exposure and glucocorticoid treatment on IL-1β, TNF-α, iNOS, and IBA-1 mRNA levels in the hippocampus were assessed using two-way ANOVA. For IL-1β, significant effects were found for the LPS × treatment interaction (F(2, 24) = 4.927, p = 0.0161), LPS (F(1, 24) = 77.80, p < 0.0001), and treatment (F(2, 24) = 4.143, p = 0.0285). For TNF-α, the main effect of LPS was significant (F(1, 24) = 56.25, p < 0.0001), whereas neither the LPS × treatment interaction (F(2, 24) = 2.018, p = 0.1548) nor the main effect of treatment (F(2, 24) = 1.781, p = 0.1901) was significant. For iNOS, a significant LPS × treatment interaction (F(2, 24) = 4.205, p = 0.0272) and a significant main effect of LPS (F(1, 24) = 54.84, p < 0.0001) were observed, whereas the main effect of treatment was not significant (F(2, 24) = 0.362, p = 0.7004). For IBA-1, the LPS × treatment interaction (F(2, 24) = 7.837, p = 0.0036) and the main effect of LPS (F(1, 24) = 42.75, p < 0.0001) were significant, whereas the main effect of treatment was not (F(2, 24) = 2.671, p = 0.0964). LPS administration increased the expression of all four markers compared with the control group (Tukey-adjusted p < 0.05): IL-1β by 2.5-fold, TNF-α by 2.1-fold, iNOS by 2.1-fold, and IBA-1 by 3.0-fold.
In the hippocampus, LPS increased the mRNA expression of all four markers relative to control: IL-1β 2.5-fold, TNF-α 2.1-fold, iNOS 2.1-fold and IBA-1 3.0-fold (p < 0.0001, p = 0.0001, p < 0.0001 and p < 0.0001, respectively; Tukey’s post hoc test) (Fig. 4A–D).
Administration of GCs (Dex, MP) did not alter the mRNA expression of any of the markers examined; no differences from the control group were observed (p > 0.05, Tukey’s post hoc test).
In the Dex+LPS group, iNOS and TNF-α did not differ from the LPS group (p > 0.05, Tukey’s post hoc test), whereas IL-1β mRNA was 1.4-fold lower (p = 0.0133) and IBA-1 1.5-fold lower (p = 0.0416) than in the LPS group; at the same time, IL-1β remained 1.8-fold higher than in control (p = 0.0066) and iNOS 1.6-fold higher than in control (p = 0.0014, Tukey’s post hoc test). In the MP+LPS group, iNOS and TNF-α likewise did not differ from the LPS group (p > 0.05), whereas IL-1β mRNA was 1.4-fold lower (p = 0.0130) and IBA-1 1.7-fold lower (p = 0.0071) than in the LPS group; IL-1β remained 1.8-fold higher than in control (p = 0.0067) and iNOS 1.8-fold higher than in control (p = 0.0016, Tukey’s post hoc test) (Fig. 4A–D). Thus, at 48 h a partial reduction of pro-inflammatory markers relative to the LPS group was also observed in the hippocampus, specifically for IL-1β and IBA-1.
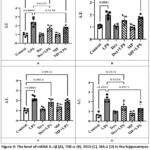 |
Figure 4: The level of mRNA IL-1β (А), TNF-α (В), iNOS (С), IBA-1 (D) in the hippocampus of rats 48 hours after administration of LPS. Click here to View Figure |
Marker expression remained elevated at 240 h in both regions despite preventive GCs administration
Ten days after LPS administration, the effects of LPS exposure and glucocorticoid treatment on IL-1β, TNF-α, iNOS, and IBA-1 mRNA levels in the prefrontal cortex were assessed using two-way ANOVA. For IL-1β, a significant LPS × treatment interaction (F(2, 24) = 5.866, p = 0.0084) and a significant main effect of LPS (F(1, 24) = 38.14, p < 0.0001) were observed, whereas the main effect of treatment was not significant (F(2, 24) = 2.321, p = 0.1198). For TNF-α, the main effect of LPS was significant (F(1, 24) = 33.35, p < 0.0001), whereas neither the LPS × treatment interaction (F(2, 24) = 2.336, p = 0.1183) nor the main effect of treatment (F(2, 24) = 0.029, p = 0.9712) was significant. For iNOS, a significant LPS × treatment interaction (F(2, 24) = 4.106, p = 0.0293) and a significant main effect of LPS (F(1, 24) = 27.19, p < 0.0001) were observed, whereas the main effect of treatment was not significant (F(2, 24) = 0.719, p = 0.4975). For IBA-1, the LPS × treatment interaction (F(2, 24) = 5.894, p = 0.0083) and the main effect of LPS (F(1, 24) = 13.28, p = 0.0013) were significant, whereas the main effect of treatment was not (F(2, 24) = 0.374, p = 0.6917).
Ten days after endotoxin administration, mRNA levels of IL-1β, TNF-α, iNOS and IBA-1in the PFC of the LPS group were 2.4-, 2.1-, 1.9- and 1.8-fold higher, respectively, than in the control group (p < 0.0001, p = 0.0004, p = 0.0002 and p = 0.0007, respectively; Tukey’s post hoc test) (Fig. 5A–D).
In the PFC, administration of GCs alone (Dex and MP groups) did not affect the expression of IL-1β, TNF-α, iNOS or IBA-1 (p > 0.05 versus control, Tukey’s post hoc test).
In the Dex+LPS group, no statistically significant differences from the LPS group were observed for any of the markers examined (p > 0.05, Tukey’s post hoc test); the pattern in the MP+LPS group was comparable, with a difference in mRNA expression only for IL-1β (p = 0.0160; Tukey’s post hoc test).
The increases in IL-1β, TNF-α and IBA-1were not prevented by dexamethasone: in the Dex+LPS group, IL-1β mRNA was 1.8-fold, TNF-α 1.9-fold and IBA-11.7-fold higher than in the control group (p = 0.0291, p = 0.0066 and p = 0.0216, respectively; Tukey’s post hoc test). In the MP+LPS group, TNF-α mRNA was 1.8-fold and IBA-11.6-fold higher than in control (p = 0.0089 and p = 0.0479, respectively; Tukey’s post hoc test), while not differing from the LPS or the glucocorticoid-only groups (p > 0.05, Tukey’s post hoc test).
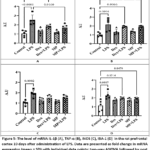 |
Figure 5: The level of mRNA IL-1β (А), TNF-α (В), iNOS (С), IBA-1 (D) in the rat prefrontal cortex 10 days after administration of LPS. Click here to View Figure |
Ten days after LPS administration, the effects of LPS exposure and glucocorticoid treatment on IL-1β, TNF-α, iNOS, and IBA-1 mRNA levels in the hippocampus were assessed using two-way ANOVA. For IL-1β, a significant LPS × treatment interaction (F(2, 24) = 7.802, p = 0.0025) and a significant main effect of LPS (F(1, 24) = 50.67, p < 0.0001) were observed, whereas the main effect of treatment was not significant (F(2, 24) = 1.314, p = 0.2875). For TNF-α, significant effects were found for the LPS × treatment interaction (F(2, 24) = 7.982, p = 0.0022), LPS (F(1, 24) = 40.68, p < 0.0001), and treatment (F(2, 24) = 4.565, p = 0.0209). For iNOS, the main effect of LPS was significant (F(1, 24) = 47.95, p < 0.0001), whereas neither the LPS × treatment interaction (F(2, 24) = 2.382, p = 0.1139) nor the main effect of treatment (F(2, 24) = 0.060, p = 0.9422) was significant. For IBA-1, the main effect of LPS was significant (F(1, 24) = 18.50, p = 0.0002), whereas neither the LPS × treatment interaction (F(2, 24) = 1.957, p = 0.1632) nor the main effect of treatment (F(2, 24) = 1.117, p = 0.3436) was significant. In the LPS group, hippocampal IL-1β, TNF-α, iNOS, and IBA-1 mRNA levels were 2.1-, 1.9-, 2.1-, and 2.1-fold higher, respectively, than those in the control group (p < 0.0001, p < 0.0001, p < 0.0001, and p = 0.0053, respectively; Tukey’s post-hoc test).
In the hippocampus, mRNA levels of IL-1β, TNF-α, iNOS and IBA-1in the LPS group were 2.1-, 1.9-, 2.1- and 2.1-fold higher, respectively, than in the control group (p < 0.0001, p < 0.0001, p < 0.0001 and p = 0.0053, respectively; Tukey’s post hoc test). At day 10, administration of glucocorticoids alone did not significantly alter hippocampal expression of IL-1β, iNOS or IBA-1relative to control (p > 0.05; Tukey’s post hoc test) (Fig. 6 A–D).
In the Dex+LPS group, no statistically significant differences from the LPS group were observed for any marker (p > 0.05, Tukey’s post hoc test); the same applied to the MP+LPS group for all markers (p > 0.05, Tukey’s post hoc test).
The increases in IL-1β, TNF-α, iNOS and IBA-1 were not prevented by dexamethasone: in the Dex+LPS group, IL-1β mRNA was 1.5-fold, TNF-α 1.9-fold, iNOS 1.8-fold and IBA-11.6-fold higher than in control (p < 0.0001, p < 0.0001, p = 0.0027 and p = 0.0314, respectively; Tukey’s post hoc test). In the MP+LPS group, IL-1β mRNA was 1.5-fold, TNF-α 1.5-fold and iNOS 1.7-fold higher than in control (p < 0.0001, p = 0.0002 and p = 0.0025, respectively; Tukey’s post hoc test). The result obtained at 48 h therefore does not predict the state of the tissue at the delayed time point: at 240 h the expression of the markers examined remained elevated.
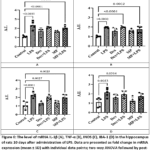 |
Figure 6: The level of mRNA IL-1β (А), TNF-α (В), iNOS (С), IBA-1 (D) in the hippocampus of rats 10 days after administration of LPS. Click here to View Figure |
Discussion
The aim of this study was to determine the effect of preventive administration of dexamethasone and methylprednisolone on neuroinflammatory markers and brain tissue morphology in experimental endotoxaemia. The choice of observation time points and doses was governed by the need to temporally separate the peripheral and central components of the response to LPS and to select a GCs regimen comparable to the anti-inflammatory doses used experimentally and clinically. The peripheral and central components of the response to intraperitoneal LPS follow different kinetics: in rats, serum TNF-α and IL-1β rise by 30 min, remain elevated up to 6 h and decline thereafter,24 whereas in mice serum TNF-α returns to baseline by 9 h while brain TNF-α remains elevated for months;25 sickness behaviour resolves within the first 24 h.26 Accordingly, the 48 h time point was selected as the point at which acute systemic cytokinaemia and sickness behaviour have already resolved: changes recorded at this time cannot be attributed to the direct action of the circulating cytokine pool and reflect the central arm of the response proper. The 240 h (10 days) time point was selected as a delayed point allowing transient and persistent courses of neuroinflammation to be distinguished; comparable intervals (7 days) have been used in studies demonstrating the persistence of behavioural and cytokine changes in rats after a single LPS injection.27 Critically, assessing GCs efficacy at an early time point alone systematically overestimates it: the anti-inflammatory action of GCs is maximal within the first hours to days, whereas the question of whether they interrupt the development of neuroinflammation or merely delay it can be resolved only if a delayed time point is included.
Inflammation was modelled by intraperitoneal LPS at 1 mg/kg, a dose in the lower part of the range used to model neuroinflammation in rats (1–5 mg/kg24,27), which reproduces the systemic inflammatory response and central changes with low mortality – a prerequisite for observation up to 240 h. The drug dose of 2 mg/kg lies in the middle of the range applied in rodent models of endotoxaemia and LPS-induced neuroinflammation, from 0.1 mg/kg in low-dose regimens to 5 mg/kg for preventive dexamethasone administration.28 Converted to a human equivalent dose on a body-surface-area basis (factor 6.2 for the rat29), it corresponds to ≈0.32 mg/kg, i.e. ≈22 mg for a 70 kg human. For dexamethasone this is a high anti-inflammatory dose, comparable to that used for cerebral oedema; for methylprednisolone it is moderate. The 2 h interval between GCs and LPS administration was chosen as sufficient for the genomic effects of glucocorticoid receptor activation to be realised by the time the endotoxin is delivered. Both drugs are regarded here as representatives of the class, and the conclusions are formulated with respect to preventive GCs administration in general.
The first experiment yielded morphological data on the brains of the experimental animals. In the LPS group, foci of acidophilic neuronal necrosis were detected – nuclear pyknosis, intensely eosinophilic cytoplasm and reduced cellularity – occurring more frequently in the hippocampus than in the prefrontal cortex. This picture is consistent with the known vulnerability of the hippocampus to peripheral inflammatory stimuli.30-32 No signs of leukocyte infiltration were found, in line with the view that in LPS models the resident glial response and soluble mediators predominate over massive migration of peripheral immune cells.32-33 The observed increase in the proportion of cells with oval and rod-shaped nuclei is described as a change in glial cell composition. Haematoxylin and eosin staining does not permit identification of microglia or their discrimination from other glial populations; this observation is therefore reported descriptively and is not used as an argument regarding the functional state of microglia, which would require an immunohistochemical study. In the groups receiving GCs alone, morphological changes were minimal, consistent with evidence that a single GCs administration in the absence of an immune stimulus does not induce a pronounced neurodegenerative process but acts predominantly in a modulatory manner, altering the threshold of microglial reactivity to subsequent injury.34-36 Importantly, foci of acidophilic necrosis persisted in the Dex+LPS and MP+LPS groups: preventive GCs administration did not prevent the development of necrotic neuronal changes.
The data from the second experiment complemented the observations described above. At 48 h, preventively administered GCs restricted only individual components of the inflammatory response, selectively depending on the marker and the brain region. By 240 h this partial restriction was no longer maintained: mRNA levels of IL-1β, TNF-α, iNOS and IBA-1 remained elevated relative to control. Thus, the result obtained at an early time point does not predict the state of the tissue at a delayed one, which refines the current understanding of the efficacy of preventive GCs administration. These findings converge with those of Shishkina et al.,10 in which preventive dexamethasone administration did not alter the expression of inflammatory response genes in the hippocampus at a delayed time point, and are consistent with data on the prolonging effect of prior glucocorticoid exposure on the neuroinflammatory response.37
The result obtained cannot be explained solely by insufficient anti-inflammatory action. The view of GCs as universal suppressors of inflammatory transcription has been substantially revised: glucocorticoid receptor activation operates not only through transrepression of NF-κB but also through transactivation, and a proportion of the genes thereby induced are pro-inflammatory.38 The most direct evidence has been obtained for the inflammasome: glucocorticoids increase NLRP3 mRNA and protein expression and thereby sensitise innate immune cells, enhancing the subsequent release of mature IL-1β, TNF-α and IL-6 in response to a second signal.38 In the hippocampus, exogenous GCs induce NLRP3 mRNA and shift microglia towards a state of heightened readiness to respond to pro-inflammatory stimuli.12 Munhoz et al.38 showed that corticosterone dose-dependently enhances LPS-induced NF-κB activation and the expression of iNOS, IL-1β and TNF-α in the frontal cortex and hippocampus of rats, while simultaneously reducing the expression of anti-inflammatory genes (IL-1ra, IL-10, MKP-1); the effect was glucocorticoid receptor-mediated (abolished by mifepristone) and region-dependent, being absent in the hypothalamus and heart. The same group had previously demonstrated comparable enhancement under chronic unpredictable stress, mediated by endogenous GCs secretion.39 It should also be borne in mind that the direction of the GCs effect depends on whether glucocorticoid exposure precedes the immune stimulus or coincides with it. Frank et al.39 showed that prior GC exposure sensitises both the central and the peripheral response to LPS. Kelly et al.35 established that prior corticosterone administration not only enhances but also prolongs the neuroinflammatory response to LPS, with the sensitising potential persisting for 30 days after corticosterone withdrawal. This reclassifies the observed persistence of marker expression at 240 h from “incomplete suppression” to an outcome to be expected under this administration regimen.
The selectivity of GCs action observed in the present work is also reproduced in models employing local LPS administration: glucocorticoid receptor activation by dexamethasone suppressed the expression of some inflammatory genes in the rat hippocampus but did not prevent microglial changes, while dexamethasone alone elicited a weak pro-inflammatory response in hippocampal tissue.40 The data cited above were obtained predominantly under chronic or repeated corticosterone exposure or with local LPS administration, whereas the present study employed a single systemic administration of synthetic GCs 2 h before the endotoxin; an analogous design has not been described in the literature, and direct transfer of the mechanism is therefore not warranted.
In addition to differences between time points, the present study revealed region specificity of the response: more pronounced changes in the hippocampus for individual markers (IL-1β, IBA-1) are consistent with the reported sensitivity of this structure to endotoxin-induced inflammation.29,30,41 A possible explanation lies in the high density of glucocorticoid and mineralocorticoid receptors in the hippocampus and in the dependence of the corticosteroid signal on the MR/GR balance, local glucocorticoid metabolism and transcriptional co-regulators, in particular FKBP5.5,42,43 A comparison across regions, markers and time points is presented as a heat map (Fig. 7), provided to illustrate the regional distribution of the response.
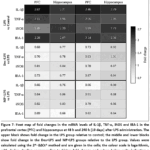 |
Figure 7: Heat map of fold changes in the mRNA levels of IL-1β, TNF-α, iNOS and IBA-1 in the prefrontal cortex (PFC) and hippocampus at 48 h and 240 h (10 days) after LPS administration. |
The present findings extend the literature in three respects. First, a divergence between the functional and tissue levels of the response is demonstrated within a single cohort of animals: partial behavioural recovery under preventive GCs administration44 coexisted with persistence at 240 h of elevated IL-1β, TNF-α, iNOS and IBA-1 expression and of foci of acidophilic neuronal necrosis in the prefrontal cortex and hippocampus; since behavioural changes in endotoxaemia are centrally mediated,26 both datasets characterise the same arm of the response at different levels of description. Second, inclusion of the delayed 240 h time point shows that the early restriction of neuroinflammation is not maintained, whereas most studies of preventive GCs administration in LPS models are confined to early time points, when the anti-inflammatory effect is maximal. Third, the available evidence on the sensitising action of prior glucocorticoid exposure derives predominantly from chronic or repeated corticosterone administration; the present work shows that a directionally comparable outcome is also observed after a single systemic administration of synthetic GCs.
Limitations
This study has several limitations that should be taken into account when interpreting the results. First, the number of animals was small (n = 5 per group at each time point). This group size limits the statistical power available for detecting small or moderate effects, increases the influence of individual variability, and precludes formal statistical analysis of the histological material; for this reason the histological findings are reported throughout as exploratory and descriptive outcomes rather than as confirmatory evidence.
Second, the design was restricted to a single dose of each glucocorticoid (2 mg/kg) given at a single time point (2 h before LPS). Neither dose–response nor timing–response relationships were examined, and the findings therefore cannot be extrapolated to other doses, routes or schedules of administration, and in particular to repeated or course administration, which is the regimen most frequently employed in clinical practice.
Third, the doses of dexamethasone and methylprednisolone used here are not equipotent. Consequently, the two drugs were deliberately not compared with each other, and the present data do not allow any conclusion as to which of the two compounds is more or less effective; a comparative assessment would require a separate study built on equipotent dosing.
Fourth, brain tissue was sampled at only two time points, 48 h and 240 h. The trajectory of the neuroinflammatory response between these points, and its further course beyond 240 h, therefore remain undetermined, and the duration of the persistent changes reported here cannot be established from the present dataset.
Fifth, only adult male Wistar rats were used. Possible sex differences in glucocorticoid receptor signalling and in the neuroinflammatory response were therefore not addressed, and the results obtained cannot be generalised to females without direct verification.
Finally, the molecular analysis was limited to transcript abundance of four markers (IL-1β, TNF-α, iNOS and IBA-1) together with conventional haematoxylin and eosin histology. Protein-level confirmation, cell-type-resolved analysis such as immunohistochemical assessment of microglial and astrocytic markers, and direct evaluation of glucocorticoid receptor signalling were not performed. The priming-like shift in reactivity proposed in the Discussion is therefore an interpretation consistent with the observed data rather than a mechanism demonstrated directly in this work. Studies with larger cohorts, several dose levels and administration schedules, both sexes, and complementary protein and cell-specific readouts are needed to address these points.
Conclusion
Preventive administration of dexamethasone and methylprednisolone at 2 mg/kg 2 h before LPS restricted only individual components of the neuroinflammatory response, and only at the early time point: by 240 h, mRNA levels of IL-1β, TNF-α, iNOS and IBA-1 in the prefrontal cortex and hippocampus remained elevated relative to control, while histologically foci of acidophilic neuronal necrosis persisted, being more pronounced in the hippocampus. Consequently, assessment of GCs efficacy at an early time point does not predict the state of brain tissue at a delayed one, and preventive administration does not provide sustained control of neuroinflammation. The preventive GCs regimen used in this experiment corresponds to the clinical situation in which a glucocorticoid is administered systemically as a component of therapy for peripheral inflammation while nervous tissue is not involved in the inflammatory process; taken together, the data presented show that under these conditions nervous tissue does not remain intact and are consistent with the concept of a sensitising action of prior glucocorticoid exposure, which substantiates the need to assess delayed central outcomes with course and repeated GCs administration, as well as to seek combined and targeted anti-inflammatory strategies.
Acknowledgment
The authors would like to thank Peter the Great St. Petersburg Polytechnic University and the Institute of Experimental Medicine, St. Petersburg, Russia, for providing the facilities and institutional support necessary to conduct this study. The authors are also grateful to the staff of the Neurochemistry Laboratory, Department of Physiology, Institute of Experimental Medicine, for their assistance with the experimental work.
Funding Sources
The author(s) received no financial support for the research, authorship, and/or publication of this article.
Conflict of Interest
The authors do not have any conflict of interest.
Data Availability Statement
The datasets used and/or analyzed during the current study are available from the corresponding author on reasonable request.
Ethics Statement
All experiments were performed in accordance with institutional guidelines and the National Institutes of Health (NIH) Guide for the Care and Use of Laboratory Animals as well as national laws (Ministry of Health of Russian Federation N267, June 19, 2003; Guide for the Use of Laboratory Animals, Moscow, 2005) and permission of the Local ethical committee for this research Federal State Budgetary Scientific Institution “Institute of Experimental Medicine” of St. Petersburg № 6/20 от 21.10.2020, № 4/25 от 25.12.2025.
Informed Consent Statement
This study did not involve human participants, and therefore, informed consent was not required.
Clinical Trial Registration
This research does not involve any clinical trials.
Permission to reproduce material from other sources
Not Applicable
Author Contributions
- Lebedeva Elena: Methodology, validation, investigation, writing—original draft.
- Kukushkina Ekaterina: Conceptualization, methodology, writing – review and editing.
- Maystrenko Vicktoria: Investigation, writing – review and editing.
- Cherkassova Regina: Writing – review and editing.
- Karpenko Marina: Writing – review and editing, supervision, funding acquisition, conceptualization.
References
- Hu W, Zhang Y, Wu W, et al. Chronic glucocorticoid exposure enhances neurodegeneration in the frontal cortex and hippocampus via NLRP-1 inflammasome activation in male mice. Brain Behav Immun. 2016;52:58-70. doi:10.1016/j.bbi.2015.09.019
CrossRef - Zhang W, Xiao D, Mao Q, Xia H. Role of neuroinflammation in neurodegeneration development. Signal Transduct Target Ther. 2023;8(1):267. doi:10.1038/s41392-023-01486-5
CrossRef - Schweingruber N, Reichardt SD, Lühder F, Reichardt HM. Mechanisms of glucocorticoids in the control of neuroinflammation. J Neuroendocrinol. 2012;24(1):174-182. doi:10.1111/j.1365-2826.2011.02161.x
CrossRef - Nadeau S, Rivest S. Glucocorticoids play a fundamental role in protecting the brain during the innate immune response. J Neurosci. 2003;23(13):5536-5544. doi:10.1523/JNEUROSCI.23-13-05536.2003
CrossRef - Bolshakov AP, Tret’yakova LV, Kvichansky AA, Gulyaeva NV. Glucocorticoids: Dr. Jekyll and Mr. Hyde of hippocampal neuroinflammation. Biochemistry (Mosc). 2021;86(2):156-167. doi:10.1134/S0006297921020048
CrossRef - Tischner D, Reichardt HM. Glucocorticoids in the control of neuroinflammation. Mol Cell Endocrinol. 2007;275(1-2):62-70. doi:10.1016/j.mce.2007.03.007
CrossRef - Gomes JA, Stevens RD, Lewin JJ, Mirski MA, Bhardwaj A. Glucocorticoid therapy in neurologic critical care. Crit Care Med. 2005;33(6):1214-1224. doi:10.1097/01.CCM.0000166389.85273.38
CrossRef - Soltani A, Chugaeva UY, Ramadan MF, et al. A narrative review of the effects of dexamethasone on traumatic brain injury in clinical and animal studies: Focusing on inflammation. Inflammopharmacology. 2023;31(6):2955-2971. doi:10.1007/s10787-023-01361-3
CrossRef - Kim MS, Kim YH, Kim MS, Kwon B, Cho HR. Efficacy and safety of early anti-inflammatory drug therapy for secondary injury in traumatic brain injury. World Neurosurg. 2023;172:e646-e654. doi:10.1016/j.wneu.2023.01.110
CrossRef - Shishkina GT, Kalinina TS, Lanshakov DA, et al. Genes involved by dexamethasone in prevention of long-term memory impairment caused by lipopolysaccharide-induced neuroinflammation. Biomedicines. 2023;11(10):2595. doi:10.3390/biomedicines11102595
CrossRef - Kalra S, Malik R, Singh G, et al. Pathogenesis and management of traumatic brain injury (TBI): Role of neuroinflammation and anti-inflammatory drugs. Inflammopharmacology. 2022;30(4):1153-1166. doi:10.1007/s10787-022-01017-8
CrossRef - Frank MG, Hershman SA, Weber MD, Watkins LR, Maier SF. Chronic exposure to exogenous glucocorticoids primes microglia to pro-inflammatory stimuli and induces NLRP3 mRNA in the hippocampus. Psychoneuroendocrinology. 2014;40:191-200. doi:10.1016/j.psyneuen.2013.11.006
CrossRef - Dinkel K, MacPherson A, Sapolsky RM. Novel glucocorticoid effects on acute inflammation in the CNS. J Neurochem. 2003;84(4):705-716. doi:10.1046/j.1471-4159.2003.01604.x
CrossRef - de Almeida Duque E, Munhoz CD. The pro-inflammatory effects of glucocorticoids in the brain. Front Endocrinol (Lausanne). 2016;7:78. doi:10.3389/fendo.2016.00078
CrossRef - Sorrells SF, Sapolsky RM. An inflammatory review of glucocorticoid actions in the CNS. Brain Behav Immun. 2007;21(3):259-272. doi:10.1016/j.bbi.2006.11.006
CrossRef - Frank MG, Weber MD, Watkins LR, Maier SF. Stress-induced neuroinflammatory priming: A liability factor in the etiology of psychiatric disorders. Neurobiol Stress. 2016;4:62-70. doi:10.1016/j.ynstr.2015.12.004
CrossRef - Komoltsev IG, Gulyaeva NV. Brain trauma, glucocorticoids and neuroinflammation: Dangerous liaisons for the hippocampus. Biomedicines. 2022;10(5):1139. doi:10.3390/biomedicines10051139
CrossRef - Tret’yakova LV, Kvichansky AA, Bolshakov AP, Gulyaeva NV. Dexamethasone modulates lipopolysaccharide-induced expression of proinflammatory cytokines in rat hippocampus. Neurochem J. 2021;15(3):302-307. doi:10.1134/S1819712421330011
CrossRef - Tiutiunnik TV, Obukhova DA, Vilnikova VA, Muruzheva ZM, Karpenko MN. Single intraperitoneal injection of dexamethasone alters region-specific neurotransmitter metabolism in the rat brain. Neurochem Res. 2026;51(2):98. doi:10.1007/s11064-026-04718-6
CrossRef - Munhoz CD, Sorrells SF, Caso JR, Scavone C, Sapolsky RM. Glucocorticoids exacerbate lipopolysaccharide-induced signaling in the frontal cortex and hippocampus in a dose-dependent manner. J Neurosci. 2010;30(41):13690-13698. doi:10.1523/JNEUROSCI.0303-09.2010
CrossRef - Maystrenko V, Ivleva I, Karpenko M. Changes in activity of μ- and m-calpains and signs of neuroinflammation in the hippocampus and striatum of rats after single intraperitoneal injection of a subseptic dose of endotoxin. Metab Brain Dis. 2021;36(7):1917-1928. doi:10.1007/s11011-021-00755-y
CrossRef - Carson FL, Cappellano CH. Histotechnology: A Self-Instructional Text. 4th ed. ASCP Press; 2015.
- Suvarna SK, Layton C, Bancroft JD, eds. Bancroft’s Theory and Practice of Histological Techniques. 8th ed. Elsevier; 2019.
- Fu HQ, Yang T, Xiao W, et al. Prolonged neuroinflammation after lipopolysaccharide exposure in aged rats. PLoS One. 2014;9(8):e106331. doi:10.1371/journal.pone.0106331
CrossRef - Qin L, Wu X, Block ML, et al. Systemic LPS causes chronic neuroinflammation and progressive neurodegeneration. Glia. 2007;55(5):453-462. doi:10.1002/glia.20467
CrossRef - Dantzer R, O’Connor JC, Freund GG, Johnson RW, Kelley KW. From inflammation to sickness and depression: When the immune system subjugates the brain. Nat Rev Neurosci. 2008;9(1):46-56. doi:10.1038/nrn2297
CrossRef - Bossù P, Cutuli D, Palladino I, et al. A single intraperitoneal injection of endotoxin in rats induces long-lasting modifications in behavior and brain protein levels of TNF-α and IL-18. J Neuroinflammation. 2012;9:101. doi:10.1186/1742-2094-9-101
CrossRef - Nair AB, Jacob S. A simple practice guide for dose conversion between animals and human. J Basic Clin Pharm. 2016;7(2):27-31. doi:10.4103/0976-0105.177703
CrossRef - Zhao J, Bi W, Xiao S, et al. Neuroinflammation induced by lipopolysaccharide causes cognitive impairment in mice. Sci Rep. 2019;9(1):5790. doi:10.1038/s41598-019-42286-8
CrossRef - Batista CRA, Gomes GF, Candelario-Jalil E, Fiebich BL, de Oliveira ACP. Lipopolysaccharide-induced neuroinflammation as a bridge to understand neurodegeneration. Int J Mol Sci. 2019;20(9):2293. doi:10.3390/ijms20092293
CrossRef - Skrzypczak-Wiercioch A, Sałat K. Lipopolysaccharide-induced model of neuroinflammation: Mechanisms of action, research application and future directions for its use. Molecules. 2022;27(17):5481. doi:10.3390/molecules27175481
CrossRef - Geloso MC, Corvino V, Marchese E, Serrano A, Michetti F. Crosstalk between peripheral inflammation and brain: Focus on the responses of neuroglia. Neural Regen Res. 2024;19(11):2405-2412. doi:10.4103/NRR.NRR-D-24-00339
- Sorrells SF, Munhoz CD, Manley NC, Yen S, Sapolsky RM. Glucocorticoids increase excitotoxic injury and inflammation in the hippocampus of adult male rats. Neuroendocrinology. 2014;100(2-3):129-140. doi:10.1159/000367849
CrossRef - Barrientos RM, Thompson VM, Kitt MM, et al. Greater glucocorticoid receptor activation in the hippocampus of aged rats sensitizes microglia. Neurobiol Aging. 2015;36(3):1483-1495. doi:10.1016/j.neurobiolaging.2014.12.003
CrossRef - Kelly KA, Michalovicz LT, Miller JV, Castranova V, Miller DB, O’Callaghan JP. Prior exposure to corticosterone markedly enhances and prolongs the neuroinflammatory response to systemic challenge with LPS. PLoS One. 2018;13(1):e0190546. doi:10.1371/journal.pone.0190546
CrossRef - Cain DW, Cidlowski JA. Immune regulation by glucocorticoids. Nat Rev Immunol. 2017;17(4):233-247. doi:10.1038/nri.2017.1
CrossRef - Busillo JM, Azzam KM, Cidlowski JA. Glucocorticoids sensitize the innate immune system through regulation of the NLRP3 inflammasome. J Biol Chem. 2011;286(44):38703-38713. doi:10.1074/jbc.M111.275370
CrossRef - Munhoz CD, Lepsch LB, Kawamoto EM, et al. Chronic unpredictable stress exacerbates lipopolysaccharide-induced activation of nuclear factor-κB in the frontal cortex and hippocampus via glucocorticoid secretion. J Neurosci. 2006;26(14):3813-3820. doi:10.1523/JNEUROSCI.4398-05.2006
CrossRef - Frank MG, Miguel ZD, Watkins LR, Maier SF. Prior exposure to glucocorticoids sensitizes the neuroinflammatory and peripheral inflammatory responses to E. coli lipopolysaccharide. Brain Behav Immun. 2010;24(1):19-30. doi:10.1016/j.bbi.2009.07.008
CrossRef - Tret’yakova LV, Kvichansky AA, Barkovskaya ES, Manolova AO, Bolshakov AP, Gulyaeva NV. Ambiguous contribution of glucocorticosteroids to acute neuroinflammation in the hippocampus of rat. Int J Mol Sci. 2023;24(13):11147. doi:10.3390/ijms241311147
CrossRef - Brown GC. The endotoxin hypothesis of neurodegeneration. J Neuroinflammation. 2019;16(1):180. doi:10.1186/s12974-019-1564-7
CrossRef - Koning ASCAM, Buurstede JC, van Weert LTCM, Meijer OC. Glucocorticoid and mineralocorticoid receptors in the brain: A transcriptional perspective. J Endocr Soc. 2019;3(10):1917-1930. doi:10.1210/js.2019-00158
CrossRef - Binder EB. The role of FKBP5, a co-chaperone of the glucocorticoid receptor, in the pathogenesis and therapy of affective and anxiety disorders. Psychoneuroendocrinology. 2009;34(suppl 1):S186-S195. doi:10.1016/j.psyneuen.2009.05.021
CrossRef - Lebedeva EY, Kukushkina ES, Tyutunnik TV, Maystrenko VA. Glucocorticosteroid-induced behavioral changes in endotoxemia in rats. Medical Academic Journal. 2025;25(1):82-89. doi:10.17816/MAJ631323
CrossRef
Abbreviations
CNS – central nervous system,
DEX – dexamethasone,
GCS/GCs – glucocorticoids,
GR – glucocorticoid receptor,
IBA1 – ionized calcium-binding adaptor molecule 1,
IL-1β – interleukin-1 beta,
iNOS – inducible nitric oxide synthase,
LPS – lipopolysaccharide,
MP – methylprednisolone,
MR – mineralocorticoid receptor,
mRNA – messenger RNA,
PFC – prefrontal cortex,
RT-qPCR – quantitative reverse-transcription polymerase chain reaction,
TNF-α – tumor necrosis factor alpha

Accepted on: 16-09-2026
Second Review by: Dr. Ananya Naha
Final Approval by: Dr. Anton Kiselev