A Multi-Scale Feature Fusion Approach with Attention for Robust Ovarian Tumor Diagnosis
 , Vidit Kumar and Bhaskar Pant
Department of Computer Science and Engineering, Graphic Era Deemed to University, Dehradun, India
Corresponding Author E-mail: ankitanainwal1424@gmail.com
Download this article as:
ABSTRACT:Ovarian cancer ranks high among diagnosed cancers in women across the globe. Early identification plays a key role, since timely intervention often shapes outcomes more than late-stage efforts. Because of this, screening strategies continue evolving under clinical pressure. Tools like MRI, CT scans, and ultrasound help visualize abnormalities - each bringing distinct advantages to diagnosis. Within this space, our work focuses on improving how ultrasound data classifies tumors, applying deep learning models to refine accuracy beyond traditional interpretation. Looking at how four well-known deep learning models - VGG16, ResNet50, EfficientNet, and DenseNet201 - performed on the MMOTU dataset was where this work began. ResNet50 stood out due to its stable outcomes, leading later efforts to center around it. With an aim to boost its ability to interpret data, a component called the Multi-Scale Feature Enhancement Block (MSFEB) was integrated; this helped uncover more nuanced patterns across images. The MSFEB block consists of three parallel branches: two branches employ stacked 3×3 convolutional layers to capture fine and intermediate texture details, while the third branch uses a 5×5 convolution to model broader contextual information. The features from all branches are fused and followed by a Global Average Pooling (GAP) layer to generate compact and discriminative representations. Separately, we evaluated the Convolutional Block Attention Module (CBAM), which further enhanced the network by focusing on salient regions. Finally, MSFEB was fused with CBAM, and the combined architecture achieved the highest classification accuracy of 76.55% and a top-2 accuracy of 86.99%, confirming its robustness for ovarian cancer classification.
KEYWORDS:A Computer-Aided Design (CAD); Convolutional Block Attention Module (CBAM); Convolutional Neural Network (CNN); Computed Tomography (CT); Magnetic Resonance Imaging (MRIs); Multi-Scale Feature Enhancement Block (MSFEB)
Introduction
A growing concern in women’s health today, ovarian cancer presents as an abnormal proliferation of cells or tissues within one or both ovaries. Considering that it ranks fourth among the causes of cancer-related mortality among women, increasing survival rates requires early detection and diagnosis.¹ According to a study,² ovarian cancer ranks as a significant contributor to cancer-related mortality in Indian women, accounting for 3.34% of deaths (24,015) in the year 2018. In 2020, there were more than 0.3 million ovarian cancer cases recorded worldwide, with about 0.2 million deaths attributed to the disease. The incidence of ovarian cancer is rapidly escalating, with projections estimating a global annual incidence of 0.4 million cases by the year 2035.³ However, ovarian cancer presents unique challenges distinct from other malignancies. Unlike cancers affecting other anatomical sites, there is a lack of standardized screening tools for ovarian cancer, and the documentation of premalignant lesions is notably deficient. Furthermore, the etiology of this disease remains largely unknown.³
The foremost challenge in managing ovarian cancer lies in its detection. Approximately 47% of individuals diagnosed with this condition survive for five years post-diagnosis. Notably, the 5-year survival rate for patients diagnosed at distant stages stands at 29%; however, this rate varies considerably based on several factors, such as disease stage, extent of residual tumor post-surgery, histotype, and racial or ethnic background.⁴ Given its critical significance, the detection of ovarian cancer encompasses both imaging techniques and serum markers. Among these, CA125 emerges as the predominant biochemical marker used for disease detection.⁵ Diagnostic imaging techniques such as CT, MRI, and ultrasound are essential. These modalities include radiomics feature analysis to assist with the diagnosis and prognosis of the condition.⁶ Predictive accuracy is often increased by combining biomarkers with visual evaluation.
Traditional machine learning methods struggle to capture natural data effectively for processing. Often, such approaches rely on manually extractable features and patterns that domain experts can understand and present within the data fed into the model. At the same time, deep learning models have transformed this paradigm by allowing learning directly from raw, unprocessed data, extracting insights, and performing categorization or detection without the need for features to be explicitly understood by humans. Instead, multiple layers of the models are trained automatically to retrieve the required information.⁷ Such a change in model behavior has proven highly effective in addressing challenging scenarios, as it enables the discovery of complex structures in high-dimensional data.
Deep learning approaches help improve performance by enhancing feature representation and detecting anomalies.⁸ The study focuses on the categorization of ovarian cancer utilizing ultrasound imaging and advanced deep learning algorithms. To begin, we compared the performance of several well-established architectures, including ResNet50, EfficientNet, VGG16, and DenseNet201, to determine the most effective baseline model. ResNet50 demonstrated superior performance and was therefore selected for further improvement. To improve its discriminative capacity, we integrated the Convolutional Block Attention Module (CBAM) into ResNet50’s different convolutional stages (conv3_x, conv4_x, and conv5_x). Building on this, we developed an upgraded architectural block aimed at increasing the model’s feature extraction capability. Finally, we enhanced our approach by combining the Multi-Scale Feature Extraction Block (MSFEB) with CBAM, resulting in robust and reliable classification of ovarian cancer subtypes from ultrasound images.
This study makes several contributions:
- A comparative evaluation of various state-of-the-art Convolutional Neural Network (CNN) architectures (VGG16, EfficientNet-B0, EfficientNet-B1, EfficientNet-B2, DenseNet121, and ResNet50) on an ovarian cancer ultrasound dataset was carried out to provide a solid baseline.
- A Multi-Scale Feature Extraction Block (MSFEB) was designed and integrated into a best performing back-bone network i.e. Resnet50 specifically into its Conv3x, Conv4x, and Conv5x stages to better represent features along multiple layers.
- The Convolutional Block Attention Module (CBAM) was employed into the same Conv3x, Conv4x, and Conv5x stages in a subsequent study to further enhance the representation of features through channel-wise and spatial attention.
- Finally, a combination of the MSFEB and the CBAM in a single model provided substantial improvements on the baseline models and alternative models with only attention.
Material and Methods
Related Works
For the classification of tumors using ultrasound images, a study used the fusion of machine learning algorithms and image processing techniques.9 In their method, the wavelet transform was employed for preprocessing and image noise removal. The gray-level co-occurrence matrix (GLCM) was then used for feature extraction. The Relief-F algorithm was applied to select features, thereby improving classification accuracy. This research can be extended by investigating other machine learning classification algorithms to further enhance analysis and performance evaluation.
Ultrasound images were used to segment ovarian tumors and cysts in a study.10 A neural network was employed for image segmentation to identify cysts, after which a watershed transform was applied to delineate the boundaries. This method enabled the counting of cysts within the image. The proposed model could be compared with a CNN-based approach to further improve the methodology. Additionally, a classification method for ovarian tumor identification was presented in another study,11 which included a performance comparison using nonlinear features and a fuzzy forest ensemble classifier. Initially, features were extracted using the Relief-F algorithm, followed by classification. The study compared various classifiers, including KNN, random forest, FRNN, and fuzzy forest, on both fuzzy and non-fuzzy feature sets. The fuzzy forest classifier demonstrated superior performance compared to the other approaches considered. However, it is worth noting that the Region of Interest (ROI) in each image was manually marked by radiologists and gynecologists, indicating a potential area for automation and improvement in future studies.
In their study, the authors evaluated the performance of VGGNet, DenseNet, ResNet, and GoogleNet for diagnosing ovarian tumors using ultrasound images.12 GoogleNet-Scratch emerged as the top-performing model, followed closely by DenseNet-Scratch. The research could be further extended to include the analysis of CT and MRI images for more comprehensive evaluation. On the other hand, another study leveraged ultrasound images for the segmentation of ovarian follicles and ovaries using CNN-based models, namely the Fully Connected Residual Network (FCRN) and U-Net.13 Their study included a comparison of FCRN and U-Net across five different types of ultrasound data, ranging from B-mode images to raw BRF data. Both binary classification techniques and multiclass approaches were employed in this methodology. The results demonstrated the value of using both B-mode and BRF data to capture spatial context within the ovary, with BRF as an input image yielding the best performance. Although two different architectures were used, their performances were not significantly different.
The authors in a study, 14 used a Viola–Jones model to differentiate breast and ovarian cancer images obtained via ultrasonography. Their method applied the Viola–Jones model for image segmentation, while wavelet and Wiener filters were combined for the detection of the Region of Interest (ROI). The efficacy of the classification model was measured using an SVM classifier, with Local Binary Patterns (LBP) features being utilized as a measure of correctness. One of the key achievements of this work was the development of Otsu’s thresholding algorithm and Otsu’s thresholding with an active contour method, which led to a higher classification accuracy for the system. Although exploring other machine learning classifiers could increase the breadth and generalizability of the work, it would be informative in future studies to further enhance specificity toward challenges that may arise during real-world implementation. Similarly, a study, 15 aimed to enhance ovarian cancer diagnosis by denoising ultrasound images and improving image quality. Their method involved acquiring ultrasound images, computing skewness and kurtosis, and analyzing histograms to extract features. Next, SVM was employed for classification, while Local Binary Patterns (LBP) and Histogram of Oriented Gradients (HOG) were used for feature extraction. Based on a comparative investigation, the model incorporating HOG achieved the highest accuracy. However, it is important to note that this model performed poorly on images containing multiple texture patterns within the same image.
Ten CNN models were used in a study, 16 to classify ovarian tumors in ultrasound images. Initially, randomized flipping was applied for data augmentation. Ten CNNs were then implemented, including ShuffleNet, Xception, ResNet-50, ResNet-18, ResNet-101, DenseNet-201, Darknet-19, Darknet-53, and Inception-v3. From the three best-performing models, three distinct ensembles were constructed. After evaluating the performance of the various ensembles, ResNet was found to achieve good accuracy and specificity, while DenseNet-201 exhibited better sensitivity. Among these ensembles, Ensemble 3 achieved the highest accuracy. In another study, 17 Histogram of Oriented Gradients (HOG) features and an artificial neural network (ANN) classifier were used to distinguish ovarian tumors from ultrasound images. HOG was utilized to extract features, which were then fed into the ANN classifier to determine whether an image belonged to a malignant or benign class. The analysis yielded better results compared with conventional methods. Therefore, this research could be further improved by exploring approaches that minimize information loss during model execution and application.
The researchers in a study, 18 created a validated deep learning model based on pelvic ultrasound imaging and clinical data (age and CA-125 level) to differentiate malignant and benign ovarian tumors. The study also found that ResNet50 achieved an AUC of 0.84 when using only pelvic ultrasound images, while DenseNet121 achieved an AUC of 0.82 on the same task. Nevertheless, it was observed that the inclusion of segmented solid portion images along with clinical data increased the AUC for both ResNet50 and DenseNet121. The study concluded that diagnostic performance significantly improved through the integration of imaging and clinical data. Another study, 19 presented a robust binary classifier for separating benign and malignant ovarian tumors from ultrasound images. The paper leveraged a pre-trained CNN, which proved to be highly effective for image classification. Although this method enhanced the robustness of the classifiers, it also demonstrated how deep learning techniques can be effectively applied in medical diagnostics. Therefore, this exploratory analysis suggests several directions for future research, including improving model performance, using larger and more diverse datasets, incorporating multimodal data, developing real-time applications, and exploring additional tumor types.
A hybrid model, 20, that enhances medical image classification by fusing residual blocks, CBAM, and Capsule Networks (CapsNet). Although CapsNet performs well with little data and is good at maintaining spatial associations, its propensity to retain excessive detail usually increases network complexity and parameter count. The authors addressed this by using residual blocks in place of conventional convolutional layers, which allowed for more thorough feature extraction without running into issues with vanishing gradients. Additionally, by highlighting important spatial and channel-specific information, CBAM reduced computational cost and enhanced feature selection. With notable improvements in classification accuracy, the hybrid design performed better than the original on brain tumor MRI and OCT datasets. Despite these developments, problems with CapsNet’s intrinsic data storage and the requirement for deeper architectures still exist. To identify the early detection of brain tumors from MRI scans, especially lower-grade gliomas, a deep learning framework was put forth.21 The method focused on discriminative regions in MRI images and improved feature extraction by combining the Convolutional Block Attention Module (CBAM) with a pre-trained ResNet-50 architecture. Using segmented tumor masks, the architecture was applied to MRI data from 110 patients. It showed excellent tumor identification accuracy, highlighting its capability to improve early detection, diagnosis, and treatment. Additional research may be necessary to address issues like computational demand, model generalizability across tumor subtypes, and dataset size. Future plans involve investigating multimodal imaging, expanding the framework to larger and more varied datasets, and enabling integration with clinical decision support systems. In a study, 22, the CBAM was integrated into MobileNetV2, resulting in the MobileNetV2-CBAM architecture, a lightweight model for breast cancer detection using ultrasound images. A combined ultrasound image dataset was utilized to train and validate the model, and Grad-CAM was used to improve interpretability for medical professionals by offering visual explanations. The suggested MobileNetV2-CBAM outperformed the baseline MobileNetV2 by 11%, achieving a superior test accuracy of 93% when compared to more complex networks like VGG16, VGG19, InceptionV3, and ResNet50.
A computer-aided diagnosis (CAD) technique involving ultrasound images, as an auxiliary diagnostic method for classifying ovarian tumors, was proposed in a study.23 The images consisted of 3D ultrasound data, from which new images were generated by extracting features using higher-order spectra and texture descriptors. The objective of the proposed technique was to classify tumors as either benign or malignant. The accuracy of the classification approach depends on the quality of the features used to distinguish between different classes. Therefore, in future research, the inclusion of additional texture features may lead to improved performance. Furthermore, to achieve a more thorough analysis and further improvement, future studies may compare various machine learning techniques.
Both conventional deep learning techniques as well as machine learning have shown encouraging outcome in the classification of ovarian tumors in earlier research. However, typical drawbacks like limited generalizability, reliance on manual ROI selection, and small datasets still exist. Building on these discoveries, the current study investigates multi-branch feature fusion and attention mechanisms to increase the accuracy and reliability of ovarian cancer diagnosis from ultrasound imaging.
Methodology
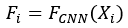
The overall framework of the proposed approach is illustrated in Figure 1. Let the training dataset be denoted as X = {X₁, X₂, …, Xₙ}, where n represents total number of training images and each image Xi, Xᵢ ∈ ℝCˣᴴˣᵂ has C channels and spatial resolution HxW. Each image Xᵢ, is first processed by the ResNet50 backbone up to an intermediate convolutional layer L, and the corresponding feature representation is obtained as:

where FCNN (.) denotes the truncated ResNet50 mapping with parameters θres.
The extracted feature map Fᵢ is then forwarded to two complementary modules: the attention module 24 and the proposed Multi-Scale Feature Extraction Block (MSFEB). In the attention path, CBAM sequentially applies channel and spatial attention to emphasize informative responses, yielding.

where MC(.) and Ms(.) represent the channel and spatial attention maps, respectively, and ⊙ denotes elementwise multiplication. The refined feature is subsequently aggregated by Global Average Pooling (GAP).
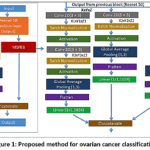 |
Figure 1: Proposed method for ovarian cancer classification Click here to View Figure |
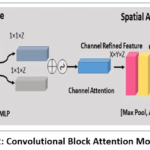 |
Figure 2: Convolutional Block Attention Module. Click here to View Figure |

In parallel, the proposed MSFEB is applied to Fi to capture multi-scale information. It consists of three branches consisting of convolutional operations with kernels of sizes 3×3 and 5×5 and average pooling, respectively and expressed as: –
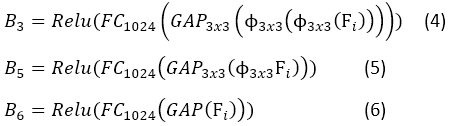
Φk×k represents a convolution with kernel size k×k. Their outputs are concatenated, producing

Finally, the outputs from the two modules are concatenated to form a joint descriptor,

, which is passed through a fully connected layer followed by softmax activation for classification:

where Wc, bc are classifier parameters, and ŷi ∈ RK is the predicted probability distribution across k ovarian cancer classes.
The cross entropy loss is calculated as:

where B is the batch size and K is the number of classes.
The mathematical formulation presented above directly corresponds to the stages of the proposed methodology illustrated in Fig. 1. Equation one defines the extraction of intermediate feature maps from the ResNet50 backbone. Equations two-seven describe the parallel enhancement of these features through attention refinement and multi-scale feature extraction, respectively. Equation eight formalizes the fusion of attention-guided and multi-scale representations, while Equations nine and ten define the classification and optimization objectives. Algorithm 1 summarizes how these operations are sequentially executed during training to learn discriminative representations from ovarian ultrasound images.
The overall training procedure of our proposed methodology is depicted in Algorithm 1.
Algorithm 1:
Training procedure of proposed method.
Input: Training dataset X= {X1,X2,X3……Xn}, proposed model Fmodel(.), Learning rate Lr, max epoch Max_ep and batch size B.
Output: Optimized Fmodel(.)
- Initialize the backbone CNN weights with ImageNet pretrained weights.
- Randomly initialized CBAM, MSFB classifiers.
For epoch =1 to Max_ep
- for each mini batch {x,y} of size B sampled from X,
- Extract intermediate features from Backbone,
- Apply CBAM to Fi using equation two
- Apply MSFEB using equation
- Fuse Fimp and F att as equation eight
- Pass to classifier and compute loss using equation ten.
- Using back propagation optimized Fmodel (.) by using loss L.
Results
Dataset
For the investigation, ultrasound images were used.25 The Multi-Modality Ovarian Tumor Ultrasound (MMOTU) dataset contains 1,469 2D ultrasound images. The dataset includes eight different ovarian categories: chocolate cyst, mucinous cystadenoma, high-grade serous, teratoma, theca cell tumor, simple cyst, and normal ovaries.
There are different categories of ovarian cysts, and the 2D ultrasound images are presented in table 1. Table 1 provides a detailed overview of ultrasonography images depicting various types of ovarian cancers. To showcase the diversity in ultrasound imaging, these tumors are divided into eight groups within the table based on their different appearances. Each category is accompanied by corresponding ultrasound images, which facilitate visual analysis and comparison The dataset includes clinically distinct ovarian conditions commonly observed in ultrasound imaging. Simple cysts appear as well-defined anechoic lesions, while chocolate cysts (endometriomas) show homogeneous low-level internal echoes due to hemorrhagic content. Serous and mucinous cystadenomas are benign epithelial tumors, typically presenting as thin-walled or multilocular cystic masses, respectively, as commonly described in gynecologic ultrasound literature.²⁶ Teratomas exhibit complex echogenic patterns caused by fat and calcifications, whereas theca cell tumors often appear as solid or mixed echogenic lesions. Normal ovaries show regular follicular morphology without abnormal masses. In contrast, high-grade serous carcinoma presents as an irregular solid or solid–cystic mass with malignant ultrasound features, which is characteristic of aggressive epithelial ovarian cancer. ²⁷
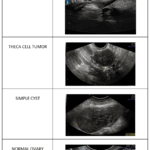 |
Table 1: The Multi-Modality Ovarian Tumor Ultrasound (MMOTU) Click here to View Table |
Implementation detail and Evaluation Parameters
The model went through 100 training epochs, utilizing the Adam optimizer with a starting learning rate of 0.0001. This rate was set to decrease by half every 20 epochs. The batch size is set to 32. We used cross-entropy loss as our objective function, and to gauge the model’s performance, we looked at training and validation loss, accuracy, and top-2 accuracy throughout the epochs. A number of performance evaluation metrics, like, accuracy, recall, precision and F1 Score, have been examined to assess the model’s performance.
The number of accurate forecasts divided by the total number of predictions is known as accuracy. It is recognized as the model’s overall accuracy.

Precision quantifies the percentage of the model’s positive forecasts that come true.

Recall quantifies the model’s accuracy in locating each relevant positive event inside the dataset.

Recall and precision are given equal weight in the F1-score. Finding a balance between the two is helpful, particularly when dealing with datasets that are unbalanced or when optimising one statistic is easier than the other.

Results
The result section provides a detailed analysis of the experimentation results.
Analysis of different CNN Model
Tables 2 and 3 summarize the overall and class-wise performance of different CNN models for ovarian cancer classification. In terms of overall accuracy, ResNet-50 achieved the best performance (76.12%), while VGG-16 delivered the highest top-2 accuracy (87.63%). The EfficientNet variants provided competitive results, with B0 showing a balanced trade-off and B2 reaching strong top-2 accuracy. Class-wise analysis further revealed that ResNet-50 and EfficientNet models maintained relatively consistent performance across multiple categories, with high F1-scores for classes 0, 2, and 5, while VGG-16 and DenseNet-121 showed more fluctuations, particularly for classes 3, 4, and 7. These findings indicate that residual connections in ResNet and the scalable design of EfficientNet enable more robust feature learning, whereas VGG-16 retains strength in top-2 predictions. Considering both overall accuracy and class-level stability, ResNet-50 was selected for further study in our framework.
Table 2: Analysis of different CNN Models
|
Method |
Normal Accuracy | Top 2% Accuracy |
| VGG 16 | 73.13 |
87.63 |
|
ResNet 50 |
76.12 | 86.11 |
| DenseNet121 | 73.13 |
84.43 |
|
Efficient B0 |
75.69 | 86.57 |
| Efficient B1 | 73.35 |
85.50 |
|
Efficient B2 |
74.84 |
87.21 |
Table 3: Class wise performance details of different CNN models
|
Layers |
Class | Precision | Recall | F1 Score | Accuracy |
| VGG 16 | 0 | 0.83 | 0.84 | 0.83 |
73.13 |
|
1 |
0.66 | 0.71 | 0.69 | ||
| 2 | 0.78 | 0.79 |
0.78 |
||
|
3 |
0.55 | 0.55 | 0.55 | ||
| 4 | 0.71 | 0.53 |
0.61 |
||
|
5 |
0.74 | 0.77 | 0.75 | ||
| 6 | 0.60 | 0.55 |
0.57 |
||
|
7 |
0.58 | 0.47 |
0.52 |
||
|
ResNet 50 |
0 |
0.80 | 0.85 | 0.82 | 76.12 |
| 1 | 0.70 | 0.70 |
0.70 |
||
|
2 |
0.81 | 0.85 | 0.83 | ||
|
3 |
0.71 | 0.55 |
0.62 |
||
| 4 | 0.73 | 0.58 |
0.65 |
||
|
5 |
0.75 | 0.80 | 0.78 | ||
| 6 | 0.71 | 0.61 |
0.66 |
||
|
7 |
0.64 | 0.47 |
0.54 |
||
|
Dense |
0 |
0.81 | 0.83 | 0.82 | 73.13 |
| 1 | 0.68 | 0.73 |
0.70 |
||
|
2 |
0.75 | 0.86 | 0.80 | ||
| 3 | 0.79 | 0.48 |
0.60 |
||
| 4 | 0.67 | 0.32 |
0.43 |
||
|
5 |
0.74 | 0.77 | 0.76 | ||
| 6 | 0.68 | 0.58 |
0.62 |
||
|
7 |
0.44 | 0.47 | 0.45 | ||
| EfficientNet B0 | 0 | 0.84 | 0.82 |
0.83 |
75.69 |
|
1 |
0.72 | 0.74 | 0.73 | ||
| 2 | 0.89 | 0.79 |
0.83 |
||
|
3 |
0.77 | 0.55 | 0.64 | ||
| 4 | 0.53 | 0.53 |
0.53 |
||
|
5 |
0.69 | 0.83 | 0.75 | ||
| 6 | 0.60 | 0.73 |
0.66 |
||
|
7 |
0.62 | 0.53 | 0.57 | ||
| EfficientNet B1 | 0 | 0.79 | 0.83 |
0.81 |
73.35 |
|
1 |
0.62 | 0.79 | 0.69 | ||
| 2 | 0.85 | 0.83 |
0.84 |
||
|
3 |
0.81 | 0.42 | 0.55 | ||
| 4 | 0.59 | 0.53 |
0.56 |
||
|
5 |
0.72 | 0.71 | 0.72 | ||
| 6 | 0.59 | 0.58 |
0.58 |
||
|
7 |
0.54 | 0.47 | 0.50 | ||
|
EfficientNet B2 |
0 | 0.77 | 0.87 |
0.82 |
74.84 |
|
1 |
0.65 | 0.77 | 0.71 | ||
| 2 | 0.93 | 0.76 |
0.84 |
||
|
3 |
0.69 | 0.58 | 0.63 | ||
| 4 | 0.60 | 0.47 |
0.53 |
||
|
5 |
0.75 | 0.78 | 0.76 | ||
| 6 | 0.58 | 0.64 |
0.61 |
||
|
7 |
0.60 | 0.40 |
0.48 |
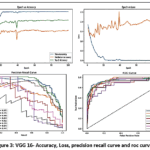 |
Figure 3: VGG 16- Accuracy, Loss, precision recall curve and roc curve. Click here to View Figure |
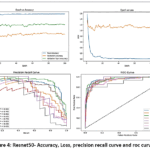 |
Figure 4: Resnet50- Accuracy, Loss, precision recall curve and roc curve. Click here to View Figure |
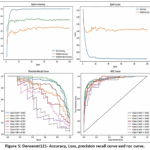 |
Figure 5: Densenet121- Accuracy, Loss, precision recall curve and roc curve. Click here to View Figure |
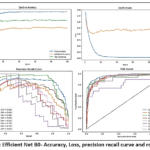 |
Figure 6: Efficient Net B0- Accuracy, Loss, precision recall curve and roc curve. Click here to View Figure |
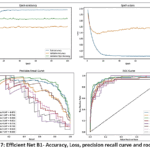 |
Figure 7: Efficient Net B1- Accuracy, Loss, precision recall curve and roc curve. Click here to View Figure |
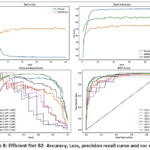 |
Figure 8: Efficient Net B2- Accuracy, Loss, precision recall curve and roc curve. Click here to View Figure |
The learning curves of all evaluated models demonstrate stable convergence and effective feature learning across training and validation sets. VGG16 (Figure 3) exhibits consistent performance, while ResNet-50 (Figure 4) converges rapidly with balanced class-wise precision and recall. DenseNet-121 (Figure 5) maintains stable generalization, and EfficientNet variants B0–B2 (Figure. 6, 7 and 8) achieve smooth loss reduction and strong class-wise discrimination. Collectively, all models provide reliable multi-class separability with minimal overfitting, with ResNet-50 emerging as the most balanced and robust architecture for further analysis.
Analysis of Attention Module(CBAM)
The integration of CBAM into different layers of ResNet50 in table 4 reveals a progressive improvement in classification performance. When applied at Conv3X, the model achieves 64.39% accuracy, which increases substantially to 73.35% at Conv4X and further to 76.33% at Conv5X. A similar trend is observed in Top-2 accuracy, rising from 79.96% to 89.55%, highlighting that deeper feature representations combined with attention mechanisms enable more effective capture of discriminative patterns in the data.
Table 4: Analysis of Attention Module (CBAM)
|
Layers |
Normal Accuracy | Top 2% Accuracy |
| Conv 3X (512*28*28) | 64.39 |
79.96 |
|
Conv 4X (1024*14*14) |
73.35 | 85.07 |
| Conv 5X (2048*7*7) | 76.33 |
86.20 |
Table 5: Class wise analysis of Attention Module (CBAM)
|
Layers |
Class | Precision | Recall | F1 Score | Accuracy |
| Conv_5x | 0 | 0.81 | 0.85 |
0.83 |
76.33 |
|
1 |
0.72 | 0.79 | 0.75 | ||
| 2 | 0.83 | 0.83 |
0.83 |
||
|
3 |
0.76 | 0.52 | 0.62 | ||
| 4 | 0.53 | 0.42 |
0.47 |
||
|
5 |
0.71 | 0.80 | 0.76 | ||
| 6 | 0.69 | 0.67 |
0.68 |
||
|
7 |
0.88 | 0.47 | 0.61 | ||
| Conv_4x | 0 | 0.82 | 0.84 |
0.83 |
73.35 |
|
1 |
0.74 | 0.73 | 0.73 | ||
| 2 | 0.82 | 0.82 |
0.82 |
||
|
3 |
0.59 | 0.42 | 0.49 | ||
| 4 | 0.52 | 0.63 |
0.57 |
||
|
5 |
0.74 | 0.68 | 0.71 | ||
| 6 | 0.61 | 0.70 |
0.65 |
||
|
7 |
0.40 | 0.53 | 0.46 | ||
| Conv_3x | 0 | 0.73 | 0.82 |
0.77 |
64.39 |
|
1 |
0.52 | 0.85 | 0.65 | ||
| 2 | 0.68 | 0.78 |
0.72 |
||
|
3 |
0.00 | 0.00 | 0.00 | ||
| 4 | 0.00 | 0.00 |
0.00 |
||
|
5 |
0.63 | 0.76 | 0.69 | ||
| 6 | 0.55 | 0.18 |
0.27 |
||
|
7 |
0.00 | 0.00 |
0.00 |
The class-wise evaluation of CBAM across different layers of ResNet50 highlights that deeper layers capture more discriminative features with improved consistency across classes. At Conv_3x, performance is limited, with some classes (3, 4, and 7) showing near-zero recognition, leading to an overall accuracy of 64.39%. Introducing CBAM at Conv_4x enhances balance, particularly for classes 0, 1, and 2, improving accuracy to 73.35%. The best results are observed at Conv_5x, where most classes achieve higher precision, recall, and F1-scores, leading to a peak overall accuracy of 76.33%, underscoring the effectiveness of attention mechanisms in deeper feature representations.
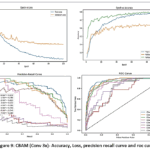 |
Figure 9: CBAM (Conv 3x)- Accuracy, Loss, precision recall curve and roc curve. Click here to View Figure |
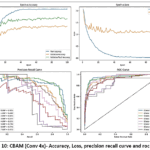 |
Figure 10: CBAM (Conv 4x)- Accuracy, Loss, precision recall curve and roc curve. Click here to View Figure |
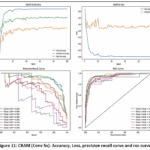 |
Figure 11: CBAM (Conv 5x)- Accuracy, Loss, precision recall curve and roc curve. Click here to View Figure |
The performance analysis of CBAM in conv 3x, conv 4x, conv 5x layers of ResNet50 is demonstrated in figure 9, 10 and 11 respectively. The model achieves stable convergence, as reflected in the accuracy–loss curves with steadily increasing accuracy and decreasing validation loss. The precision–recall trends highlight that the attention mechanism improves separability for most classes, although minority classes remain comparatively challenging. Furthermore, the ROC curves exhibit high AUC values (typically >0.80), confirming that CBAM enhances the network’s ability to focus on salient features, thereby improving both discriminative power and classification reliability.
Analysis of MSFEB Block
The integration of the MSFEB block into ResNet50 depicted in table 6, results in a stable enhancement of performance across different layers. Accuracy increases from 72.28% at Conv3X to 74.41% at Conv4X, with Conv5X sustaining a comparable level of 74.20%. Unlike CBAM, which shows sharper gains in deeper stages, the MSFEB block provides more uniform improvements, indicating its role in stabilizing feature extraction while ensuring consistent classification reliability.
Table 6: Analysis of MSFEB Block
|
Layers |
Normal Accuracy |
Top 2% Accuracy |
|
Conv 3X (512*28*28) |
72.28 | 85.10 |
| Conv 4X (1024*14*14) | 74.41 |
86.02 |
|
Conv 5X (2048*7*7) |
74.20 |
86.20 |
Table 7: Class wise analysis of MSFEB Block
|
Layers |
Class | Precision | Recall | F1 Score | Accuracy |
| Conv_5x | 0 | 0.80 | 0.85 |
0.82 |
74.20 |
|
1 |
0.68 | 0.71 | 0.70 | ||
| 2 | 0.82 | 0.82 |
0.82 |
||
|
3 |
0.71 | 0.48 | 0.58 | ||
| 4 | 0.76 | 0.68 |
0.72 |
||
|
5 |
0.68 | 0.77 | 0.72 | ||
| 6 | 0.57 | 0.52 |
0.54 |
||
|
7 |
0.86 | 0.40 | 0.55 | ||
| Conv_4x | 0 | 0.83 | 0.87 |
0.85 |
74.41 |
|
1 |
0.63 | 0.79 | 0.70 | ||
| 2 | 0.78 | 0.82 |
0.80 |
||
|
3 |
0.83 | 0.48 | 0.61 | ||
| 4 | 0.83 | 0.53 |
0.65 |
||
|
5 |
0.70 | 0.72 | 0.71 | ||
| 6 | 0.61 | 0.52 |
0.56 |
||
|
7 |
0.88 | 0.47 |
0.61 |
||
| Conv_3x |
0 |
0.80 | 0.85 | 0.83 | 72.28 |
| 1 | 0.63 | 0.80 |
0.71 |
||
|
2 |
0.87 | 0.76 | 0.81 | ||
| 3 | 0.85 | 0.55 |
0.67 |
||
|
4 |
0.60 | 0.32 | 0.41 | ||
| 5 | 0.60 | 0.78 |
0.68 |
||
|
6 |
0.58 | 0.42 | 0.49 | ||
| 7 | 0.71 | 0.33 |
0.45 |
The class-wise evaluation of the MSFEB block in ResNet50 in table 7 indicates balanced performance across layers, with accuracies ranging from 72.28% (Conv3X) to 74.41% (Conv4X). At Conv3X, the model effectively identifies dominant classes such as 0, 1, and 2, though minority classes like 4 and 7 remain challenging. Conv4X shows the most consistent performance, achieving strong precision and recall for classes 0, 2, and 5, which drives the highest overall accuracy. Conv5X maintains comparable results, with moderate improvements for classes 4 and 5 but weaker recall for class 7. Overall, the MSFEB block contributes to stable feature learning and ensures reliable classification across most categories.
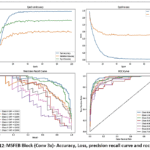 |
Figure 12: MSFEB Block (Conv 3x)- Accuracy, Loss, precision recall curve and roc curve. Click here to View Figure |
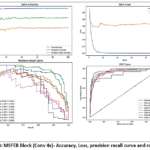 |
Figure 13: MSFEB Block (Conv 4x)- Accuracy, Loss, precision recall curve and roc curve. Click here to View Figure |
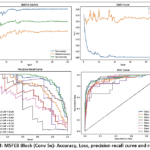 |
Figure 14: MSFEB Block (Conv 5x)- Accuracy, Loss, precision recall curve and roc curve. Click here to View Figure |
The performance trends of the MSFEB block across Conv3X, Conv4X, and Conv5X in figure 12, 13 and 14, illustrate consistent and stable learning. The accuracy–loss curves confirm smooth convergence with minimal overfitting, while the precision–recall plots highlight reliable detection of dominant classes, though minority classes remain relatively harder to distinguish. The ROC curves across all three layers exhibit strong separability, with AUC values generally above 0.80, demonstrating that the MSFEB block enhances discriminative ability while maintaining robustness across layers.
Analysis of Combined Module
Table 8 presents the performance analysis of the combined module integrating both the MSFEB and the CBAM attention mechanism. The Conv 3×3 (512×28×28) configuration achieved an accuracy of 72.28% with a top-2 accuracy of 85.71%, while the Conv 4×4 (1024×14×14) achieved higher scores, highlighting the complementary strengths of different convolutional scales. By fusing the MSFEB with CBAM, the model effectively leverages both local spatial details and channel-wise attention, resulting in enhanced feature representation. This fusion allows the network to capture richer global and contextual information, improving classification robustness for complex ovarian cancer patterns.
Table 8: Analysis of Combined Module
|
Layers |
Normal Accuracy | Top 2% Accuracy |
| Conv 3X (512*28*28) | 72.28 |
85.71 |
|
Conv 4X (1024*14*14) |
75.05 | 86.14 |
| Conv 5X (2048*7*7) | 76.55 |
86.99 |
Table 9: Class wise analysis of Combined Module
|
Layers |
Class | Precision | Recall | F1 Score | Accuracy | |
| Conv_5x | 0 | 0.81 | 0.91 | 0.86 |
76.55 |
|
| 1 | 0.66 | 0.67 |
0.66 |
|||
|
2 |
0.83 | 0.85 | 0.84 | |||
| 3 | 0.66 | 0.68 |
0.67 |
|||
|
4 |
0.65 | 0.68 | 0.67 | |||
| 5 | 0.83 | 0.77 |
0.80 |
|||
|
6 |
0.57 | 0.48 | 0.52 | |||
|
7 |
0.86 | 0.40 | 0.55 | |||
| Conv_4x | 0 | 0.86 | 0.85 |
0.86 |
75.05 |
|
|
1 |
0.67 | 0.71 | 0.69 | |||
| 2 | 0.78 | 0.86 |
0.82 |
|||
|
3 |
0.70 | 0.45 | 0.55 | |||
| 4 | 0.75 | 0.47 |
0.58 |
|||
|
5 |
0.72 | 0.82 | 0.77 | |||
| 6 | 0.59 | 0.48 |
0.53 |
|||
|
7 |
0.62 | 0.53 |
0.57 |
|||
| Conv_3x |
0 |
0.81 | 0.80 | 0.81 | 72.28 | |
| 1 | 0.72 | 0.77 |
0.74 |
|||
|
2 |
0.77 | 0.76 | 0.76 | |||
| 3 | 0.68 | 0.42 |
0.52 |
|||
|
4 |
0.45 | 0.53 | 0.49 | |||
| 5 | 0.72 | 0.76 |
0.74 |
|||
|
6 |
0.56 | 0.61 | 0.58 | |||
| 7 | 0.64 | 0.60 |
0.62 |
|||
Table 9 shows class-wise performance of the combined module. Conv_5×5 achieved the highest overall accuracy (76.55%), capturing key features in most classes, while smaller convolutions (Conv_4×4, Conv_3×3) performed better on specific classes. Fusing these layers enables the model to integrate multi-scale features, improving discrimination of subtle variations and enhancing robustness across all classes.
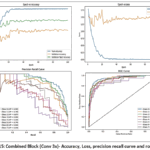 |
Figure 15: Combined Block (Conv 3x)- Accuracy, Loss, precision recall curve and roc curve. Click here to View Figure |
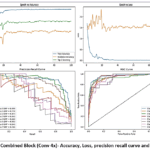 |
Figure 16: Combined Block (Conv 4x)- Accuracy, Loss, precision recall curve and roc curve. Click here to View Figure |
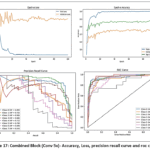 |
Figure 17: Combined Block (Conv 5x)- Accuracy, Loss, precision recall curve and roc curve. Click here to View Figure |
Figures 15–17 illustrate the performance of the combined module for the Conv_3×3, Conv_4×4, and Conv_5×5 layers, respectively. Each figure shows the training and validation loss and accuracy curves, reflecting stable convergence and effective learning across epochs. The accompanying precision–recall and ROC curves demonstrate strong discriminative capability across all classes. The comparison across layers highlights that different convolution scales capture complementary features, motivating their fusion to improve overall classification robustness and accuracy.
Comparison to state of the art
Table 10: Comparison to state of the arts
| Layers | Normal Accuracy | Top 2% Accuracy |
| Conv 5X (2048*7*7) | 76.55 | 86.99 |
| MMTOU* | 67.59 | 79.96 |
| VGG 16 | 73.13 | 87.63 |
| ResNet 50 | 76.12 | 86.11 |
| DenseNet121 | 73.13 | 84.43 |
| Efficient B0 | 75.69 | 86.57 |
| Efficient B1 | 73.35 | 85.50 |
| Efficient B2 | 74.84 | 87.21 |
Our reimplementation
Table 8 provides a comparison with state of arts. Our model has achieved a better performance.
Discussion
The experimental results demonstrate that architectural design and feature enhancement strategies significantly impact ovarian cancer classification. Among baseline CNNs, ResNet-50 achieved the most balanced overall accuracy (76.12%) and class-wise stability, while VGG-16 delivered the highest top-2 accuracy (87.63%), and EfficientNet variants offered competitive performance with B0 balancing overall and top-2 accuracy and B2 excelling in top-2 predictions. Incorporating CBAM progressively improved ResNet-50’s accuracy from 64.39% at Conv3X to 76.33% at Conv5X, with top-2 accuracy increasing from 79.96% to 89.55%, highlighting the effectiveness of attention mechanisms in enhancing deep feature discrimination, particularly for dominant classes. The MSFEB block provided uniform gains across layers, increasing accuracy to 74.41% at Conv4X and stabilizing class-wise performance, while minority classes remained challenging. The fusion of MSFEB and CBAM further leveraged complementary strengths, integrating local spatial details with channel-wise attention, yielding the highest overall accuracy of 76.55% and top-2 accuracy of 86.99%, improving robustness and separability across classes. These findings indicate that residual connections, scalable architectures, attention mechanisms, and multi-scale feature integration collectively enhance discriminative capability, ensure stable convergence, and provide a reliable framework for accurate multi-class ovarian cancer classification.
Conclusion
Ovarian cancer is a grave and ever-growing global health concern that poses a substantial risk to women worldwide. Given the high death rate and frequently delayed diagnosis of this illness, more accurate and efficient diagnostic techniques are required. The current study addresses this need by performing a thorough investigation of several ultrasound imaging-based methods for ovarian cancer diagnosis, with an emphasis on the use of deep learning models. The work explores how well-known deep learning algorithms, such as VGG16, ResNet50, and EfficientNet, perform in ovarian cancer detection. The efficacy of these models in interpreting ultrasound pictures for the detection of ovarian cancer is assessed here. ResNet-50 uses residual connections to make training deep networks more stable, tackling the vanishing gradient problem while keeping its ability to represent complex data intact. Its well-thought-out design allows for efficient feature extraction, capturing both broad and detailed patterns, which makes it a great fit for challenging biomedical imaging tasks. To boost system efficiency and further the study adds a proposed block to the architecture of the model, taking it a step further. The addition of this unique architectural block to resnet50 along with CBAM shows a notable boost in system performance, indicating the possibility of refining current models to address the unique requirements of ovarian cancer diagnosis. Our proposed block along with CBAM is able to get the best rest compared to the existing models. The study admits that there is still a need for improvement despite these developments. Prospective study avenues are recommended, with a focus on investigating novel approaches.
Acknowledgement
The authors would like to express their sincere gratitude to Graphic Era Deemed to be University, for granting permission and providing the necessary support to pursue this Ph.D. research work. The constant encouragement and valuable facilities offered by the Department of Computer Science and Engineering are deeply appreciated. The authors also acknowledge the academic environment and technical resources made available, which significantly contributed to the progress and completion of this study.
Funding Sources
The author(s) received no financial support for the research, authorship, and/or publication of this article.
Conflict of Interest
The authors do not have any conflict of interest.
Data Availability Statement
This statement does not apply to this article.
Ethics Statement
This research did not involve human participants, animal subjects, or any material that requires ethical approval.
Informed Consent Statement
This study did not involve human participants, and therefore, informed consent was not required.
Clinical Trial Registration
This research does not involve any clinical trials.
Permission to reproduce material from other sources
Not Applicable
Author contribution
- Ankita Nainwal: Conceptualization, Methodology, Writing – Original Draft.
- Vidit Kumar: Supervision, Analysis, Writing – Review & Editing, Visualization.
- Bhaskar Pant: Supervision, Writing – Review & Editing.
References
- Chandra A, Pius C, Nabeel M, et al. Ovarian cancer: Current status and strategies for improving therapeutic outcomes. Cancer Med. 2019;8(16):7018-7031.
CrossRef - Indian Council of Medical Research. Guidelines: Ovarian Cancer. New Delhi: ICMR; 2019. Accessed October 3, 2025. Available from: https://main.icmr.nic.in/sites/default/files/guidelines/Ovarian_Cancer.pdf
- Chaturvedi M, Kataki AC, Dhillon PK, et al. Descriptive epidemiology of ovarian cancers in India: A report from National Cancer Registry Programme. Indian J Gynecol Oncol. 2023;21(1):1-8.
CrossRef - Peres LC, Cushing-Haugen KL, Kobel M, et al. Invasive epithelial ovarian cancer survival by histotype and disease stage. J Natl Cancer Inst. 2019;111(1):60-68.
CrossRef - Jacobs IJ, Menon U. Progress and challenges in screening for early detection of ovarian cancer. Mol Cell Proteomics. 2004;3(4):355-366.
CrossRef - Forstner R. Early detection of ovarian cancer. Eur Radiol. 2020;30(10):5370-5373.
CrossRef - LeCun Y, Bengio Y, Hinton G. Deep learning. Nature. 2015;521(7553):436-444.
CrossRef - Roka S, Diwakar M, Karanwal S. A review in anomalies detection using deep learning. In: Satapathy SC, Bhateja V, Joshi A, eds. Advances in Intelligent Systems and Computing. Singapore: Springer Nature; 2022:329-338.
CrossRef - Pathak H, Kulkarni V. Identification of ovarian mass through ultrasound images using machine learning techniques. In: 2015 IEEE International Conference on Research in Computational Intelligence and Communication Networks (ICRCICN). 2015:137-140.
CrossRef - Ibrahim DA, Al-Assam H, Du H, Jassim S. Using trainable segmentation and watershed transform for identifying unilocular and multilocular cysts from ultrasound images of ovarian tumour. In: SPIE Proceedings. 2017:1-8.
CrossRef - Acharya UR, Sree SV, Molinari F, et al. Use of nonlinear features for automated characterization of suspicious ovarian tumors using ultrasound images in fuzzy forest framework. Int J Fuzzy Syst. 2018;20(4):1385-1402.
CrossRef - Wu C, Wang Y, Wang F. Deep learning for ovarian tumor classification with ultrasound images. In: Advances in Multimedia Information Processing – PCM 2018. Cham: Springer International Publishing; 2018:395-406.
CrossRef - Carvalho C, Oliveira H, Rodrigues P, et al. Deep learning approaches for gynaecological ultrasound image segmentation: a radio-frequency vs B-mode comparison. In: Lecture Notes in Computer Science. Cham: Springer International Publishing; 2019:295-306.
CrossRef - Hussein IJ, Ali H, Ahmed S, et al. Fully automatic segmentation of gynaecological abnormality using a new Viola-Jones model. Comput Mater Contin. 2021;66(3):3161-3182.
CrossRef - Al-Karawi D, Ibrahim D, Al-Assam H, Du H, Jassim SA. A model-based adaptive method for speckle noise reduction in ultrasound images of ovarian tumours: a new approach. In: Multimodal Image Exploitation and Learning 2021. 2021;11734:117340J.
CrossRef - Hsu ST, Su YJ, Hung CH, Chen MJ, Lu CH, Kuo CE. Automatic ovarian tumors recognition system based on ensemble convolutional neural network with ultrasound imaging. BMC Med Inform Decis Mak. 2022;22(1):1-12.
CrossRef - Hussein IJ, Burhanuddin MA, Mohammed MA, Benameur N, Maashi MS, Maashi MS. Fully automatic identification of gynaecological abnormality using a new adaptive frequency filter and histogram of oriented gradients (HOG). Expert Syst. 2022;39(3):e12765.
CrossRef - Cho HW, Lee S, Hong JH, Kim S, Song J, Lee JK. Pelvic ultrasound-based deep learning models for accurate diagnosis of ovarian cancer: retrospective multicenter study. J Clin Oncol. 2024;42(16_suppl):5543. doi:10.1200/jco.2024.42.16_suppl.5543
CrossRef - Giourga M, Kalogeraki A, Papadopoulos T, et al. Enhancing ovarian tumor diagnosis: performance of convolutional neural networks in classifying ovarian masses using ultrasound images. J Clin Med. 2024;13(14):4123. doi:10.3390/jcm13144123
CrossRef - Sengul SB, Ozkan IA. A novel hybrid approach: capsule network enhanced with residual block and CBAM module for medical image classification. In: Proc Int Conf Intell Syst New Appl (ICISNA). 2024;2:22-26. doi:10.58190/icisna.2024.84
CrossRef - Shyamala N, Mahaboobbasha S. Convolutional Block Attention Module-based deep learning model for MRI brain tumor identification (ResNet-CBAM). 2024 Sep;1603-1608. doi:10.1109/icosec61587.2024.10722246
CrossRef - Rakha M, Sulistiyo MD, Nasien D, Ridha M. A combined MobileNetV2 and CBAM model to improve classifying the breast cancer ultrasound images. J Appl Eng Technol Sci. 2024;6(1):561-578. doi:10.37385/jaets.v6i1.4836
CrossRef - Acharya UR, Sree SV, Saba L, Molinari F, Guerriero S, Suri JS. Ovarian tumor characterization and classification using ultrasound—a new online paradigm. J Digit Imaging. 2013;26(3):544-553.
CrossRef - Woo S, Park J, Lee JY, Kweon IS. CBAM: Convolutional block attention module. In: Proc. Eur. Conf. Comput. Vis. (ECCV). 2018:3–19. doi:10.1007/978-3-030-01234-2_1
CrossRef - Lyu S, Zhao Q, Bai W, et al. Unsupervised cross-domain semantic segmentation on multi-modality ovarian tumor ultrasound data. Pattern Recognit. 2026;171:112311. doi:10.1016/j.patcog.2025.112311.
CrossRef - Timmerman D, Ameye L, Fischerova D, et al. Simple ultrasound rules to distinguish between benign and malignant adnexal masses. Ultrasound Obstet Gynecol. 2010;36(6):667–673. doi:10.1002/uog.7659
CrossRef - Kinkel K, Hricak H, Lu Y, et al. Ovarian cancer: screening, treatment outcomes, and staging. Radiology. 2006;238(2):343–353. doi:10.1148/radiol.2382040764

Accepted on: 13-07-2026
Second Review by: Dr. K. B. Jayanthi
Final Approval by: Dr. Prabhishek Singh