A Comparative Assessment of Ensemble Classifiers in Prediction of Heart Disease
 , Usha Manasi Mohapatra2, Sumant Sekhar Mohanty3, Sanjivani Bhuyan4 and Binod Kumar Pattanayak4
1Department of CA, S’O’A Deemed to be University, Bhubaneswar, India
2Department of CS, Gangadhar Meher University, Sambalpur, India
3School of computer science, Odisha University of Technology and Research, Bhubaneswar, India
4Department of CSE, S’O’A Deemed to be University, Bhubaneswar, India
Corresponding Author E-mail: sushreetatripathy@soa.ac.in
Download this article as:
ABSTRACT:Heart-related issues rank among the top causes of global mortality. While health professionals are essential for confirming heart risks, expert systems can aid in the diagnostic process. Aiming to design a system that can identify the risk of heart diseases from the data, this paper examines the binary classification of heart disease data using a mix of ensemble and traditional ML approach. This study tests ensemble learning, including Gradient Boosting Classifier and Random Forest( RF), alongside methods like kNN, SVM and Logistic Regression for classification of data into two classes. The above mentioned algorithms are computed based on various classification performance metrics. Results show that Random Forest achieves 100% accuracy and yields the highest area-under-curve value compared to other predictive technique. RF exhibits better performance compared to other algorithms for the data under study. The performance of Random Forest may be experimented on real-time data in the future study.
KEYWORDS:Classification; Coronary Artery Disease; Ensemble Learning; Heart Disease; Machine Learning; Random Forest
Introduction
Cardiovascular diseases (CVD) remain the primary cause of death across the globe as reported by the world health organization (WHO, 2024). Among the various forms of CVD, coronary artery disease (CAD) is the most prevalent and life-threatening condition. CAD occurs due to the blockage of coronary arteries, which can lead to heart attack, heart failure and even sudden cardiac death if not detected and managed at an early stage. Early diagnosis and timely intervention are crucial to reducing the associated morbidity and mortality rates. However, conventional diagnostic methods for CAD, such as angiography, stress tests and advanced imaging techniques are often invasive, expensive, time-consuming and not widely accessible in rural and resource-constrained healthcare settings. This underscores the pressing need for early detection methods that are efficient, non-invasive and cost-effective.
Over the past few years, ML approaches have demonstrated significant potential in healthcare system, particularly in disease identification and risk classification. By analyzing clinical and diagnostic data, ML models can identify hidden patterns and predict disease risk with considerable accuracy. In this context, the present study focuses on the prediction and classification of CAD using ML algorithms. Our research utilizes the widely referenced UCI, which includes clinical parameters such as chest pain type, resting blood pressure, cholesterol levels, fasting blood sugar and electrocardiographic results—factors directly associated with CAD risk assessment. This research is conducted with the primary goal is to progress and evaluate a data-driven, non-invasive, and cost-effective decision-support system to assist healthcare professionals in the early identification of individuals at high risk of CAD. Such a system could play a crucial role in promoting better patient health outcomes and optimizing the allocation of medical resources.
Related Work
Good health has a significant influence on overall well-being and is essential for a satisfying existence. It makes it possible to follow objectives, cherish connections, and completely participate in life’s events. Making health a priority guarantees resilience, vigour, and longevity Cena et al.1. A fulfilling existence is largely dependent on our health, which affects every aspect of our wellbeing. Heart conditions are now main causes of death Muhammad et al. 20202, which emphasizes how important it is to put health first. Heart diseases are largely due to several contributing parameters, such as smoking, poor food, lack of physical activity and hereditary predispositions. Being aware of these dangers, enables people to make well-informed decisions which promotes longevity and heart-healthy practices Adhikary et al.3,4. Plaque development, which is brought on by the build-up of cholesterol particles, is the cause of heart disease. If the process is allowed to continue, it may eventually restrict and obstruct the flow of blood and diminish the availability of oxygen to the heart muscle Ranjan et al.5, Nichols et al.6 and Tripathy et al.7. Additionally, patients may have dyspnea and intense chest discomfort in addition to not complaining of chest pain reports from the WHO Bharti et al.8. Cardiovascular disease affects 75.04% of women and 77.05% of men between the ages of 60 and 79 nation-wide Rodgers et al.9. The greatest rates around 29.4% of death from cardiovascular diseases are seen in the Russian Federation, the European Union, and Indonesian Pogosova et al.10. Compared to the worldwide median of 235 deaths per 100,000, India has a mortality rate due to heart failure estimated to be 272 per 100,000 Kumar et al.11. The annual death rate in India rises from 2.26 million 1990 to 4.77million 2020 . According to reported estimates, between 1.6% and 7.4% of people living in rural areas and between 1% and 13.2% of those living in urban areas are suffering from heart problems . Machine learning has become an influential instrument in healthcare in recent years, providing cutting-edge approaches to preventing and treating diseases. By utilizing extensive datasets, ML hold the opportunity to bring about major change in medical research and open the door to more efficient approaches to enhance global health outcomes Binita et al.12. ML serves to timely identification of diseases and customized treatment holding significant potential to prevent cardiac disease. More effectively than previous approaches, ML model can scan vast amount of clinical data, such as genetic information, and clinical records to uncover patterns and forecast specific health risk indicators. This makes it possible for medical practitioners to become involved sooner, customize therapies to meet the requirements of individual patients, and create more potent plans for managing and preventing illness. Wearable technology and telemedicine platforms with ML will probably play an increasingly bigger role in the fight against heart disease, possibly saving millions of lives globally. A variety of ML methods, including RFt, kNN, SVM, Gradient Boosting Classifiers, and LR Hossen et al.13 have been found effective for classification/prediction problems.
This research work involved exploring a multidisciplinary citation indexing databases. Various keywords such as “predicting heart disease”, “classification using ML”, “cardiovascular risk factor” and so on are specifically used to steer the search process. Researchers in this field have developed techniques employing supervised ML to predict the development of cardiovascular ailments. Several scholarly articles have been authored on this topic that examines the effectiveness of many models based on algorithms and methods for machine learning. Research articles presented in emphasizes some ML approaches on heart disease prediction, which has inspired the present study. These algorithms are validated against performance measures like accuracy and confusion matrix. The accuracy of Logistic Regression (LR) is found to be 0.95 which confirms its better predictability. Only two supervised ML models i.e kNN and RF were investigated in Garg et al.14. K-Nearest Neighbor gives the highest accuracy that is 0.87 surpassing Random Forest. Mostly accuracy has been used as the performance indicator for the algorithms reviewed so far. Recent studies have extensively applied ensemble learning(EL) techniques for heart disease identification. Sharma et al.15 employed Random Forest and XGBoost on the Cleveland sample, achieving a performance y of 86.2%. In contrast, Kumar et al.16 utilized a hybrid ensemble combining AdaBoost and Gradient Boosting with a larger multi-center dataset, reporting an accuracy of 88.5%. Unlike these studies, our work implements a comprehensive normalization process and employs stratified 10-fold cross-validation, enhancing model reliability on imbalanced data. Furthermore, while previous works often reported accuracy alone, our study includes a broader evaluation using different performance measure parameters. This positions our findings as a robust addition to the most recent progress, particularly in validation rigor and reproducibility.
The authors in the current paper attempt to focus on ML model to identify the risk of heart disease in a subject by mining the collected data from the online repositories. Rest of the part are described in the following way. Section 3 highlights all the algorithms that are used in the predictive analytics. Data collection and analysis is also presented within this part. Results obtained from experimental runs are depicted in section 4. The findings and implications are detailed in section 5. At last, limitation included in section 6 and conclusion is discussed in section 7.
Materials and Methods
This section emphasises the working principle of all the classification algorithms that are experimented in this research work. It also explains the data collection and data pre-processing that have been carried out to get the tidy data.
Random Forest(RF)
It is a supervised ML model that can be utilized as multi-talented machine learning method. A forest of several decision trees is created throughout the classification process; each tree is referred to as a subset of training data. Based on the input it receives, each tree determines its own outcome, and based on the majority of results from a certain class, it determines which class the newly acquired information belongs to. The sole distinction between the regression and classification processes is that the former predicts continuous values while the later predicts target values. This value that emerges is the mean of all the numbers that is forecasted.
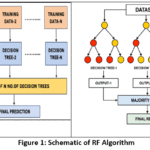 |
Figure 1: Schematic of RF Algorithm Click here to View Figure |
The accuracy grows with a greater amount of decision trees, and random forests assist in avoiding over-fitting issues. The primary motivation for utilizing this technique is that random forest executes faster than other algorithms, which typically need longer times. As seen in Figure 1, a forest of decision trees can be built based on training samples, and each tree produces its own output. Then, the outcome is determined by either averaging in the regression process or by majority voting in the classification process. Its pseudo code is given below.
Pseudocode
Input: Selected features
Output: Is there any risk of heart disease or not?
- Specify the total number of trees as number_of_trees
- Assign number_of_feature
- For i =1 to number_of_trees:
- Select any subset from training data randomly
- Select a subset of features
- Design a decision tree using each feature subset and the data selected randomly
- Each decision tree generates an output
- End For
- Outcome for a test data is produced by performing majority of voting in case of classification and average in regression.
Gradient Boosting
One ML approach that supports us in resolving the complex and challenging issue is Gradient Boosting (GB). Many research articles have assessed the feasibility of boosting techniques in healthcare domain Swain et al.17. Similar to RF, this approach uses regression and classification techniques. It builds multiple sets of decision trees, and each tree’s role is to identify and fix the errors that were made by the preceding tree. The working principle of GB is depicted in the Fig. 2. The bias error is gradually reduced by the training of multiple decision trees. Initially, the decision tree 1 is trained with feature matrix X and the labels Y.
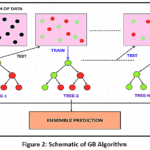 |
Figure 2: Schematic of GB Algorithm Click here to View Fgure |
Next, the 2nd decision tree is trained with feature matrix X and label r1(= Y – Y). Ȳ is the predicted label by the algorithm. r1 is the residual error of first decision tree. Similarly, the subsequent decision trees are trained with the errors produced from their previous trees.
Pseudocode
Input: Selected features
Output: Is there any risk of heart disease or not?
- Create the first model as a simple model that finds the output without any ML algorithm
- Compute pseudo-residual by subtracting the prediction of first model from the actual output
- Generate a decision tree (weak learner) that will predict the residual of the first model instead of the original outcome variable
- Compute the contribution of the weak learner
- Update the current model (adding the scaled contribution of the new weak learner)
- Redo steps 2 to 5
- After iterations the final model is created
Logistic Regression (LR)
This machine learning approach, is a statistical method to estimate the discrete values from group of explanatory variables, and gives a two class outcome i.e. “yes”(1) or “No” (0). This algorithm basically predicts the probability of a certain class. The Logistic Regression model is presented below in the Fig. 3.
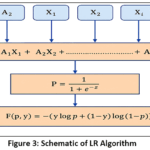 |
Figure 3: Schematic of LR Algorithm Click here to View Figure |
The linear combination of the co-efficient (A0,A1,,,,,,,An) and the predictor variables (X0,X1,,,,,,,Xn) of is represented by the formula z = A0 X0 + A1X1 +…… + An Xn . (1)
The linear combination is converted into a probability value between 0 and 1 using the logistic function p. For logistic regression, the binary cross-entropy loss function is f(p, y) = -(y* log(p) + (1 – y)*log()1 – p)) where y is the actual outcome.
LR algorithm, with binary cross-entropy employed to reduce the gap between predicted and actual labels.
Pseudocode
Input: Selected features
Output: Is there any risk of heart disease or not?
Use a logistic function or the sigmoid function given in eqn. (2) where z is given in eqn.(1)
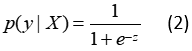
if p(y\ X)> 0.5 (threshold value)
Then the prediction is “Heart-disease is present”
else
Prediction is “Heart-Disease is not present”
Support Vector Machine (SVM)
Although SVM could additionally be used for regression, it is a supervised approach to ML that is mostly utilized for classification. Identifying the optimal hyperplane that separates the data into distinct classes is the fundamental notion behind SVM. There are two types of hyperplane: positive hyperplane and negative hyperplane shown in the Figure 4.
SVM choose the extreme points that are used to build the hyperplane and best hyperplane is selected after calculating the distance between the extreme points. SVM is the most common algorithm followed by many data scientists in the medical field because this algorithm has the ability to handle very complex datasets.
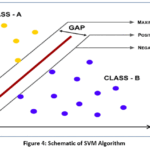 |
Figure 4: Schematic of SVM Algorithm Click here to View Figure |
Pseudocode
Input: Selected features
Output: Is there any risk of heart disease or not?
- Define the optimization problem to find the hyperplane.
- w,x + b = 0 that maximizes the margin between two classes (w is the weight and b is the bias)
- Formulate the primal problem
- Solve the problem by converting it to dual problem
- Compute the weight and bias
- Construct f(x) = wx + b
if f(x) > 0, predicted class is 1(risk of heart disease present)
else predicted class is 0 (risk of heart disease is not present)
K Nearest Neighbors(kNN)
kNN is a straightforward model that categorise samples based on the classes of predicts values by averaging the nearest neighbours. It is considered a lazy learning algorithm because it does not involve any training process. Instead, it stores all the training data and uses it during the prediction phase. When a new data point needs to be classified (or a value needs to be predicted in regression), kNN compute the distance between this point and all the points in the training dataset.
Common distance metrics include Euclidean distance, Manhattan distance, and Minkowski distance. It then identifies the k nearest neighbours (data points) to the new data point. The value k of is a user-defined constant and determines the number of neighbours to consider. In classification tasks, kNN assigns the class label to the new data point based on the majority class among its k nearest neighbors.
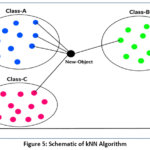 |
Figure 5: Schematic of kNN Algorithm Click here to View Figure |
Pseudocode
Input: Selected features
Output: Is there any risk of heart disease or not?
- Preparing the data and selecting the value of k.
- Choosing an appropriate distance metric.
- Computing distances from the test point to all training points.
- Sorting the distances and selecting the k nearest neighbors.
- Using majority voting or averaging (classification/regression) to calculate the class category of the test data.
- Assigning predicted class label to the test point.
This research work attempts experimentation of all the above described ML models on the data and assesses their performances using various performance indicators. The work flow of the study is presented in Figure 6.
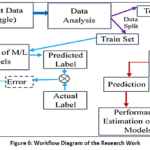 |
Figure 6: Workflow Diagram of the Research Work Click here to View Figure |
Data Collection and Analysis
It covers the collection of data used in this research work and its processing. Data collection is a crucial phase in research that helps in finding out the answers of research questions. The initial stage involves gathering the necessary data, choosing the pertinent features to work with, and pre-processing it into the necessary format Mohapatra et al.18. Following that, the provided data is split into two distinct categories: datasets for training and testing. Finally, model’s accuracy is computed based on testing data.
Data Collection
The dataset required to experiment the research objectives is downloaded from the online repository Deokar et al. 19.
Feature Description
The columns/attributes in a dataset are the features, which are essential to get the insight of the data and the impact of it on the prediction of outcome variable. A complete elaboration of the dataset is provided in Table 1. It consists of about 1025 rows and 14 columns. There are 526 individuals with heart disease and 499 without heart disease. Targets column is the outcome/dependent variable whereas the rest 13 columns are independent variables.
Table 1: Description of features
|
Sl. # |
Attributes | Description | Values |
| 1 | Age | Patients age in Years |
Continuous |
|
2 |
Sex | 0-male 1-Female | Male/Female |
| 3 | CP | Chest Pain |
Four types |
|
4 |
Trestbps | Resting Blood-Pressure. | Continuous |
| 5 | Chol | Serum Cholestrol in mg/dl |
Continuous |
|
6 |
FBS | Fasting Blood-Pressure | <or>120mg/dl |
| 7 | Restecg | Resting Electrocardiography. |
Five values |
|
8 |
Thalach | Maximum Heart rate | Continuous |
| 9 | Excang | Exercise induced Angins. |
Yes/no |
|
10 |
Oldpeak | ST depression induced by exer. | Continuous |
| 11 | Slope | Slope of peak exercise ST segment |
Up/Flat/Down |
|
12 |
Ca | Number of major vessels | 0.3 |
| 13 | Thal | Defect Type |
Reversible /Fixed/Normal |
|
14 |
Targets | Heart Disease |
1-disease ,0-no disease |
Data Pre-processing
The dataset utilized in this study comprises labeled clinical observations pertinent to heart disease diagnosis. To preserve data consistency and quality, we performed an initial exploratory data analysis (EDA) to identify and address missing values, outliers, and inconsistencies. This step is crucial for preparing the data for subsequent modeling and analysis. Normally, the datasets contain a large number of noisy or low-quality data points. As part of the pre-processing step, all the noise values and missing data points are handled. Given that the dataset contains numerical features with varying scales, we applied Z-score standardization to normalize these features. This technique transforms the data to have a mean of zero and a SD of one, which is significantly beneficial for algorithms sensitive to feature scaling, such as kNN and SVM. To assess the performance and generalizability of our models, we employed stratified k-fold cross-validation with k=10. It ensures that each fold maintains the same class distribution as the original dataset, providing a robust assessment of model performance and mitigating the risk of overfitting. The 10-fold cross-validation approach was applied, where in the dataset was randomly partitioned into 10 equal-sized folds. In each iteration, 8 folds were used for training, and the remaining 2 fold was used for testing, ensuring that every instance of the dataset was used for both training and validation exactly once. The final performance metrics were calculated by averaging the results obtained across all 10 folds.
Additionally, to assess the risk of overfitting, model performance was monitored on both training and validation sets across folds. The comparative analysis of training and validation scores revealed no substantial discrepancies, indicating that overfitting was effectively controlled within this cross-validation framework. However, as an acknowledged limitation, the study did not include an external validation dataset from a separate source, which may affect the model’s generalizability to unseen populations. Future work will address this by incorporating external datasets to further validate model robustness.
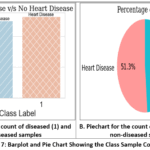 |
Figure 7: Barplot and Pie Chart Showing the Class Sample Counts Click here to View Figure |
The data acquired for the current study is speculated for noise, missing value and any correlation factor. But, it is observed that the data is tidy enough to get experimented. Moreover, it is also balanced which is shown in Figure 7 as the difference between the corresponding proportions of data is insignificant. The pair plot depicted in Fig. 8 and the correlation matrix delineated in Figure 9 confirms the absence of correlation between each and every pair of features.
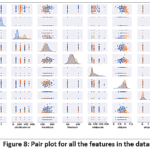 |
Figure 8: Pair plot for all the features in the dataset Click here to View Figure |
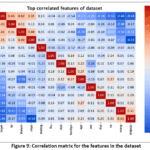 |
Figure 9: Correlation matrix for the features in the dataset Click here to View Figure |
Figure 9 presents a correlation matrix heatmap illustrating the Pearson correlation coefficients. The correlation values range from -1 to +1, where:
The strength and direction of the relationships are color-coded, with red shades denoting strong positive, blue shades negative correlations and neutral shades weak or no correlation.
Results
The study has considered various performance indicators namely, accuracy, precision, specificity etc. to compare the efficiencies of different algorithms Tripathy et al.20. illustrates the computed values of the performance measures that claim the superiority of RF among other classifiers. Nevertheless, the confusion matrix (CF) of RF affirms zero false positive and false negative case prediction. Figure 10 shows all the CFs.
Table 2(a): Performance indicators of the M/L algorithms
|
Performance Measures |
Algorithms | ||||
| RF | LR | kNN | GB |
SVM |
|
|
PRECISION |
1.0 | 0.75 | 0.69 | 0.95 | 0.65 |
| RECALL | 0.96 | 0.81 | 0.73 | 0.95 |
0.72 |
|
F1-SCORE |
0.98 | 0.87 | 0.71 | 0.95 | 0.68 |
| SPECIFICITY | 1.00 | 0.74 | 0.7 | 0.95 |
0.63 |
Table 2(b): Hyperparameters Used for Machine Learning Models
|
Model |
Hyperparameters(Values/Description) |
|
SVM |
Kernel Radial Basis Function, Regularization parameter(C =1.0), Soft margine
Softmargine |
| LR |
Regularization Strength(C=1.0), Learning rate(Default), Max_iteration(1000) |
|
kNN |
k=3, Euclidean distance, weight function |
| GB |
Number of tree(100), learning rate(1.0), loss function, subsampling rate(1.0) |
|
RF |
Number of tree(100),splitting criterion (Gini index), Bootstrap samplinf(enabled) |
As shown in Table-2(a), Random Forest and Gradient Boosting outperform the other classifiers across all evaluation metrics. The hyperparameter settings employed for SVM, Logistic Regression, KNN, Gradient Boosting, and Random Forest models are detailed in Table 2(b) to facilitate experimental reproducibility.
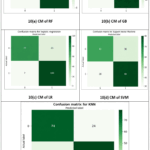 |
Figure 10: Confusion matrix of classifiers Click here to View Figure |
The ROC curve is a visual tool to assess the classification performance of an algorithm by plotting false positive rate and true positive rate. The ROC obtained are included in Figure 11.
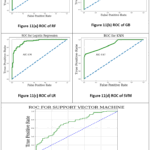 |
Figure 11: ROC plot of M/L models Click here to View Figure |
It is evident from the ROC plots that the RF algorithm is producing better prediction for heart disease data in comparison to others. Similarly, the bar plot in Figure 12 showcases dominating performance of RF in terms of accuracy.
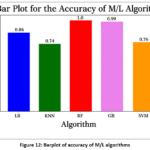 |
Figure 12: Barplot of accuracy of M/L algorithms Click here to View Figure |
Discussion
In this study, multiple EL algorithms including RF and GB were employed for prediction of heart disease. The selection of these algorithms was motivated by their proven effectiveness in handling structured, tabular healthcare datasets and their established ability to manage non-linear relationships among clinical features. Ensemble models, by combining multiple weak learners, are known to reduce variance and improve predictive accuracy, making them suitable for clinical risk prediction tasks. Advanced gradient boosting frameworks like LightGBM and CatBoost were considered but ultimately excluded from this study. These models, while highly competitive in large-scale machine learning applications, require more complex pre-processing steps for categorical variables and hyper parameter tuning, which can lead to overfitting on relatively small datasets like the UCI Heart Disease dataset. Furthermore, the selected models align with prior heart disease prediction studies, facilitating direct performance comparisons and ensuring clinical interpretability through feature importance analysis Karna et al.21. This approach prioritizes both predictive performance and practical applicability in healthcare settings where model transparency is critical Ying et al.22.
This research paper has taken the heart disease prediction data which is almost balanced, structured and non-correlated. After methodical comparison of the performance metrics’ it is observed that RF outperforms all other ML algorithms including GB. Though GB is an ensemble technique like RF, it works in a sequential manner. The base learners in the GB try to rectify the errors made by previous learning models. The performance is not surpassing that of RF due to the limited data size and possible occurrence of over-fitting. RF being a bagging algorithm, the individual learners work in parallel on random chunks of data. It worked well in minimal tuning compared to GB. The conclusion may deviate for a dataset with larger size and unstructured data.
Limitation and Future Scope
Now several limitations must be acknowledged:
- Dataset Size and Source: The analysis was conducted on a single publicly available dataset, clinical cases are not encountered in broader populations. Incorporating larger, multi-center datasets could improve model generalizability.
- Feature Availability: Some potentially influential clinical variables were not included in the dataset. Future studies could integrate additional parameters like echocardiogram results, genetic markers, or lifestyle factors.
- Clinical Validation: The models have yet to be tested in real-world clinical settings. Future work should involve prospective validation with live patient data and collaboration with healthcare professionals.
- Model Interpretability: Although ensemble models achieved higher accuracy, their interpretability remains limited compared to simpler models. While this study reports multiple classification performance metrics for assessing the performance of different ML models, it does not incorporate formal statistical significance testing (e.g., ANOVA, Wilcoxon) to rigorously assess whether the observed differences in model performances are statistically meaningful. The absence of such tests diminishes the potential to confirm the validity of the comparative results beyond descriptive metrics. In future work, we intend to address this limitation by conducting appropriate parametric or non-parametric statistical tests to validate the significance of performance differences across the classifiers. This will enhance the effectiveness and credibility of the model comparison and provide a stronger basis for selecting the most effective model for heart disease prediction.
Conclusion
Certain models outperform others due to their ability to capture complex, non-linear relationships in the data. Ensemble methods such as RF and GB achieve superior performance because they reduce variance, handle feature interactions effectively, and are more robust to noise. In contrast, LR assumes linear separability, while kNN and SVM are sensitive to feature scaling, noise, and parameter selection, which can limit their performance on heterogeneous clinical data.From a clinical perspective, the high precision and recall achieved by Random Forest and Gradient Boosting indicate reliable identification of both diseased and non-diseased patients. High recall is particularly important in medical diagnosis, as it minimizes false negatives and reduces the risk of missing patients with heart disease. These results suggest that such models could support clinicians as decision support tools, aiding early screening rather than replacing clinical judgment.Compared with existing literature on heart disease prediction, the obtained results are consistent with prior studies reporting superior performance of ensemble learning methods over single classifiers. Many earlier works have demonstrated that Random Forest and Gradient Boosting provide higher diagnostic accuracy and robustness on structured clinical datasets, which aligns with the findings of this study and confirms the effectiveness of ensemble-based approaches for heart disease risk prediction.
In today’s world it has become very challenging for health experts to predict heart related risks in human in a short time with utmost accuracy. Several ML models can be developed to assist the health professionals in the prediction which may reduce their work burden. The current study has considered five different ML algorithms to experiment their efficiencies in the heart risk prediction from existing dataset. Among the algorithms, RF has been proven as the best predictor in terms of all the performance measure parameters and ROC curve in comparison with the other counterparts. Future work aims to experiment the influence of individual features on the outcome variable. The study also lacks in testing the algorithms for real time data.
Acknowledgment
We would like to extend our gratitude to all contributors who supported this study, particularly our colleagues from the Department of CA. We appreciate the invaluable insights and assistance provided throughout the research process. Special thanks to the institutions and teams involved for their collaboration and commitment. We are also grateful to our peers and mentors for their constructive feedback, which helped enhance the quality of this systematic review and meta-analysis.
Funding Sources
The author(s) received no financial support for the research, authorship, and/or publication of this article.
Conflict of Interest
The author(s) do not have any conflict of interest.
Data Availability Statement
This statement does not apply to this article.
Ethics Statement
This research did not involve human participants, animal subjects, or any material that requires ethical approval.
Informed Consent Statement
This study did not involve human participants, and therefore, informed consent was not required.
Permission to reproduce material from other sources
Not Applicable
Clinical Trial Registration
This research does not involve any clinical trials.
Author contributions
- Sushreeta Tripathy: Conceptualization, Investigation, Data Curation, Methodology & Supervision, Editing, Writing.
- Usha Manasi Mohapatra: Programming, Visualization, Validation
- Sumant Sekhar Mohanty: Programming
- Sanjivani Bhuyan:, Programming, & Writing
- B.K.Pattanayak: Editing, Validation
References
- Cena H, Calder PC. Defining a healthy diet: evidence for the role of contemporary dietary patterns in health and disease. Nutrients. 2020;12(2):334. doi:10.3390/nu12020334.
CrossRef - Muhammad Y, Khan A, Ahmed S, et al. Early and accurate detection and diagnosis of heart disease using intelligent computational model. Sci Rep. 2020;10:19747. doi:10.1038/s41598-020-76635-9
CrossRef - Adhikary D, Barman S, Ranjan R, Stone H. A systematic review of major cardiovascular risk factors: a growing global health concern. Cureus. 2022;14(10):e30119. doi:10.7759/cureus.30119
CrossRef - Rhee EJ, Kim HC, Kim JH, et al. 2018 guidelines for the management of dyslipidemia in Korea. Korean J Intern Med. [Incomplete citation—please provide volume, issue, and pages or DOI]
- Ranjan R, Adhikary D, Mandal S, Saha SK, Hasan K, Adhikary AB. Performance of Euro SCORE II and logistic Euro SCORE in Bangladeshi population undergoing off-pump coronary artery bypass surgery: a prospective cohort study. JRSM Cardiovasc Dis. 2019;8:2048004019862125. doi:10.1177/2048004019862125
CrossRef - Nichols M, Townsend N, Scarborough P, Rayner M. European Cardiovascular Disease Statistics. Brussels: European Heart Network; 2012.
- Tripathy S, Singh R. Convolutional neural network: an overview and application in image classification. In: Proceedings of the Third International Conference on Sustainable Computing. Singapore: Springer; 2021:145-153. doi:10.1007/978-981-16-4538-9_15
CrossRef - Bharti R, Khamparia A, Shabaz M, Dhiman G, Pande S, Singh P. Prediction of heart disease using a combination of machine learning and deep learning. Comput Intell Neurosci. 2021;2021:8387680. doi:10.1155/2021/8387680
CrossRef - Rodgers JL, Jones J, Bolleddu SI, et al. Cardiovascular risks associated with gender and aging. J Cardiovasc Dev Dis. 2019;6(2):19. doi:10.3390/jcdd6020019
CrossRef - O’Donnell MJ, Chin SL, Rangarajan S, et al. Global and regional effects of potentially modifiable risk factors associated with acute stroke in 32 countries (INTERSTROKE): a case-control study. 2016;388(10046):761-775. doi:10.1016/S0140-6736(16)30506-2
CrossRef - Kumar NT, Liestøl K, Løberg EM, Reims HM, Mæhlen J. Postmortem heart weight: relation to body size and effects of cardiovascular disease and cancer. Cardiovasc Pathol. 2014;23(1):5-11. doi:10.1016/j.carpath.2013.07.003
CrossRef - Kumari B, Tripathy S, Sahoo S. Machine learning algorithms for detecting the existence of heart disease in patients: a comparative analysis. In: 2022 IEEE 2nd International Symposium on Sustainable Energy, Signal Processing and Cyber Security (iSSSC). IEEE; 2023:1-5. doi:10.1109/iSSSC56467.2022.10051536
CrossRef - Hossen MK. Heart disease prediction using machine learning techniques. Am J Comput Sci Technol. 2022;5(3):146-154. doi:10.11648/j.ajcst.20220503.15
- Garg A, Garg NB, Bansal M. Revolutionizing heart attack prevention: machine learning models in smart healthcare. SN Comput Sci. 2025;6(2):1-14. doi:10.1007/s42979-025-02981-0
CrossRef - Sharma V, Yadav S, Gupta M. Heart disease prediction using machine learning techniques. In: Proceedings of the 2020 2nd International Conference on Advances in Computing, Communication Control and Networking (ICACCCN). IEEE; 2020:177-181. doi:10.1109/ICACCCN51052.2020.9362845
CrossRef - Kumar A, Dhanka S, Singh J, Khan AA, Maini S. Hybrid machine learning techniques based on genetic algorithm for heart disease detection. Innov Emerg Technol. 2024;11:2450008. doi:10.1142/S2661339524500089
CrossRef - Swain SM, Whaley FS, Ewer MS. Congestive heart failure in patients treated with doxorubicin: a retrospective analysis of three trials. 2003;97(11):2869-2879. doi:10.1002/cncr.11407
CrossRef - Mohapatra UM, Tripathy S. An efficient convolutional neural network-based classifier for an imbalanced oral squamous carcinoma cell dataset. Int J Artif Intell. 2024;13(1):487-499. doi:10.11591/ijai.v13.i1.pp487-499
CrossRef - Deokar AS, Pradhan MA. Prediction of cardiovascular diseases using explainable AI. In: Artificial Intelligence, Blockchain, Computing and Security. Vol 1. CRC Press; 2023:201-206.
CrossRef - Tripathy S, Mohapatra UM, Gountia D. A comparative assessment of ensemble classifiers in prediction of diabetes mellitus. In: Proceedings of the 2025 International Conference on Intelligent and Cloud Computing (ICoICC). IEEE; 2025:1-7. doi: 1109/ICoICC64033.2025.11052021.
CrossRef - Karna VVR, Karna VR, Janamala V, Devana VKR, Ch VRS, Tummala AB. A comprehensive review on heart disease risk prediction using machine learning and deep learning algorithms. Arch Comput Methods Eng. 2025;32(3):1763-1795.
CrossRef - Ying T, Nie Q, Yan W, Wang H, Wu J. Global, regional, and national burden of non-rheumatic valvular heart disease and its projections to 2035: comprehensive analysis of the Global Burden of Disease Study 2019. Front Cardiovasc Med. 2025;12:1445024.
CrossRef

Accepted on: 03-07-2026
Second Review by: Dr. Sandeep Sharma
Final Approval by: Dr. Anton R Keslav