An Optimized and Validated RP-HPLC Method for Contemporaneous Estimation of Sitagliptin and Saxagliptin in Bulk and Tablet Dosage Forms
 , Rakam Gopi Krishna2*, Suvendu Saha3, Chavana Pranaswi1, Jilla Bhavana1and Gaddameedi Praneeth Goud1
 1Department of Pharmaceutical Analysis, Marri Laxman Reddy Institute of Pharmacy, Dundigal (V and M), Hyderabad, Telangana, India
2Department of Pharmaceutical Chemistry, Marri Laxman Reddy Institute of Pharmacy, Dundigal (V and M), Hyderabad, Telangana, India
3Department of Pharmacology, Marri Laxman Reddy Institute of Pharmacy, Dundigal (V and M), Hyderabad, Telangana, India
Corresponding Author Email: gopirakam@gmail.com.
DOI : http://dx.doi.org/10.13005/bpj/3518
Download this article as:

The recommended model is suitable for the quantifiable estimation of sitagliptin and also saxagliptin according to experimental findings. The present research work aims to develop RP-HPLC method for the quantification of sitagliptin and saxagliptin simultaneously in bulk dose form and validate according to ICH guidelines. Chromatographic analysis was carried out using a Discovery C18 column (4.6 x 150 mm, 5 µm). "The optimized mobile phase, comprising formic acid buffer, acetonitrile, and methanol (80:10:10 v/v/v), was delivered at 1.0 mL/min at 30°C. Under these conditions, saxagliptin and sitagliptin were eluted consistently at retention times of 2.212 and 2.642 minutes, respectively, with well-resolved and sharp peaks." Saxagliptin's percentage RSD was 0.5, while Sitagliptin's was 1.1. The % recovery for Saxagliptin is 99.61% and for Sitagliptin, it was 100.20% correspondingly. The LOD besides LOQ, derived values from the equations of regression, were 0.10 and 0.31 for saxagliptin, and 1.69 and 5.13 for sitagliptin respectively. The regression equation for Saxagliptin was y = 12784x + 1088.7, and for Sitagliptin, it was y = 12398x + 11053. The declined retention times and run time make this method determined to be straightforward and reasonably priced, appropriate for reliable industrial tested for control of quality. Using the requirements set forth by the International Council for Harmonization, it was determined that the suggested technique was straightforward, exact, accurate and validated.
KEYWORDS:Quality control; Regression; RP-HPLC; Saxagliptin; Sitagliptin; Temperature
Introduction
Pharmaceutical analysis is a subfield of practical chemistry that includes the detection and estimation of potential impurities in pharmaceutical dosage forms as well as the resolution, separation, evaluating, identification and refinement of a given sample.1 The study of analyzing the morphologies, compositions, and amounts of analytical targets is known as analytical chemistry. From the comprehension of fundamental science to a wide range of real-world applications, including forensic science, industrial manufacturing quality control, environmental monitoring, and biomedical applications, these analytical results have been crucial.2 Validation is a process for producing documented proof that any method, procedure or action utilized in evaluating and subsequently production upholds the anticipated level of compliance throughout.
Impurities in bulk drug substances primarily originate from the manufacturing process, whereas formulation impurities mainly arise due to degradation, excipient interactions, and storage conditions. Effective control of both types through validated analytical methods and compliance with ICH guidelines is essential to ensure product quality, safety, and efficacy. The analytical methods developed for the determination of impurities in sitagliptin and saxagliptin were validated in accordance with ICH Q2(R1) requirements. Validation parameters including specificity, linearity, accuracy, precision (repeatability and intermediate precision), limit of detection (LOD), limit of quantitation (LOQ), robustness, and system suitability were satisfactorily established. The methods demonstrated clear separation of the active pharmaceutical ingredient from all known and unknown impurities as well as degradation products under stress conditions, confirming their stability-indicating nature. Linearity was observed across the specified impurity range, with acceptable correlation coefficients. Accuracy and precision results were within predefined acceptance criteria, and robustness studies confirmed method reliability against minor deliberate variations. Overall, the validated methods are suitable for routine quality control, stability testing, and regulatory compliance for sitagliptin and saxagliptin drug substances and finished dosage forms.3 FDA guidelines and conventional bioanalytical technique validation recommendations served as the foundation for the method’s validation. Producing consistent results with little variance without sacrificing the equipment’s functionality and quality is the aim of equipment validation. Chemical analysis’s dynamic and fascinating instrumental method interacts with many other pure and applied science fields as well as with all branches of chemistry. The development and valuation of novel products, as well as the preservation of the environment and public health, depend heavily on analytical instrumentation. Lower detection limits are provided by this equipment, ensuring the safety of food, medications, water, and air. Analytical chemists frequently employ instrumental methods in order to reduce time, prevent chemical separation, and achieve higher precision.4 The current study aims to validate the tablet dosage forms of saxagliptin and sitagliptin and establish a new approach.
A Profile of Drugs
Saxagliptin
An oral active hypoglycemic (anti-diabetic) medication belong to novel dipeptidyl peptidase-4 (DPP-4) inhibitor class is saxagliptin (rINN). July 31, 2009, FDA approval. After injecting of saxagliptin, GLP-1 and GIP ratios elevated twice or to three times. As, there are a minimal systemic adverse effect since it impedes DPP-4 in a very targeted manner. For a full day, saxagliptin inhibits the action of the DPP-4 enzyme. Moreover, it enhanced glucose-based insulin producing from pancreatic beta cells and lowered glucagon concentrations. 0.5 nmol/L is the half maximum inhibitory concentration (IC50). The QTc interval was not clinically significantly prolonged by saxagliptin. Numerous analytical techniques like HPLC, UV Spectrophotometry, LC-MS, and potentiometric approaches, are described for the quantitative measurement of saxagliptin in bodily fluids and pharmaceutical formulations.5 There are also reports of the Employing the reverse phase technology of high performance liquid chromatography to assess metformin and also saxagliptin simultaneously, but this method alters the flow rate, that will upsurge the consumption of the mobile phase and it hasn’t disclosed the approach specificity by guiding stress-induced degradation research.6
Mechanism of action: Saxagliptin is an orally active dipeptidyl peptidase-4 (DPP-4) inhibitor used in the treatment of type 2 diabetes mellitus. It selectively inhibits the DPP-4 enzyme, thereby preventing the rapid degradation of incretin hormones, mainly glucagon-like peptide-1 (GLP-1) and glucose-dependent insulinotropic polypeptide (GIP). Increased levels of these incretins enhance glucose-dependent insulin secretion from pancreatic β-cells and suppress glucagon release from α-cells, leading to reduced hepatic glucose production and improved glycemic control.
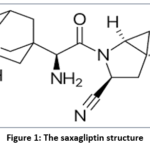 |
Figure 1: The saxagliptin structure |
Sitagliptin
Apart than food & exercise, sitagliptin is an oral dipeptidyl peptidase-4 suppressor used to progress glycemic control in people through type-II diabetes mellitus. By lowering glucagon level and raising insulin in reaction to glucose, this medication helps manage blood sugar levels. October 16, 2006. Sitagliptin was authorized by the FDA. A review of the literature found that spectrophotometric and RP-HPLC techniques were not widely used for sitagliptin measurement, either alone or in combination with other.7
Mechanism of action
Sitagliptin acts by selectively inhibiting the dipeptidyl peptidase-4 (DPP-4) enzyme, resulting in increased levels of incretin hormones such as GLP-1 and GIP. These hormones enhance glucose-dependent insulin secretion from pancreatic β-cells and suppress glucagon secretion from α-cells, leading to decreased hepatic glucose production and improved glycemic control in patients with type 2 diabetes mellitus.8
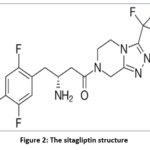 |
Figure 2: The sitagliptin structure |
Impurities
Adherence to ICH Q3A/Q3B guidelines, pharmacopeial specifications, and the use of validated stability-indicating analytical methods ensure that all impurities are effectively identified, quantified, and controlled within acceptable limits, thereby assuring the quality, safety, and therapeutic efficacy of both drug substances and their finished dosage forms.9,10
The linearity, precision, accuracy, specificity, robustness, limit of detection, and limit of quantification of the developed RP-HPLC technique were all validated. The validation process adhered to the International Council for Harmonization’s (ICH) criteria.11
Materials and Methods
Chemicals, Ingredients and Reagents
Gift samples of Sitagliptin, Saxagliptine supplied by Spectrum Pharma Solutions for Research (Telangana-Hyderabad) along with their analytical reports. Rankem provided us with methanol, acetonitrile, and potassium dihydrogen phosphate. Using the Millipore Milli Q Plus water filtration system, high quality water was obtained.
Table 1: Showing Drug name, brand name, label claim and batch number.
| Drug Name | Brand Name | Label Claim | Batch Number |
| Sitagliptin Tablets | Januvia® | Sitagliptin 100 mg per tablet | BATCH/SG/1023* |
| Saxagliptin Tablets | Onglyza® | Saxagliptin 5 mg per tablet | BATCH/SX/0923* |
Commercially available tablet formulations of sitagliptin and saxagliptin were procured from the local market. The label claim and batch numbers were recorded as per the manufacturer’s label and used for assay and impurity analysis studies.
Chromatographic conditions
This method established by employing Phenomenex kinetex column (250*4.6mm). The optimized mobile phase, comprising formic acid buffer, acetonitrile, and methanol (80:10:10 v/v/v), was delivered at 1.0 mL/min. Under these conditions, saxagliptin and sitagliptin were eluted consistently. The flow rate by 1 milliliter per minute was continued. While the column temperature stayed constant at 30°C, eluted chemicals were obtained at a wavelength of 221 nm. The injected content of the sample was 20µl.
Composition of diluents
When selecting the diluent for analysis, the drug’s solubility was taken into account. Mobile Phase is the diluent used.
Preparing Buffer
0.1% Formic acid Buffer
One milliliter of concentrated formic acid was diluted with 1000 milliliters of water.
Mobile phase
A mix of buffer, acetonitrile and also methanol was organized by (80:10:10) ratio. It was filtered and degassed.
Preparation of Standard stock solutions Weigh 2.5 mg saxagliptin and 50 mg sitagliptin precisely. Then, transfer the contents to a container of 50 ml. Then flask sonicated for about five minutes after adding three-quarters of the diluting agent. The flask was then filled with diluents and given the designation Standard stock composition. (1000 µg/ml quantity Sitagliptin and 50 µg/ml quantity Saxagliptin).12
Preparation of Standard working solutions (100% solution)
One milliliter of a stock solution pipetted out and combined with diluent in a ten-milliliter volumetric flask. Saxagliptin (5µg/ml), Sitagliptin (100µg/ml).
Sample stock solution Preparation
A container was filled with 100 milliliters of diluent, and after calculating the average weight of ten pills, the mixture was sonicated for roughly twenty-six minutes. Using diluent, the volume was raised, and HPLC filters were used for purification.
(Sitagliptin at quantity 1000 µg/ml and saxagliptin at qty 50 µg/ml).
Making 100% of the sample working solutions
A ten-milliliter beaker was filled with one milliliter of the filtered sample stock solution, which was then diluted with it.
Saxagliptin (5µg/ml) and sitagliptin (100µg/ml).
Development of method
Many tests have been carried out with various stationary phases, flow rates per min time then mobile phases. The stability factor and theoretical plates were examined before different chromatographic settings were used.
The makeup of the mobile phase, comprising formic acid buffer, acetonitrile, and methanol (80:10:10 v/v/v), with Phenomenx kinetex column was used with detection of wavelength of 221 nm with isocratic elution with run time of 10 min with ambient temperature.
Validation of the method
In accordance with ICH criteria, the method’s linearity, precision, accuracy, robustness, and ruggeddness were assessed.13
System suitability parameters
USP plate count, resolution, and peak tailing were measured by injecting standard solutions at 6 times with quantity 5 ppm saxagliptin and amount100 ppm sitagliptin. This procedure also made it possible to determine all of the system appropriateness characteristics. It is recommended that the standard produce’s percentage RSD not exceed 2% after six injections.
Linearity
50 mg of sitagliptin and 2.5 mg of saxagliptin were added to a volumetric flask after being carefully weighed. After that, the flask was sonicated for ten minutes, which resulted in the accumulation of three-quarters of the diluents. After adding diluents, a flask labelled “Standard stock solution.” (50µg/ml quantity of Saxagliptin and qty 1000µg/ml of Sitagliptin). The linearity of the technique was demonstrated between 25 and 50 µg/ml of concentration. Aliquots of various compositions were diluted from the stock solution in a 50 ml flask through an mobile phase to a standard mark, resulting in concentrations of 25, 50, 75, 100, 125, and 150 ppm, respectively. The solutions were injected into the HPLC equipment in accordance with the test protocol. A calibration curve was created for concentration vs. peak area.
Acceptance standards.
It must have a correlation coefficient of at least 0.9990.
% RSD or solutions 1, 2, 3, 4, 5, 6, and 7, the percentage RSD of peak areas shouldn’t be greater than 2.0%.
Precision
Repeatability or precision of system
A 25-ppm of sample solution was made from the sample stock solution, and it was injected into the HPLC apparatus six times in accordance with protocol.
Acceptance standards.
Each tablet assay for Saxagliptin and Sitagliptin should have a range of 98% to 102%.
The current assay’s relative standard deviation shouldn’t exceed 2.0%.
Precision of method
Six duplicates of 25 ppm solutions were made from a sample and a stock composition, and they were injected into the HPLC apparatus in accordance with protocol.
Criteria of Acceptance
The every Saxagliptin and sitagliptin tablet assay should have a range of 98% to 102%.
It is recommended that a current assay’s relative standard deviation not surpass 2.0%.
Accuracy
A series of solutions were created in triplicate (6 preparations for 50 and 150% levels) by adding 50-150 spiking units of the drug ingredients saxagliptin and sitagliptin to a placebo of test concentration. The results were analyzed in compliance with specification level triplicate injections for 50%, 100%, and 150%. Individual recovery %, mean recovery percentage, RSD percentage, and linearity were measured at each stage.
LOD, or limit of detection
The calibration curve was run three times, and the intercepts’ standard deviation (SD) was computed each time.
One can estimate the slope S using the calibration curve of the analyte.
Quantification limit
The calibration curve was run three times, and each time, the intercepts’ standard deviation was calculated.
Robustness /strength/sturdiness
Robustness was evaluated in respect to minor variations in the pH of the buffer (± 0.2 units), column temperature (± 5), mobile phase organic content (± 2%), and for flow rate (± 5%).
Degradation investigations
Studies for degradation of acid
One milli-liter of the stock composition and one milli-liter of 2N hydrochloric-acid comprising sitagliptin and saxagliptin were refluxed for thirty minutes at 600 degrees Celsius. Chromatograms were obtained to evaluate sample stability after 10 µl solutions were put into the system, 5µg/ml and 100µg/ml solutions were created by diluting the succeeding combination.14
Alkali or base degradation investigation
One milliliter of the saxagliptin and sitagliptin stock mixture was combined with one milliliter of 2N sodium hydroxide. The mixture was refluxed for half an hour at 600 degrees Celsius. After that, 10 µl of the sample-component was poured into apparatus, the distilled solution-mixture produced 100 µg/ml and 10 µg/ml diverse concentrates. Later, chromatograms got acquired.
Investigation of parameter-oxidation
One millilitre for 21% H2O2 was added to separate millilitres of the sitagliptin and saxagliptin stock solutions. They kept the liquids at 600 degrees Celsius for half an hour. Ten microliters of the subsequent sample were dilute for making compositions comprising ratios of 5 µg and also at 100 µg/ml to ascertain whether the material is stable enough for the HPLC analysis. Following that, chromatograms were recorded.
Investigation for dry heat degradation
An oven was used to heat a standard medication solution to 105°C for 6 hr to examine a dry-heat degradation. These final solutions were diluted to a composition for 5µg/ml and at 100µg/ml for HPLC analysis, and 10µl was introduced to the system.
Investigation for photo stability
The medication’s resistance to light was examined by exposing 50 µg/ml and 1000 µg/ml solutions against UV light and keeping the container under cabinet of UV for period of 7 days. Then, diluted to create a conc of 5µg/ml and also at 100µg/ml solutions, 10 µl of the resultant sample was fed into the system to assess the sample constancy for the HPLC analysis. Chromatograms were then taken.
Investigation for neutral degradation
For six hours at 60 degrees celsius, the compounds were refluxed in water to evaluate them. Ten microliters of the final solution are introduced to the system and diluted with five and one hundred micrograms per milliliter for the HPLC analysis in order to evaluate the sample’s stability.
Assay
Prior to injection of drug solutions, the mobile phase was passing through the system at a flow rate of 1.0 ml/min while the column was equilibrated for at least 30 minutes. Following the preparation of a 20 µl standard, the sample solutions were administered twice and 6times, correspondingly. Peak responses in a standard and sample solutions of Saxagliptin and Sitagliptin were measured using the chromatograms.15
Results
The results of Saxagliptin and Sitagliptin were displayed in the present investigation. The ideal mobile phase composition was determined by evaluating a range of buffer and solvent ratios. To improve the chromatographic settings and boost the effectiveness of the chromatographic system, numerous experiments were carried out. These included altering the concentration and pH of the mobile phase, the choice of stationary phase, and more.
In trail-1 peak was eluted, system suitability parameters are not passed. Thus, additional investigation was accomplished (Fig.3). In the second trial, both peaks were eluted, when the buffer was changed, but the USP plate count for saxagliptin was lower because the peak form and count were not up to par. Thus, additional investigation was accomplished (Fig.4). In trial 3, both peaks were eluted, but they did so inside the void volume range. Thus, additional investigation was accomplished (Fig.5). In the trial-4 chromatogram, sitagliptin and saxagliptin eluted with good peak shape and symmetry. Each validation parameter had a total runtime of six minutes. The component was then eluted for an lower retention time limit with an high reproducibility. As a result, this approach was optimized (Fig.6).16
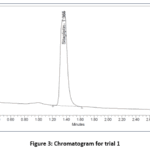 |
Figure 3: Chromatogram for trial 1 |
In figure-3, Initial chromatographic trials for sitagliptin and saxagliptin showed no distinct peaks, prompting further optimization of the method to achieve clear and well-resolved separation.
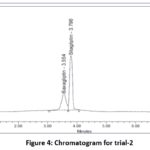 |
Figure 4: Chromatogram for trial-2 |
In figure-4, the chromatographic peak for saxagliptin was poorly resolved, resulting in partial overlap with sitagliptin.
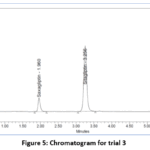 |
Figure 5: Chromatogram for trial 3 |
In figure-5, the peaks did not exhibit sharpness or clear separation, indicating insufficient definition.
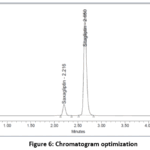 |
Figure 6: Chromatogram optimization |
In figure-6, the optimized RP-HPLC method provided sharp, well-defined, and baseline-resolved peaks for both sitagliptin and saxagliptin. The improved resolution eliminated the earlier partial co-elution, demonstrating that the selected mobile phase, flow rate, and column conditions were appropriate. These results confirm the method’s suitability for accurate and precise simultaneous quantification of both drugs in bulk and dosage forms.
Observation: Saxagliptin and Sitagliptin eluted for 2.216min and 2.650 min correspondingly through an upright resolution. Because of the exceptionally high plate count and tailing factor, this strategy was refined and verified.
Suitability of the system: Every system suitability parameter met the ICH requirements and was within an acceptable range.
Suitability of the system
Several standard chromatographic runs were used to characterize the findings of the system suitability assessment. Retention time, tailing-factor, and plate-count for USP were evaluated by injecting 6 replicates for sitagliptin and saxagliptin. Table 2 presented the findings.
Table 2: Parameters for system appropriateness/ suitability
| Serial no | Saxagliptin | Sitagliptin | |||||
| Injection | Retention time (min) | USP plate count | Tailing factor | Retention time (min) | USP plate count | Tailing factor | Resolution |
| 1 | 2.206 | 5868 | 1.30 | 2.625 | 9937 | 1.24 | 4.5 |
| 2 | 2.207 | 5862 | 1.30 | 2.632 | 9931 | 1.24 | 4.5 |
| 3 | 2.21 | 5850 | 1.30 | 2.638 | 9911 | 1.23 | 4.5 |
| 4 | 2.215 | 5887 | 1.31 | 2.65 | 9817 | 1.23 | 4.5 |
| 5 | 2.216 | 5868 | 1.31 | 2.651 | 9967 | 1.24 | 4.6 |
| 6 | 2.218 | 5896 | 1.31 | 2.653 | 9988 | 1.24 | 4.5 |
Linearity or conformity
Sitagliptin (25-150 µg/ml amount) and saxagliptin (1.25-7.5 µg/ml qty) were administered for six identical doses. Saxagliptin and Sitagliptin have linearity equations of y = 12784x + 1088.7 and y = 12398x + 11053, respectively, based on previously reported average areas. The correlation between the two medications was found to be 0.999. The linearity findings were shown in Figs. 7 and 8.
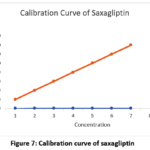 |
Figure 7: Calibration curve of saxagliptin |
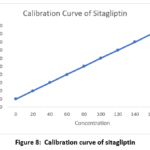 |
Figure 8: Calibration curve of sitagliptin |
Preciseness
Repeatability (Preciseness) of the system
The standard working solution was used to prepare six injections from a single volumetric flask, and the areas obtained were previously defined. For two drugs, we calculated the average area, standard deviation, and % RSD. Saxagliptin’s percentage RSD was found to be 0.5%, while sitagliptin’s was 1.1%. Because the precision restriction was smaller than “2,” this solution successfully passes the system precision. Each parameter fell under the permitted range. Precision findings were shown in Table 3.
Table 3: Showing precision observation of saxagliptin and sitagliptin
| S. No | Area of saxagliptin | Area of Sitagliptin |
| 1. | 65454 | 1266565 |
| 2. | 65355 | 1244556 |
| 3. | 65454 | 1235455 |
| 4. | 64954 | 1257564 |
| 5. | 65065 | 1254544 |
| 6. | 65946 | 1274545 |
| Mean | 65371 | 1255538 |
| S.D | 349.9 | 14225.9 |
| %RSD | 0.5 | 1.1 |
Accuracy
A series of solutions wer made thrice through spikiing the Saxagliptin and Sitagliptin drug substance on placebo in the range of about 50 to 150 of test composition and estimated as per specified levells 3 injection compositions. Discrete % recovered & each levell’s mean average percentage recovered was determined.
The results were revealed in Table. 4 & 5. 17
Table 4: Table of saxagliptin accuracy
| % Composition | Quantity for Spiking
at μg/mL |
Amount recovered
(μg/mL) |
Percentage recovery | Mean recovery percentage |
| 50% | 2.5 | 2.49 | 99.61 | 99.61% |
| 100% | 5 | 4.96 | 99.26 | |
| 150% | 7.5 | 7.40 | 98.62 |
Table 5: Accuracy-table of sitagliptin
| Concentration | Concentration μg/mL | Amount recovered
(μg/mL) |
% Recovery | Mean Recovery percentage |
| 50% | 50 | 49.50 | 99.00 | 100.20% |
| 100% | 100 | 99.76 | 99.76 | |
| 150% | 150 | 151.20 | 100.80 |
Using the standard addition procedure, three different accuracy levels were produced in samples. There are three attempts for every accuracy level and mean percentage. The retrieval rates for sitagliptin and saxagliptin were 100.20% and 99.61%, correspondingly.
LOD, or Limit of Detection and Quantification limit
To determine above parameters, signal to noise ratio was utilized. The outcomes showed that the quantification limit was 0.27µg/ml and the detection limit was 0.09µg/ml for saxagliptin and 1.69 & 5.13 for sitagliptin consequently, it fell inside the acceptable range. Above findings were displayed in Table 6.
Table 6: Sensitivity-table of saxagliptin and sitagliptin
| Drug sample | Limit of detection, LOD | Limit of Quantification LOQ |
| Saxagliptin | 0.10 | 0.31 |
| Sitagliptin | 1.69 | 5.13 |
Under robustness settings, samples are injected in double by following circumstances: Temperature for minus (27°C), Temperature for plus (33°C), Mobile Phase for minus (60B:40A), and Mobile Phase for plus (70B:30A). Each and every suitability for system parameter accepted with slight to not any intervention. RSD remained below than maximum. The results were represented by Table.7.
Table 7: Robustness-outcomes for saxagliptin and sitagliptin
| S.no | Condition | %RSD of Saxagliptin | %RSD of Sitagliptin |
| 1 | Flow rate for (-) 0.9ml/min | 0.5 | 1 |
| 2 | Flow rate at (+) 1.1ml/min | 1.1 | 1.5 |
| 3 | Mobile-phase (-) 60B:40A | 0.7 | 0.5 |
| 4 | Mobile-phase (+) 70B:30A | 0.7 | 0.9 |
| 5 | Temperature at (-) 27°C | 1 | 0.8 |
| 6 | Temperature at (+) 33°C | 1.1 | 0.6 |
Studies on forced deterioration or degradation studies
Research on deterioration was conducted with degraded formulations and samples. The percentage of saxagliptin that degraded in response to acid, alkali, peroxide, heat, UV light, and water was 6.89, 1.75, 5.67, 1.77, 1.09, and 0.65; for sitagliptin, it was 5.67, 0.10, 5.68, 0.82, 1.62, and 1.63, all of which fell within the allowed range. Table 8 presents the statistics on degradation.18
Table 8: Data presentation for forced degradation investigation of saxagliptin, sitagliptin
| Category of degradation | Saxagliptin | Sitagliptin | ||||
| Area or Range | Recovery percentage | Percentage Degraded | Area or Range | Recovery percentage | Percentage Degraded | |
| Acid | 60887 | 93.11 | 6.89 | 1186676 | 94.33 | 5.67 |
| Alkali | 64454 | 98.25 | 1.75 | 1256767 | 99.90 | 0.10 |
| Peroxide | 61687 | 94.33 | 5.67 | 1186566 | 94.32 | 5.68 |
| Thermal | 64542 | 98.23 | 1.77 | 1247677 | 99.18 | 0.82 |
| Uv | 64686 | 98.91 | 1.09 | 1237677 | 98.38 | 1.62 |
| Water | 65178 | 99.35 | 0.65 | 1237565 | 98.37 | 1.63 |
Discussion
Because of their significance in drug and drug product quality control, the development of an analytical method for drug determination by HPLC has drawn a lot of attention in recent years. The capacity of the method to produce test findings that are directly proportional to the analyte concentration in the sample is known as linearity. The correlation coefficient was determined to be within the acceptable range. The relationship between peak area and analyte concentration is stronger. The degree of agreement between several measurements of the same sample is determined by the precision method. Each and every parameter was within the bounds. The results showed NMT 2.0%, which was within the range, and the assay method’s good precision was verified. Standard addition and recovery studies were carried out to show the method’s accuracy. Robustness is a measure of a method’s ability to withstand slight but intentional alterations in chromatographic conditions. Adherence to the restrictions was demonstrated by the tailing factor and retention time.19 The lowest analyte concentration that can be identified is known as the limit of detection. The lowest analyte concentration that may be measured is known as the limit of quantitation. The ICH-defined signal to noise ratio technique is used to compute the LOD and LOQ. Both the LOD and LOQ were determined to be within the acceptable range. The purity threshold was determined to be higher than the allowable range of the purity angle. This demonstrates how specific and stable the procedure was. Standard deviation (SD) and percentage relative standard deviation (%RSD) were used as key statistical parameters to evaluate the precision and repeatability of the developed RP-HPLC method. SD reflects the absolute dispersion of replicate measurements around the mean value, while %RSD provides a normalized measure of variability, allowing direct comparison across different concentration levels.
In the present study, low SD values obtained for system precision, method precision, intra-day, and inter-day precision studies indicate minimal random error and high consistency of the chromatographic response. The corresponding %RSD values were found to be within acceptable limits (< 2.0%), in accordance with ICH Q2(R1) guidelines, confirming the adequacy of the method for routine quantitative analysis. For repeatability studies, %RSD values close to or below 1% demonstrate excellent short-term precision and instrument stability. Similarly, low %RSD values observed in intermediate precision studies indicate that the method is robust against variations in analytical conditions such as different days and analysts. These findings confirm that the developed method provides reliable and reproducible results, suitable for quality control applications.20 Both drugs sitagliptin and saxagliptin, act by inhibiting the enzyme DPP-4 for antidiabetic activity were employed for current investigation, which normally degrades incretin hormones. 21,22 In accordance with ICH criteria, the devised approach was validated. According to ICH requirements, the suggested approach was determined to be straightforward, accurate, exact, and validated in terms of linearity, precision, accuracy, and degradation studies that stayed well within the bounds.
Conclusion
Saxagliptin and Sitagliptin dose forms were simultaneously estimated by a simple, precise, and accurate process. The retaining durations of saxagliptin & sitagliptin are 2.216 & 2.650 mins, correspondingly. Saxagliptin and Sitagliptin were found to have percentage RSDs of 0.5 and 1.1, individually. Recovery rates for sitagliptin and saxagliptin were 100.20% and 99.61%, depending on the medication. The regression equations for sitagliptin yielded LOD and LOQ values of 1.69 and 5.13, respectively, while those for saxagliptin were 0.10 and 0.31. Saxagliptin’s regression equation is y = 12784x + 1088.7. Sitagliptin’s Y = 12398x + 11053 is also given. Because the established approach was affordable and easy to apply, it was perfect for repetitive quality control tests in pharma industries. Both run time in addition retention times were shortened.
Acknowledgement
The entire management of Marri Laxman Reddy Institute of Pharmacy, Located at Dundigal, Hyderabad, Telangana, India, is appreciated and respected by all authors for providing the resources required to complete our research work.
Funding Sources
The author(s) received no financial support for the research, authorship, and/or publication of this article.
Conflict of Interest
The author(s) declares no conflict of interest.
Data Availability Statement
This statement does not apply to this article
Ethics Statement
This research did not involve human participants, animal subjects, or any material that requires ethical approval.
Informed Consent Statement
This study did not involve human participants, and therefore, informed consent was not required.
Clinical trial registration
This research does not involve any clinical trials.
Permission to reproduce material from other sources
Not applicable
Author Contributions
- Kadagoni Pravalika: Data Collection and Analysis.
- Rakam Gopi Krishna: Conceptualization, Methodology, Writing – Original Draft
- Suvendu Saha: Supervision.
- Chavana Pranaswi: Data Collection, Analysis, Writing – Review & Editing.
- Jilla Bhavana: Visualization, Supervision, Project Administration.
- Gaddameedi Praneeth Goud: Resources, Supervision.
References
- Rakam G.K, Srinivasa M, Kavya V. Method development and validation of RP-HPLC method for the determination of sumatriptan in bulk and pharmaceutical dosage form. J. Pharm. Technol. 2021; 14: 5856-5862.
CrossRef - Konstantopoulos G, Koumoulos E.P, Charitidis C.A. Digital Innovation Enabled Nanomaterial Manufacturing; Machine Learning Strategies and Green Perspectives. Nanomaterials. 2022; 12: 2646.
CrossRef - K. Ramoller, M.T.A. Abbate, L.K. Vora, A.R.J. Hutton, HPLC-MS method for simultaneous quantification of the antiretroviral agents rilpivirine and cabotegravir in rat plasma and tissues, J Pharm Biomed Anal. 2022; 213:114698.
CrossRef - Lavanya G, Sunil M, Eswarudu M.M, Eswaraiah M.C, Harisudha K, Spandana B.N. Analytical method validation: An updated review. International Journal of Pharmaceutical Sciences and Research. 2013; 4: 1280.
- Pravin K.R, Vasudevan M, Deecaraman. A Validated RP-HPLC method for simultaneous estimation of metformin and saxagliptin in tablets. Rasayan J. Chem. 2012; 5: 137-141.
- Rakam G.K, Mallik A, Sucharitha Ch. Method development and validation of reverse phase high performance liquid chromatography method for estimation of ondansetron and pantoprazole in their tablet dosage form. Indian J. Pharm. Sci. 2022; 84(2): 483-492.
CrossRef - Connors K.A. A textbook of pharmaceutical analysis. 3rd edn, John Wiley & Sons; 1999.
- Akanksha D, Rajesh S. Development and Validation of Simultaneous Equation Method for Estimation of Sitagliptin Phosphate and Empagliflozin in bulk form by UV Spectroscopy. RJPT. 2023; 16: 3714-3718.
CrossRef - Badithala S.S.K and Raja S. Development and validation of RP-HPLC method for the estimation of deferiprone. J Pharm Sci Innov. 2018;7(6):231-234.
- Reddy K.S, Shirsha S.S, Kumar K.P. Validated stability indicating RP-HPLC method for the simultaneous estimation of rilpivirine and dolutegravir in bulk form. Int J Pharm Sci Res. 2021; 12: 4991-4997.
- ICH- Harmonised Tripartity guideline, validation of analytical procedures: Text and methodology Q2 (R1). International Federation of Pharmaceutical Manufacturers Associations: Geneva., 2005.
- Gopi K.R, Manjeera K, Lalitha R. A validated spectrophotometric method for the estimation of ezetimibe in bulk and tablet dosage form. Indo Am. J. Pharm. Res. 2014; 4: 1799-1803.
- Srinivasa R.P, Rama C.D, Murali K, Srinivasu S. Stability indicating isocratic reverse phase with PDA detector for the estimation of saxagliptin in bulk drugs and in its formulation. J. Pharm. Sci. 2013; 3: 333-342.
- Crepaldi G, Carruba M, Comaschi M, Del Prato S, Frajese G, Paolisso G. Dipeptidyl peptidase 4 (DPP-4) inhibitors and their role in type 2 diabetes management. Endocrinol. Invest. 2007; 30:610-614.
CrossRef - Sankar A.S.K, Suraj S. Development and validation for simultaneous estimation of sitagliptin and metformin in pharmaceutical dosage form using RP-HPLC method. J. Pharm Tech Res. 2013; 5:1736-1744.
- Sunil Reddy P, Raju T.V.R, Raju P.S, Varma N.S, Babu K.S. Development and validation of a stability-indicating RP-UPLC method for the estimation of impurities in cinacalcet hydrochloride API and its formulation. Pharm. 2015; 83: 583-598.
CrossRef - Krishna R.G, Pravalika K, Konda R, Harita V.A.N.V, Haritha G. Analytical method development and validation of remdesivir and griseofulvin in API and its dosage form by RP-HPLC. J. Drug Deliv. Tech. 2025; 15: 139-145.
CrossRef - Rakam G.K, Satya L.B, Samhitha D, Akash K.K, Krishna M.R.D and Charithaa K. Advances in Anti-Tubercular Agents: A Comprehensive Review. Pharmacol. J. 2025;18(1):547-558.
CrossRef - Venkateshwarlu P and Mehul. A Review: Method Development Validation and Degradation Studies of some Anticancer Drugs. Res J Pharma and Tech. 2021; 5443-5448.
CrossRef - Ganta K and S RAJA. Liquid chromatography-tandem–mass spectrometry bioanalytical technique for estimating favipiravir in pharmaceutical dose forms, both in bulk and in combination. J. Pharm. Clin. Res. 2025; 134-139.
CrossRef - Kuchi M and Raja Evaluation of antidiabetic activity of Indigofera prostrata on normal and streptozotocin induced diabetic albino wistar rats. J. Nat. Rem. 2024; 24(10):2217-2230.
CrossRef - Kuchi M and Raja S. Evaluation of antidiabetic activity of Abutilon crispum on normal and streptozotocin induced diabetic albino wistar rats. Pharmacol. Pharmacother. 2024;16(1):64-76.
CrossRef
 PlumX:
 Views: 811
  PDF Downloads:
16
PDF Downloads:
16