
Manuscript accepted on :15-01-2026
Published online on: 18-02-2026
Plagiarism Check: Yes
Reviewed by: Dr. Kiruthika Balasubramanian
Second Review by: Dr. M. K. Shukla
Final Approval by: Dr. Patorn Piromchai
Swati1 , Iffat Azim2, Akhilesh Singh3, Anil Kumar Soni4 and Vishnu Kumar Sahu5,6*
1BND Division, AcSIR, CSIR- National Physical Laboratory, New Delhi, India.
2Department of Biotechnology Engineering, Khwaja Moinuddin Chishti Language University, Lucknow, Uttar Pradesh, India.
3Department of Chemistry, K S Saket Post Graduate College, Ayodhya, Uttar Pradesh, India.
4Department of Chemistry, Shia Post Graduate College, Lucknow, Uttar Pradesh, India.
5Department of Chemistry, Maharani Lal Kunwari Post Graduate College, Balrampur, Uttar Pradesh, India.
6Chemistry Department, Shia Intermediate College, Lucknow, Uttar Pradesh, India.
Corresponding Author E-mail: vishnukr_sahu@rediffmail.com
Abstract
Protease inhibitors (PIs) remain a feasible option for the therapy of people living with HIV, particularly in complex clinical and virological circumstances. Nonetheless, they are linked to increased metabolic toxicity and drug-drug interactions, compared to newer drugs in this class. A comparative study of 51 HIV-1 protease inhibitors from the peptidic group was conducted, focusing on pharmacokinetic properties, site selectivity parameters, intermolecular interactions, and energy parameters to analyze their chemical-biological interactions, potentially offering strategies to enhance the development of superior anti-HIV medications within this category. The logarithms of the reciprocal of IC50 for the compounds mentioned above have been utilized as the biological endpoint (log1/C) in this research. The 3D modeling and minimum energy of all fifty-one compounds were obtained using CAChe 0.5 by opting for parametric model 3. All the regression equations were developed using Project Leader software, and statistical work was executed using Statistica 0.2. Research indicates that the optimal model is developed through pharmacokinetic properties. This further demonstrates that these characteristics (molecular weight and hydrogen bond acceptor) are essential for defining the pharmacokinetics of the medications. The findings from this study indicate that these terms can serve as indicators of biological activity, and the study will help to modify the existing HIV protease inhibitors into the required activity with minimal or no side effects.
Keywords
Effective Atomic Softness; Energy Based Parameters; Intermolecular Interaction; Peptidic HIV-1 Protease Inhibitor; Pharmacokinetic Property
| Copy the following to cite this article: Swati S, Azim I, Singh A, Soni A. K, Sahu V. K. Study of Peptidic HIV-1 Protease Inhibitors Based on Pharmacokinetics, Site Selectivity, Intermolecular Interaction and Energy Parameters. Biomed Pharmacol J 2026;19(1). |
| Copy the following to cite this URL: Swati S, Azim I, Singh A, Soni A. K, Sahu V. K. Study of Peptidic HIV-1 Protease Inhibitors Based on Pharmacokinetics, Site Selectivity, Intermolecular Interaction and Energy Parameters. Biomed Pharmacol J 2026;19(1). Available from: https://bit.ly/4aqGkQu |
Introduction
By the close of 2024, around 40.8 million individuals worldwide are estimated to be living with HIV, alongside 630,000 HIV-related deaths and 1.3 million new infections occurring that year. As of 2023, it is estimated that more than 2.5 million individuals are living with HIV in India. This statistic is derived from the 2023 India HIV Estimations report, which also mentions a national adult HIV prevalence of 0.2% and approximately 66,400 new infections each year.1,2
The cost of HIV treatment differs greatly depending on the location and medication type, with annual expenses in the US possibly soaring to tens of thousands of dollars, whereas in countries like India, generic medications have reduced monthly costs to approximately $66 – $90 USD, and some government initiatives have made it even more affordable. Even though many new drugs have received approval from the US FDA and are effective in reducing the disease and death associated with HIV infection, their exorbitant prices are unaffordable for the majority.3-5
The FDA has authorized over 50 HIV treatments in total, comprising standalone medications and combination therapies. There are more than 40 distinct antiretroviral medications and 22 fixed-dose combination therapies authorized for the treatment of HIV infection. These medications have thoroughly documented adverse effects, and instances of resistance development have also been noted. Therefore, there will probably be a constant demand for new anti-HIV drugs.6,7
The initial stage of HIV-1 infecting target cells includes the interaction between gp120 (the virus’s external envelope glycoprotein) and the host cell’s CD4 (main receptor). The attachment of the gp120-CD4 complex initiates further conformational modifications in the envelope glycoproteins, causing the fusion of the viral membrane with the target cell membranes and allowing entry into the host cells. After the virus enters the host cells, its genetic material, RNA, is released, and an enzyme in HIV known as reverse transcriptase facilitates the transformation of viral RNA into DNA. The viral DNA penetrates the nucleus of the host cell and integrates with the host cell’s genetic material. The enzyme integrase in HIV-1 facilitates this process. After viral DNA merges with the host cells, it is converted into messenger RNA (mRNA), which is subsequently translated into viral proteins. The new viral RNA and viral proteins gather at the cell membrane to form a new virus. HIV protease, a viral enzyme, is crucial for cutting other HIV proteins into their active forms. After the genetic material and functional proteins are assembled at the cell surface, the virus exits the cell and is prepared to infect host cells.8
Medicinal chemists recognize that each phase of the HIV replication cycle can be viewed as a possible target for antiviral treatment. They concentrated their efforts on these processes: (a) viral binding to target cells, (b) virus-cell fusion, (c) virus uncoating, (d) reverse transcription of genomic RNA, (e) viral integration, (f) gene expression, and (g) protease activity.8
However, this research focuses solely on inhibitors of HIV protease. HIV protease, crucial for the maturation of HIV particles, was proposed by Kramer et al.9 as a possible target for AIDS treatment. Inhibiting HIV protease causes viral particles to remain immature and non-infectious. Compounds that can inhibit this protease have been thoroughly researched over the past thirty years.10 In 1995, the US FDA granted approval for ‘Saquinavir’ for clinical use. Currently, there are seven HIV protease inhibitors (saquinavir, darunavir, atazanavir, lopinavir, fosamprenavir, nelfinavir, and ritonavir) utilized in HAART.11 Extended usage reveals lipodystrophy, hyperlipidemia, insulin resistance, and the development of resistant mutants.12 Therefore, there is a constant demand for new HIV protease inhibitors or modify the existing ones into required activity with minimal or no side effect.
In our latest publications, we concentrate on fifty-one peptidic inhibitors of HIV protease. In these articles, our research team examined the pharmacokinetics13 of these inhibitors and analyzed their interactions (hydrophobic,14 polar,15 and intermolecular16) with the receptor protein as well. In our earlier publications on RTIs17, 18 and PIs, several studies based on QSAR have also been conducted.19-20 The current study includes a comparative analysis of all prior works alongside some new contributions.
Materials and Methods
The study materials for this work are 51 protease inhibitors of the peptidic group (listed in Table 1-17).21,22 In this work, a comparative QSAR study of the peptidic group of HIV-1 protease inhibitors was developed using pharmacokinetic properties, effective atomic softness, parameters of intermolecular interaction, and energy-based descriptors, as listed in Table 1-17. Initially, all descriptor groups were utilized for fifty-one compounds. Subsequently, various QSAR models were created for each combination of descriptors, from which only the top five models for each descriptor set were selected.
The 3D modeling and geometric optimization of all compounds have been conducted using Fujitsu’s CAChe Pro 5.0 (www.CACheSoftware.com) by opting a semiempirical method based on the Schrödinger equation.23 Currently, the widely used SCF semiempirical methods include AM1 (Austin Method 1)24 and PM3 (Parametric Method 3). AM1 and PM3 operate comparably and generally yield decent geometries. This study utilizes the PM3 Hamiltonian, as our earlier research using PM3 techniques yields favorable outcomes.13-18 The PM3 computations were conducted using MOPAC 2002 V1.3 linked with CAChe.25 Multivariable linear regression has been conducted using the Project Leader software associated with CAChe.
The dependability of the suggested models was evaluated through the statistical analysis conducted using Statistica 0.2 (www.statistica.com). Various statistical measures are available for assessing the significance of the model. The most commonly used are n (number of molecules >20 molecules); r2 (correlation coefficient and >0.5 has predictive power); r2CV (cross validation coefficient >0.25 has predictive power); k (number of descriptors in a model and statistically n/5 descriptors in a model); df (degrees of freedom, n-k-1, where higher is better); p-value (probability value, where smaller is better; p < 0.1, p close to 0 is very unlikely to happen by chance if the null is true, suggesting a real effect); and f (f-test for statistical significance of the model, where higher is better, for the same set of descriptors and compounds).
 |
Table 1: Compounds, biological activities, predicted activities and descriptors of first to fourth groups |
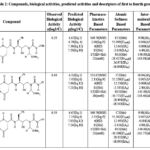 |
Table 2: Compounds, biological activities, predicted activities and descriptors of first to fourth groups |
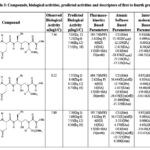 |
Table 3: Compounds, biological activities, predicted activities and descriptors of first to fourth groups |
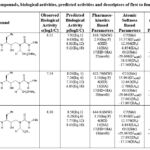 |
Table 4: Compounds, biological activities, predicted activities and descriptors of first to fourth groups |
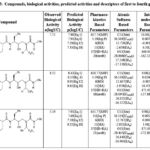 |
Table 5: Compounds, biological activities, predicted activities and descriptors of first to fourth groups |
 |
Table 6: Compounds, biological activities, predicted activities and descriptors of first to fourth groups |
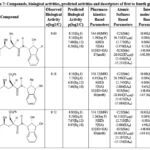 |
Table 7: Compounds, biological activities, predicted activities and descriptors of first to fourth groups |
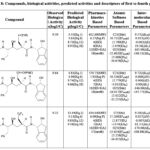 |
Table 8: Compounds, biological activities, predicted activities and descriptors of first to fourth groups |
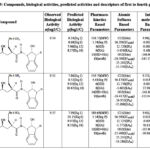 |
Table 9: Compounds, biological activities, predicted activities and descriptors of first to fourth groups |
 |
Table 10: Compounds, biological activities, predicted activities and descriptors of first to fourth groups |
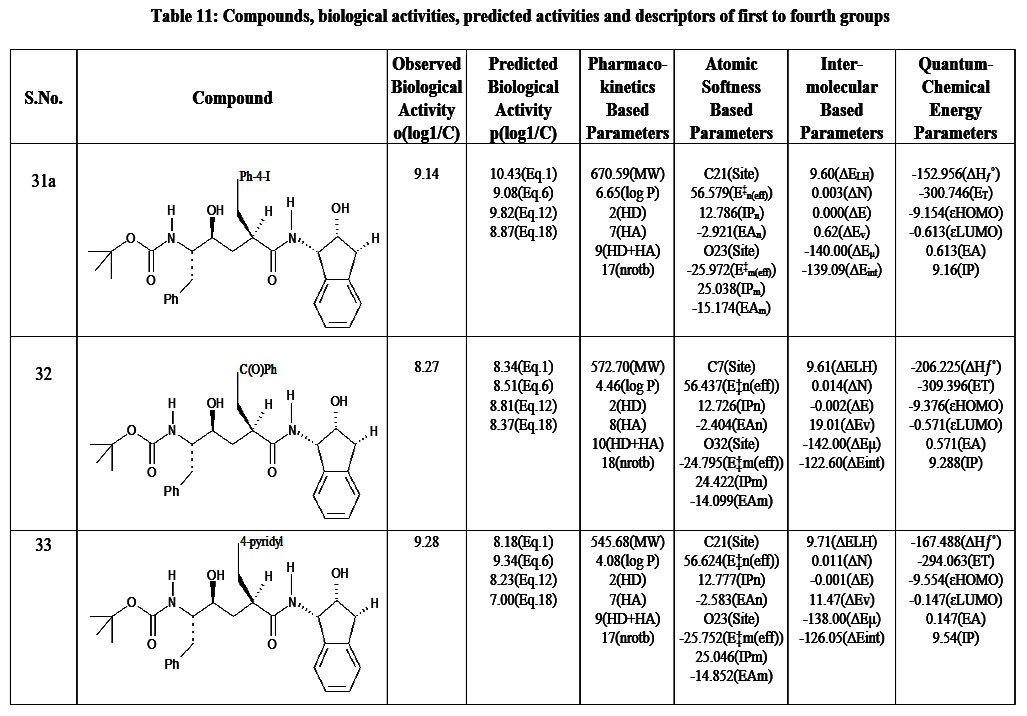 |
Table 11: Compounds, biological activities, predicted activities and descriptors of first to fourth groups |
 |
Table 12: Compounds, biological activities, predicted activities and descriptors of first to fourth groups |
 |
Table 13: Compounds, biological activities, predicted activities and descriptors of first to fourth groups |
 |
Table 14: Compounds, biological activities, predicted activities and descriptors of first to fourth groups |
 |
Table 15: Compounds, biological activities, predicted activities and descriptors of first to fourth groups |
 |
Table 16: Compounds, biological activities, predicted activities and descriptors of first to fourth groups |
 |
Table 17: Compounds, biological activities, predicted activities and descriptors of first to fourth groups |
Results
Our previous studies include: (i) an extended rule of five and assessment of biological activity,13 (ii) drug-receptor interactions of these fifty-one peptidic HIV-1 protease inhibitors based on hydrophobic,14 polar15 and intermolecular interactions.16 In this research, all the findings from the aforementioned studies are utilized as descriptors for this analysis. To achieve this, the descriptors identified from the research were categorized into four groups. The first group involves pharmacokinetics based studies. The values of log P, molecular weight, number of hydrogen bond donors, number of hydrogen bond acceptors and their sum, and number of rotatable bonds are listed in Table 1-17.The second group involves site selectivity based on effective atomic softness. The atomic softness of each site of each compound was evaluated by softness calculator and is tabulated in Table 1-17. The third group involves intermolecular interactions based on interaction energy, shifting of charges, lowering of energy and energies of frontier orbitals. For this absolute electronegativity of each compound and the receptor amino acids were calculated by equations described in our previous work.16 After classifying each compound as either acid or base, the values of charge transfer, energy lowering of the complexes, and interaction energies were also be calculated and tabulated in Table 1-17, as well documented in the same work.16 The fourth group involves quantum chemical energy based on heat of formation, total energy, energy of the highest occupied molecular orbital, energy of the lowest unoccupied molecular orbital, ionization potential of molecules, and electron affinity of molecules. All these energies were calculated by CAChe and tabulated in Table 1 17. After obtaining the values of all the above four groups of descriptors as listed in Table 1-17, a multivariate regression study was performed and numerous equations were developed (aData points not included in deriving regression equation). The selected equations are presented in discussion section below.
Discussion
The chemistry of a drug is based on its pharmacokinetics, site selectivity, followed by interaction with its receptor, and performance of its action. For the sake of simplicity these steps have been discussed in separate sections based on their chemistry and application, as descriptors.
Pharmacokinetics Properties as Descriptors
The progression of medications and their impacts within the body is statistically measured by pharmacokinetics (PK) research.26 PK encompasses absorption (A), distribution (D), metabolism (M), excretion (E), and toxicity (T) of medications, referred to as ADMET.27 The creation of a suitable medication plan relies on these ADMET factors. Lipinski28 indicates that the majority of “drug-like” compounds possess log P ≤ 5, molecular weight ≤ 500, hydrogen bond acceptors ≤ 10, and hydrogen bond donors ≤ 5. Molecules that contravene multiple rules might experience issues with bioavailability. The principle is referred to as the “Rule of 5,” since the boundary values are 5, 500, 2 × 5, and 5.29,30 In generating QSAR models for this dataset, log1/C values functioned as dependent variables while MW, log P, HD, HA, HD +HA, and nrotb (listed in Table 1-17) served as the independent variables. Multivariable linear regression was conducted employing various combinations of the aforementioned descriptors to generate numerous models, however, only the top five models (Eq.1 to 5) are presented here.
p(log1/C) = 0.0254 × MW -0.528 × HA -1.995
r2=0.646, r2CV =0.616, n =39, k =2, df =36, Eq.1
p =0.000, f =26.86
p(log1/C) = 0.0217 × MW -0.0822 × log P -0.0342 × HD -0.492 × HA +0.268
r2=0.541, r2CV =0.407, n =39, k =4, df =34, Eq.2
p =0.000, f = 13.87
p(log1/C) = 0.0217 × MW -0.0819 × log P -0.241 × HD -0.676 × HA +0.195 × HD+HA +0.187
r2=0.542, r2CV =0.377, n =39, k =5, df =33, Eq.3
p =0.000, f = 10.89
r2=0.543, r2CV =0.380, n =39, k =5, df =33, Eq.4
We know that if a descriptor has positive coefficient value (+), it means a direct relationship exists between descriptor and activity. While a negative coefficient value (-) shows an inverse relationship. Equations 1 to 5 show that MW has a positive coefficient value; thus, it has a direct relationship with activity. log P shows an inverse relationship with activity. HD and HA also have an inverse relationship, but their sum has direct relationship. The nrotb also has direct relationship.
The comparison between observed activity and predicted activities (obtained from the above five models) of the compounds is presented in the form of correlation matrix plot (Figure 1). This plot is a graphical representation of a scatterplot matrix, which illustrates the correlation coefficients among several variables in a dataset. It indicates strength and direction (positive/negative) through colors, facilitating the quick identification of patterns such as strong correlations (darker colors, values close to 1 or -1) or lack of correlation (lighter/white, around 0). Among the QSAR models mentioned above, Eq.1 represents the top model. This selection is based on the value of statistical parameters: r2, r2CV, n, k, df, p, and f, as described in methodology. The model’s descriptors include molecular weight (MW) and the HA (number of hydrogen bond acceptors), with correlation coefficients of 0.646 and 0.616 for cross-validation. Figure 2 presents the standard probability plot of the residuals as obtained from this model.
 |
Figure 1: Plot of the correlation matrix between predicted activities p(log1/C) and actual biological activities o(log1/C) for peptide-based HIV-1 protease inhibitors |
 |
Figure 2: Standard probability plot of the residuals as obtained from Eq.1 |
Site Selectivity Parameters as Descriptors
Chemical interaction between metal ions and bases was described by Klopman in terms of softness parameters (E‡n for metal ion and E‡m for base).31 Through straightforward adjustments of established techniques, Singh et al.32 updated it for a broad range of acids and bases, and they also broadened their applications to interpreting biochemical reactions,33 as well as ligand-receptor interactions of testosterone,34 estrogen,35 and tetrahydroimidazo-benzodiazepinone.18 Here, we have utilized E‡n(eff) and E‡m(eff), along with their variation ΔE‡nm, to assess site selectivity and polar interactions of the above mentioned PIs and with their receptor protein. ΔE‡nm values obtained from drug-receptor interactions specify the degree of interaction. In constructing QSAR models for this dataset, log1/C values were utilized as dependent variables, with E‡n(eff) and E‡m(eff), ionization potential (IPn and IPm), and electron affinity (EAn and EAm) of electrophilic (n) and nucleophilic sites (m) serving as the independent variables (listed in Table 1-17). The top five models as obtained from this group of descriptors (Eq.6 to 10) are:
× EAm -138.935 × E‡m(eff) +413.793 Eq.6
117.861 × E‡m(eff) +394 Eq.7
× E‡m(eff) +130.598 Eq.8
Figure 3 displays the correlation matrix plot of observed activities against predicted activities (presented in Table 1-17). Among the QSAR models presented, Equation 6 is the most effective model. The model’s descriptors include ionization potential (+), electron affinity (+), and effective atomic softness (-) for both electrophilic and nucleophilic sites, with correlation coefficients of 0.651 and 0.405, respectively. The standard probability plot of the residuals, as obtained from this model, is presented in Figure 4. Note: the negative sign and positive sign in brackets show inverse and direct relationships with activity, respectively.
 |
Figure 3: Plot of the correlation matrix between predicted activities p(log1/C) and actual biological activities o(log1/C) for peptide-based HIV-1 protease inhibitors |
 |
Figure 4: Standard probability plot of the residuals as obtained from Eq.6. |
Parameters of Intermolecular Interaction as Descriptors
Charge transfer from donor to acceptor was used to examine intermolecular interactions, resulting in the electron flux shifting from the one molecule to another molecule,36 under investigation. Hence, a reduction in the energy of the system being studied will take place.37 The interaction energy38 resulting from this was also examined, clearly illustrating the feasibility of the interactions. Non-bonding interaction relies on (i) the transfer of charge (ΔN), (ii) the reduction of energy (ΔE), (iii) the energy of interaction (ΔEint.), and is accompanied by (iv) a change in the energies of frontier orbitals (ΔELH). These properties were well documented in our recent publication.16 In creating QSAR models for this set, the independent variables included ΔELH, ΔN, ΔE, ΔEv, ΔEμ, and ΔEint (listed in Table 1-17), while log1/C values represented the dependent variable. Equations 11 to 15 presented below are the five reliable models:
ΔEv +0.009 × ΔEμ +72.71 Eq.11
ΔEv -0.004 × ΔEμ +70.967 Eq.12
ΔEv +1.340 × ΔEμ – 1.336 × ΔEint +62.302 Eq.13
ΔEv -1.107 × ΔEμ +1.099 × ΔEint +85.676 Eq.15
The activities (presented in Table 1-17) that were observed and forecasted are illustrated in Figure 5 as a correlation matrix plot. Among the QSAR models presented above, Eq.12 is the top model. The model’s descriptors include ΔELH (-), ΔN (-), ΔE (+), ΔEv (+), and ΔEμ (-), with correlation coefficients and cross-validation results of 0.621 and 0.558. Figure 6 presents standard probability plot of the residuals as obtained from this model. Note: The negative sign and positive sign in brackets show inverse and direct relationship with activity, respectively.
 |
Figure 5: Plot of the correlation matrix between predicted activities p(log1/C) and actual biological activities o(log1/C) for peptide-based HIV-1 protease inhibitors |
 |
Figure 6: Standard probability plot of the residuals as obtained from Eq.12. |
Energy Parameters as Descriptor
In the creation of QSAR models for this dataset, while log1/C values were utilized as dependent variables, quantum chemical energy descriptors,39 such as ΔHƒ˚, ET, ɛHOMO, ɛLUMO, EA, and IP served as the independent variables (listed in Table 1-17). The selected five models of this group are shown by Eqs.16 to 20:
The activities (presented in Table 1-17) that were observed and forecasted are illustrated in Figure 7 as a correlation matrix plot. In the QSAR models mentioned above, Eq.18 stands out as the most effective model. The descriptors of this model are heat of formation (+), total energy (+), HOMO energy (+), LUMO energy (-), and ionization energy (-). The model’s correlation coefficient and cross-validation correlation coefficient are 0.641 and 0.580, respectively. Figure 8 presents standard probability plot of the residuals as obtained from this model. Note: The negative sign and positive sign in brackets show inverse and direct relationship with activity, respectively.
 |
Figure 7: Plot of the correlation matrix between predicted activities p(log1/C) and actual biological activities o(log1/C) for peptide-based HIV-1 protease inhibitors |
 |
Figure 8: Standard probability plot of the residuals as obtained from Eq.18. |
For comparative study, regression summary of top models from the four sets as listed in Table 18.
Table 18. Comparative regression summary of top models of the four sets
| QSAR | r2 + r2CV | n | k | df | p | f |
| Eq.1 | 1.262 | 39 | 2 | 36 | 0.000 | 26.86 |
| Eq.6 | 1.056 | 40 | 6 | 33 | 0.000 | 10.26 |
| Eq.12 | 1.166 | 42 | 5 | 36 | 0.003 | 4.37 |
| Eq.18 | 1.221 | 41 | 5 | 35 | 0.000 | 12.48 |
The study indicates that the optimal QSAR model i.e., Eq.1 (p(log1/C) = 0.0254 × MW -0.528 × HA -1.995) is derived from PK parameters: molecular weight and hydrogen bond acceptor. This model has been screened out by sum of the correlation coefficient and cross-validation correlation coefficient values (1.262), along with other regression metrics including k (2), df (36), and f (26.86) values. Consequently, descriptors based on pharmacokinetic properties can more accurately forecast the efficacy of peptidic inhibitors of HIV-1 protease. PKs (ADMET)27 are crucial for assessing a compound’s viability for human therapeutic applications, as approximately fifty percent of drugs in development do not reach the market due to inadequate pharmacokinetics. The RO5 indicates that molecular weights exceeding 500 are unfavorable, resulting in reduced absorption.29,30 Van de Waterbeemd and coworkers40 have similarly recommended that a lower molecular weight enhances oral absorption. A significant hydrogen bonding capacity, either as a donor or acceptor, combined with considerable steric hindrance, hampers effective permeation. Naturally, hydrogen bonding influences membrane transport and the distribution of drugs throughout the biological system. Elevated levels might hinder permeability through the membrane bilayer. The quantity of hydrogen bond donors and acceptors influences,41-43 the physicochemical characteristics (solubility, adsorption, distribution) of a molecule, thereby impacting a drug’s effectiveness. Further, RO5 indicates that to enhance permeation and absorption, a ligand should have fewer than 5 donors and 10 acceptors of H-bonds.29,30 Findings from this research indicate that these descriptors can serve as indicators of biological activity.
Conclusion
Protease inhibitors are viable for HIV therapy despite metabolic toxicity and drug interactions. The optimal QSAR model predicts HIV-1 protease inhibitor efficacy using pharmacokinetic-based descriptors. High-quality pharmacokinetic characteristics (ADMET) are essential for drug utility. The study emphasizes the importance of these PK descriptors for improving permeation, absorption, and biological activity to minimize the side effects.
Acknowledgement
We express our gratitude to the Principal and Head of the Chemistry Department at Shia P. G. College, Sitapur Road, Lucknow-226020(U.P.) and Maharani Lal Kunwari P.G. College, Tulsipur Road, Balrampur-271201(U.P.) for providing laboratory facilities. The paper is dedicated to our cherished educator and guide, esteemed Professor (Dr.) P. P. Singh (D.Sc., F.A.N.Sc., and recipient of the Bharat Shiksha Ratana Award) as we celebrates his 94th birthday.
Funding Sources
The author(s) received no financial support for the research, authorship, and/or publication of this article.
Conflict of Interest
The author(s) do not have any conflict of interest.
Data Availability Statement
This statement does not apply to this article.
Ethics Statement
This research did not involve human participants, animal subjects, or any material that requires ethical approval.
Informed Consent Statement
This study did not involve human participants, and therefore, informed consent was not required.
Clinical Trial Registration
This research does not involve any clinical trials
Permission to reproduce material from other sources
Not Applicable
Author Contributions
- Swati: Edited and designed the manuscript;
- Iffat Azim: All image work;
- Anil Kumar Soni and Vishnu Kumar Sahu: All calculation work.
- Akhilesh Singh: Revised the manuscript, edited all the grammatical and typographical errors.
References
- Payagala S, Pozniak A. The global burden of HIV. Clin Dermatol. 2024;42(2):119-127.
CrossRef - Burke RM, Sabet N, Ellis J, et al. Causes of hospitalization among people living with HIV worldwide, 2014-23: a systematic review and meta-analysis. Lancet HIV. 2025;12:e355-e366.
CrossRef - Ten Brink D, Martin-Hughes R, Bowring, A.L, et al. Impact of an international HIV funding crisis on HIV infections and mortality in low-income and middle-income countries: a modelling study. The Lancet HIV, 2025; 12(5):e346 – e354.
CrossRef - UNAIDS urges that all essential HIV services must continue while U.S. pauses its funding for foreign aid https://www.unaids.org/en/resources/presscentre/pressreleaseandstatementarchive/2025/february/20250201_us-funding
- The Lancet HIV US funding for HIV at risk again. Lancet HIV.2024;11:e495.
CrossRef - Gandhi RT, Landovitz RJ, Sax PE, et al. Antiretroviral drugs for treatment and prevention of HIV in adults: 2024 recommendations of the International Antiviral Society–USA panel. Jama, 2025;333(7):609-628.
CrossRef - Tichy EM, Rim MH, Cuellar S, et al. National trends in prescription drug expenditures and projections for 2025. Am J Health-Syst. Pharm. 2025;82(14):806-821.
CrossRef - Debnath AK. Application of 3D-QSAR techniques in anti-HIV-1 drug design-an overview. Curr Pharm Des. 2005;11(24):3091-3110.
CrossRef - Kramer RA, Schaber MD, Skalka AM, et al. HTLV-III gag Protein Is Processed in Yeast Cells by the Virus pol-Protease. Science, 1986;231:1580-1585.
CrossRef - Kramer RA, Affeldt M, Volkmer-Engert R, Schneider-Mergener J. A novel type of protease cleavage assay based on cellulose-bound peptide libraries. In PEPTIDES-EUROPEAN SYMPOSIUM-1999;546-547.
- Lv Z, Chu Y, Wang Y. HIV protease inhibitors: a review of molecular selectivity and toxicity. HIV AIDS (Auckl). 2015;7:95-104.
CrossRef - Sempere A, Alonso R, Berrocal L, et al. The Role of Protease Inhibitors in HIV Treatment: Who Still Needs Them in 2025? Infect Dis Ther. 2025;14(11):2551-2563.
CrossRef - Sahu VK, Singh RK, Singh PP, Extended Rule of Five and Prediction of Biological Activity of Peptidic HIV-1-PR Inhibitors. UJP. 2022;3(1):20-42.
CrossRef - Sahu VK, Singh RK, Singh PP, Drug-Receptor Interaction of Peptidic HIV-1 Protease: The Hydrophobic Effect-I. OJMR. 2022; 1: 33-48.
CrossRef - Sahu VK, Singh RK, Singh PP, Drug-Receptor Interaction of Peptidic HIV-1 Protease: Polar Effect-II. OJMR. 2022; 2: 1-11.
CrossRef - Sahu VK, Chandra N, Soni AK. Drug-Receptor Interaction of Peptidic HIV-1 Protease: Intermolecular Interaction-III. OJMR. 2023;3(1):1-22.
CrossRef - Sahu VK, Khan AKR, Singh RK, Singh PP. Hydrophobic, Polar, Hydrogen binding Based Drug-Receptor Interaction of Tetrahydroimidbenzodiazepinones. Am J Immunol. 2008;4(3):33-42.
CrossRef - Sahu VK, Khan AKR, Singh RK, Singh PP. Drug-Receptor Interaction-Based Quantitative Structure-Activity Relationship of Tetrahydroimidazodiazepinone. Int J Quantum Chem. 2009;109:1243-1254.
CrossRef - Singh PP, Sahu VK. Quantum Chemistry Based QSAR Study on HIV Drugs of Protease (PR) Groups and New Drugs Proposed. Mat Sci [AIJ]. 2007;3(1):55-63.
- Singh PP, Sahu VK, Singh P, Singh RK. Hydrophobic, Topological and Steric Parameter Based QSAR Study on Peptidic HIV- Protease Org Chem [AIJ]. 2008;4(4):284-294.
- Getman DP, DeCrescenzo GA, Heintz RM, et al. Discovery of a novel class of potent HIV-1 protease inhibitors containing the (R)-(hydroxyethyl)urea isostere. J Med Chem. 1993;36:288-291.
CrossRef - Holloway MK, Wai JM, Halgren TA, et al. A priori prediction of activity for HIV-1 protease inhibitors employing energy minimization in the active site. J Med Chem. 1995;38:305-317.
CrossRef - Stewart JJP. Optimization of parameters for semiempirical methods I. J Comput Chem. 1989; 10: 209-220.
CrossRef - Dewar MJS, Zoebisch EG, Healy EF, Stewart JJP. Development and Use of Quantum Mechanical Molecular Models. 76. AM1: A New General Purpose Quantum Mechanical Molecular Models. J Am Chem Soc. 1985; 107: 3902-3909.
CrossRef - Stewart JJP. MOPAC: A General Molecular Orbital Package. J Compu Aid Mol Design. 1990; 4: 1-105.
CrossRef - Williams DA, Lemke TL. Drug Design and relationship of Functional Groups to Pharmacologic Activity; chapter 2, Principles of Drug Discovery; part 1, Foye’s Principles of Medicinal Chemistry 5th 2002;37-67.
- Norinder U, Bergstrom CAS. Prediction of ADMET Properties. Chem Med Chem. 2006;1:920–937.
CrossRef - Lipinski CA. Drug-like properties and the causes of poor solubility and poor permeability, J Pharmacol Toxicol Methods. 2000;44:235-249.
CrossRef - Lipinski CA. Chris Lipinski discusses life and chemistry after the Rule of Five. Drug Discov. Today. 2003;8:12-16.
CrossRef - Lipinski CA. Lead- and drug-like compounds: the rule-of-five revolution. Drug Discov Today: Technologies. 2004;1:337-341.
CrossRef - Klopman G. Chemical reactivity and the concept of charge- and frontier-controlled reactions. J Am Chem Soc. 1968;90(2):223–234.
CrossRef - Singh PP, Srivastava SK, Srivastava AK. A Matching Between Lewis Acids and Lewis Bases on The Basis of Quantitative Softness Values and Their Relation With The Stability of The Complexes-I. J Inorg Nucl Chem. 1980;42:521-532.
CrossRef - Singh PP, Pasha FA, Srivastava HK. DFT Based Atomic Softness and Its Application in Site Selectivity. QSAR Comb Sci. 3003;22(8):843-851.
CrossRef - Srivastava HK, Pasha FA, Singh PP. Atomic softness-based QSAR study of testosterone. Int J Quantum Chem. 2005;103(3):237-245.
CrossRef - Pasha FA, Srivastava HK, Singh PP. Semiempirical QSAR study and ligand receptor interaction of estrogens. Mol Divers. 2005;9:215–220.
CrossRef - Mendez F, Gazquez JL. The fukui function of an atom in a molecule: A criterion to characterize the reactive sites of chemical species. Proc Indian Acad Sci.1994;106:183-193.
CrossRef - Singh D, Ahmad S, Singh PP. DFT based calculation of interaction energy between metal halides and organic bases. Mol. Stru. (THEOCHEM). 2009;905:13-23.
CrossRef - Singh RK, Khan MA. Interaction energy-based drug–receptor interaction study of metal–bicyclam complexes. J. Quantum Chem.2011;111:4174-4185.
CrossRef - Singh RK, Sahu VK, Khan SA, Singh PP. QSAR Study of Peptidic HIV-1 Protease Inhibitors. JACR. 2011;18:35-50.
- Van de Waterbeemd H, Smith DA, Beaumont K, Walker DK. Property-based design:optimization of drug absorption and pharmacokinetics. J Med Chem. 2001;44:1313-1333.
CrossRef - Platts JA. Theoretical prediction of hydrogen bond donor capacity. Phys Chem Chem Phys. 2000;2:973-980.
CrossRef - Raevsky OA, Schaper KJ. Quantitative estimation of hydrogen bond contribution to permeability and absorption processes of some chemicals and drugs. Eur J Med Chem. 1998;33:799-807.
CrossRef - Alkorta I, Elguero J. Hydrogen bond acceptor properties of two radicals: nitric oxide molecule and hydrogen atom. ARKIVOC. 2003; 14:31-36.
CrossRef
Abbreviations List
ADMET – Absorption, Distribution, Metabolism, Excretion, and Toxicity
AIDS – Acquired Immunodeficiency Syndrome
Asp – Aspartic acid
CAChe – Computer Added Chemistry
3D – Three Dimension
df – Degree of Freedom
E‡m – Softness of electron donor site
E‡m(eff) – Effective Atomic Softness of Base
E‡n – Softness of electron acceptor site
E‡n(eff) – Effective Atomic Softness of Acid
EA – Electron Affinity
EAm – Electron Affinity of Electron Donor Site
EAn – Electron Affinity of Electron Acceptor Site
ET – Total energy
ɛHOMO – Energy of HOMO
ɛLUMO – Energy of LUMO
f – F-test is a value of two variances
FDA – Food and Drug Administration
Gly – Glycine Amino Acid
HA – Hydrogen Bond Acceptor
HAART – Highly Active Antiretroviral Therapy
HD – Hydrogen Bond Donor
HIV – Human Immunodeficiency Virus
HOMO – Highest Occupied Molecular Orbital
IC50 – Half Maximum Inhibitory Concentration
Ile – Isoleucine Amino Acid
IP – Ionization Potential
IPm – Ionization Potential of Electron Donor Site
IPn – Ionization Potential of Electron Acceptor Site
k – Number of Descriptor
LUMO – Lowest Unoccupied Molecular Orbital
MOPAC – Molecular Orbital PACkage
MW – Molecular Weight
nrotb – Number of Rotatable Bond
p – Probability Value
PIs – Protease Inhibitors
PK – Pharmacokinetics
PM3 – Parametric Model 3
QSAR – Quantitative Structure Activity Relationship
r2 – Correlation Coefficient
r2CV – Cross-validation Correlation Coefficient
RNA – Ribonucleic Acid
RO5 – Rule of Five
RTIs – Reverse Transcriptase Inhibitors
Thr – Threonine Amino Acid
US – United States
USD – United States Dollar
Val – Valine Amino Acid
ΔE – Energy Lowering
ΔE‡nm – Deference of E‡n and E‡m
ΔEint – Interaction Energy
ΔEv –
ΔEμ –
ΔHƒ˚ – Standard Heat of Formation
ΔN – Charge Transfer
ΔΕLH – Difference of energy of LUMO and HUMO

