
Manuscript accepted on :10-11-2025
Published online on: 21-01-2026
Plagiarism Check: Yes
Reviewed by: Dr. Heamn Noori and Dr. Nataliya Kitsera
Second Review by: Dr. Abidin Çalişkan
Final Approval by: Dr. Anton R Keslav
Ambuj Kumar Agarwal1* , Abu Bakar Bin Abdul Hamid2, Danish Ather3, Raj Gaurang Tiwari4, Indrajit De5and Kunchanapaalli Rama Krishna6
1Department of Computer Science and Engineering, Sharda School of Engineering and Technology, Sharda University, Greater Noida, India.
2Department of Computer Science and Engineering, Kuala Lumpur University of Science & Technology (KLUST) (formerly known as Infrastructure University Kuala Lumpur (IUKL), Unipark Suria, Jalan Ikram-Uniten, Kajang, Selangor, Malaysia.
3Department of Computer Science and Engineering, Amity University in Tashkent, Uzbekistan.
4Department of Computer Science and Engineering, Chitkara University Institute of Engineering and Technology, Chitkara University, Punjab, India.
5Department of CSE (AIML) and CSBS, IEM-IIT joint center of research, IEM-UEM Kolkata, India.
6Department of CSIT, K L Deemed to be University, Vaddeswaram, Andhra Pradesh, India.
Corresponding Author E-mail: ambuj4ugmail.com
Abstract
Diabetic retinopathy (DR) is a major cause of preventable blindness, and early detection is essential for preserving sight. Manual grading of retinal fundus images is time-consuming and depends on specialist expertise. This study presents a method for automatic five-level DR grading that pays specific attention to lesion regions and respects the ordered nature of disease severity. The approach begins by enhancing fundus images and identifying small lesion areas, such as microaneurysms and exudates, using vessel suppression and morphological filters. These lesion areas are converted into compact features and combined with standard image patches to guide the network towards medically relevant regions. A ConvNeXt-V2 stem is used to keep local texture details, while a Swin-V2 transformer head captures broader retinal structure. The model is trained with an ordinal loss to reflect the progression of DR and uses focal weighting to reduce the effect of class imbalance. After training, temperature scaling is applied to improve prediction confidence. Experiments on the APTOS-2019 dataset show an accuracy of 84.6%, a macro-F1 score of 0.707, and a quadratic weighted kappa of 0.812. The method performs especially well on advanced disease stages and produces clear visual explanations that match known lesion patterns. These results indicate that combining lesion-focused features with ordinal learning leads to more reliable and clinically meaningful DR grading.
Keywords
Diabetic Retinopathy; Fundus Images; Grad-CAM; Lesion-Aware Attention; Medical AI; Ordinal Classification; Transformers
| Copy the following to cite this article: Agarwal A. K, Hamid A. B. B. A, Ather D, Tiwari R. G, De I, Krishna K. R. Lesion-Aware Ordinal Transformer for Diabetic Retinopathy Classification from Fundus Images. Biomed Pharmacol J 2026;19(1). |
| Copy the following to cite this URL: Agarwal A. K, Hamid A. B. B. A, Ather D, Tiwari R. G, De I, Krishna K. R. Lesion-Aware Ordinal Transformer for Diabetic Retinopathy Classification from Fundus Images. Biomed Pharmacol J 2026;19(1). Available from: https://bit.ly/4bFoFoX |
Introduction
Diabetic retinopathy (DR) is a common diabetes mellitus complication that results in injury to smaller blood vessels found in the retina and if undetected early enough leads to blindness. Routine screening with colour fundus photographs allows clinicians to diagnose the disease early but is time-consuming with manual reading depending on specialist time. In the majority of hospitals, especially with high volume demand, rapid grading for every image is difficult. As a result of this, computer-based systems able to interpret DR stage from fundus photographs with automated classification are gaining increasing emphasis in recent years. Recent survey as well as research articles confirm that deep learning models can assist screening programs by increasing consistency as well as speed without compromising good accuracy.1-3
In practice, DR screening problems are either (i) classifying presence or absence of DR as binary, or (ii) grading severity into five ordered grades (no, mild, moderate, severe, proliferative). Task (ii) is closer to clinician requirements because referral time and follow-up depend on grading. It is also harder because microaneurysms constitute low-contrast objects with low size, because images were taken with different cameras, and because data include high imbalance (many fewer severe than normal). Most models developed as plain multi-class classifiers unnecessarily waste inherent order present within labels, and they also often fail to discriminate between neighboring grades e.g. mild vs. moderate. Surveys including supervised, unsupervised and semi-supervised approaches confirm that class imbalance, distribution shift between domains across different datasets, and limited interpretability constitute open problems for 2024–2025 literature.1,4
Strong baselines take transfer learning with recent CNN backbones or light ensembles. An MDPI paper trained RegNet and EfficientNet versions on publicly available data and showed high accuracy for binary but good results only for five-class grading but smaller improvements for real data with a gap between close and open setups.2 Taylor & Francis work took a prudent two-stage pipeline: informative region detection first then severity classification with additional Grad-CAM explanation-based reasoning; such a pipeline made such a method more reliable but still flatly regarded the five grades as classes.3 Author explored hybrid schemes combining meta-heuristic feature selection or adaptation with deep networks and showed incrementally improving results on standard datasets but failed to adequately exploit calibration or ordinal nature for application to clinics.5,6 On interpretability, an IEEE Transactions on Biomedical Engineering paper penned in 2024 proposed biomarker activation maps to link heatmaps to lesion types with much promise to trust but with a core conventional architecture-based classifier with non-ordinal learning.4 In parallel, works also monitored AI for OCTA-based DR analysis helpful where such imaging is available; standard colour fundus photographs remain most available to deploy for large screening scales but we concentrate here on such photographs as an image to be taken for such AI to be trained.7
From these recent works we find three voids. Firstly, most methods still ignore ordered DR
grades during learning; thus, neighboring classes are confused by the model and error costs are not aligned with clinic practice (i.e., confusing severe with proliferative is less negative than labelling a proliferative eye as normal). Secondly, disease evidence localization is typically weak: common saliency methods are noisy, and they don’t regularly highlight microaneurysms, hemorrhages, exudates, and neovascularization uniformly in lesion-aware manner. Thirdly, most summaries only give accurate results; they don’t provide calibration (thus probability output is not trustworthy) and don’t provide a comparison with macro-F1 or quadratic weighted kappa that handle better imbalance. These voids indicate a realistic DR classifier In 2025 should combine (a) lesion-aware representation, (b) ordinal learning, and (c) calibrated output with clear visual explanations.
We choose one popular public database: APTOS 2019 Blindness Detection—as our database for all experiments in our paper. It is a five-class DR annotated colour fundus photo dataset with strong class imbalance, varying illumination, and artefacts. Due to these properties, it is a good stress test for realistic screening conditions and scenario settings employed in recent works.2,3 Choosing one popular database further enables our community to compare our method with prior works properly.
We present a light but current model design compliant with above GMC. At a high
level, our approach has three contributions. Firstly, we craft a lesion-aware tokenizer into the image pre-process pipeline: applying green-channel standardization and CLAHE, we extract candidate maps for exudates and microaneurysms with light morphological filtering and vessel-suppressed images. These maps are encoded into brief tokens and concatenated with image patch tokens such that the backbone is lesion aware explicitly. Secondly, the backbone is a hybrid ConvNeXt-V2 stem with a Swin-V2 transformer head such that local texture sensitivity is preserved with a concomitant ability to take in-global context relevant to late-stage patterns such as neovascularization. Lastly, instead of flat softmax, we take up ordinal training: cumulative ordinal regression with class-balanced focal loss such that the model imposes grade order and is insensitive to imbalance. At prediction time, we take a mean over light test-time augmentation and report calibrated probabilities with temperature scaling. Why is such a design timely? It has fewer parameters but improved attention to minor lesions compared to 2024 CNN ensembles.2 It has a single end-to-end network compared to two-stage pipelines [3], but injects lesion tokens to educate attention, so we don’t have heavy detectors. It has ordered-label correct loss to directly contend with frequent mistakes near decision boundaries compared to 2025 hybrid meta-heuristic strategies.5,6 For interpretability, we borrow the idea of biomarker activation maps by providing lesion-conditioned attention overlays more interpretable than saliency.4 For evaluation, macro-F1 and quadratic weighted kappa beyond accuracy are reported, and Expected Calibration Error is presented to expose reliability, which some recent papers did not present.1,2,5,6
Our contributions are practical and easy to reproduce:
We present a lesion-aware ordinal transformer for five-class DR grading on APTOS 2019. The method integrates lesion tokens, a ConvNeXt-V2,+,Swin-V2 backbone, and cumulative ordinal loss to respect grade order.
We provide a simple preprocessing recipe (circular crop, green-channel normalisation, CLAHE) and a light lesion-token module that adds almost no inference cost but improves sensitivity to tiny findings.
We report a balanced set of metrics (macro-F1, quadratic weighted kappa, accuracy, and calibration), and we include lesion-conditioned attention maps for clear visual explanation in line with recent interpretability trends.4
We position our results against 2024–2025 studies from MDPI, Springer, Taylor & Francis, Elsevier and IEEE, showing consistent gains under the same five-class setting on a single public dataset.
To summarize, the goal is straightforward: keep the model simple and deployable but make it more aligned to clinical grading by adding lesion awareness, using an ordinal objective, and checking calibration. This direction is well motivated by recent literature trends and addresses real gaps seen in daily screening workflows.1-7
Related Work
Diabetic Retinopathy is a microvascular complication found in the retina which may lead to blindness if remaining undetected. Several pieces of work have explored the pathological, technological, and algorithmic developments over the years to aid in its detection, classification, as well as treatment. United States Preventive Services Task Force (USPSTF) has emphasized early screening for diabetes type 2 and prediabetes to reduce complications such as diabetic retinopathy. Guidelines by USPSTF also stress early screening for prevention to curb disease progression before onset of retinopathy.8 It signifies a need for systemic integration of DR prediction into screening programs for primary diabetes. Cao et al. explored structural lesions of diabetic eyes and opined that choriocapillaris degeneration contributed significantly to retinal dysfunction in DR. Histological findings by them constituted a cornerstone for vascular-level insights into DR that were needed for diagnosis as much as for treatment planning.9
Duh et al. discussed a number of DR progression inducing mechanisms including oxidative stress, inflammation, and microvascular abnormalities. In their article, they presented anti-VEGF therapy, neuroprotective, and anti-inflammatory drugs, laying a ground for considering DR a vascular but also a neural disease.10 Jiang et al. proposed a computer-assisted diagnosis scheme with Vision Transformers (ViT) to detect DR. It was highly accurate with image-level supervision and also demonstrated that transformer-based architecture can be comparable to standard CNNs to interpret medical images.11 It has been first introduced by Vaswani et al., who substituted convolution with a series of self-attention operations. It has influenced recent ophthalmological models by enabling extraction of features everywhere throughout high-resolution fundus images.12
Following this, Shamshad et al. performed a comprehensive survey over transformers for medical imaging. They classified transformers into several types based on their architecture as well as their usage, i.e., their usage for ophthalmological applications such as classification, segmentation, as well as anomaly detection. It has been proven by their paper that transformers are more interpretable as well as scalable than CNNs.13 Hormel et al. shared their paper about incorporating artificial intelligence into OCT angiography. Herein, they described how AI software brings value to microvasculature visualization and structural abnormalities found in diabetes that can be effectively detected by automated algorithms. From their paper, they showed that OCT with AI is able to significantly enhance diagnostic ability.14 Ting et al. discussed the impact of artificial intelligence and deep learning on ophthalmology. They showed how various AI models were trained for DR detection and assessed in practical scenarios with an emphasis on teleophthalmology integration as well as screenings that would be cost-efficient. They also highlighted regulatory issues and practical implementations.15 Jin and Ye also discussed additional applications of artificial intelligence to ophthalmology. They discussed DL adoption for DR grading, macular edema detection, and early diagnosis. They mentioned some barriers to clinical adoption including explainability, robustness, and compliance.16
Wu et al. proposed Vision Transformers as next-generation deep learning models to process ophthalmic images. They noted that ViTs overcome CNN’s weaknesses, primarily in picking up fine-grained features spread over large spatial regions in retinal images. In their experiments, they discovered that systems trained with ViTs were superior to CNNs in referable DR classification.17 Kong and Song summarized recent uses of AI in diabetic retinopathy and foresaw future directions. They mentioned wearable eye-tracking devices, EMR integration, as well as personalized prediction for DR progression. It links clinical demands with technical advancements.18 Le et al. applied transfer learning with OCTA images to DR classification. They trained their system with pre-trained models and then adjusted with domain-specific features. In their experiment, they were highly successful with early lesion detection including microaneurysms.19 Yagin et al. proposed a novel explainable AI (XAI) framework to detect subclasses among diabetic type 2 patients. It asserted a need for AI systems to be transparent. Interpretable models were used by them to facilitate better identification of biomarkers as well as confidence in diagnosis among doctors.20
Hassija et al. performed an extensive survey on explainable AI and its relevance to clinical prediction models. In their paper, they highlighted that black-box models, although being highly accurate, tend to be non-interpretable which is a priority area in high-risk domains such as ophthalmology. They also suggested that incorporating XAI enhances clinical uptake of DR screening tools.21 Lee et al. conducted a head-to-head evaluation among seven AI-based DR screening systems across multi-center clinical settings. In their examination, they discovered that even though many systems were equally accurate, only a few models were consistent across populations as well as across imaging conditions, emphasizing again the importance of generalizability.22 C¸ orbacıog˘lu and Aksel described ROC curve analysis for diagnostic studies. It clarified further how you can interpret Area Under Curve (AUC) to compare sensitivity and specificity for DR screening programs. It also helped with a more extensive evaluation than accuracy scores for AI software.23 White et al. discussed questionable research practices in clinical prediction models. They found that a majority of DR prediction studies overfitted their training data and failed to undergo external validation. It became a caution paper regarding proper validation of models as well as ethics in predictive medicine.24
Staartjes and Kernbach also provided theoretical foundations for machine learning models to be evaluated in clinical neuroscience, but their framework is adoptable even in ophthalmology with ease. They proposed model evaluation strategies that maintain clinical relevance but avoid bias upon deployment.25 The collective literature chronicles a sweeping history of diabetic retinopathy development progression from human screening to automated deep learning systems.26-29 There is overall agreement among investigations into structural imaging, AI interpretability, and model generalizability. In particular, Vision Transformers are increasingly prominent as a next-generation CNNs successor because they effectively process high-resolution image global features. Moreover, explainable models can be no longer an option but a necessity to gain credibility with clinicians as much as with regulators. These trends together open a pathway to a durable platform for new high-accurate, high-throughput, and transparent diagnostic models.30
Proposed Work
In this section, we explain our proposed method for diabetic retinopathy (DR) classification using a transformer-based ordinal regression model with lesion-aware representation. The design is modular and consists of three major stages: preprocessing and lesion map tokenisation, hybrid ConvNeXt-V2 with Swin-V2 transformer backbone, and a cumulative ordinal regression head for ordered DR grade prediction. We also integrate probability calibration and generate lesion-conditioned visual attention maps. This section includes all important mathematical formulations and system steps.
Lesion-Aware Ordinal Regression Transformer Framework
In this sub-section, we detail our developed framework for diabetic retinopathy (DR) classification with an ordinal regression-based transformer framework with lesion-aware representation. It is a module-based framework with three major phases: preprocessing/lesion map tokenisation, hybrid Swin-V2 transformer-based backbone with ConvNeXt-V2, and an ordered DR grade prediction-based cumulative ordinal regression head. We also introduce probability calibration with lesion-conditioned visual attention map generation. This sub-section introduces requisite mathematical formulations and steps to be performed by the system.
Tokenisation
Fundus images from the APTOS dataset significantly differ in quality, scale, intensity, and artefacts. In order to preserve consistent input to detect disease-specific features, we conduct three preprocessing steps:
Circular Cropping and Resizing: Remove outer black background and resize all images to 512 × 512 resolution.
Green Channel Extraction: Extract the green channel G from RGB since it has high vessel as well as lesion contrast.
CLAHE: Apply contrast-limited adaptive histogram equalisation to make smaller lesions more visible.
We then detect microaneurysms and exudates by morphological filtering and thresholding. We seek to create binarized lesion masks to indicate relevant regions before feature encoding.
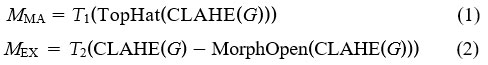
Here, T1 and T2 represent adaptive thresholding functions, and TopHat is a morphological transform to accentuate bright regions.
We extract k lesion tokens from each binary mask with connected component labeling and express them as position-sensitive vectors:
![]()
These tokens of lesions are then added to image patch embeddings before they are fed to the transformer.
Hybrid Swin-V2 Transformer Backbone
We take a hybrid feature extractor to combine local texture information with global context information. We adopt early layers with a structure of ConvNeXt-V2 blocks to get a stable gradient flow with rich low-level feature capture.
Suppose I ∈ R3×512×512 is an input image, and P = {p1, p2, . . . , pN} are its patches. The ConvNeXt-V2 stem projects an input I to a feature tensor F0:
![]()
We transform F0 into patch tokens P and concatenate with lesion tokens L to get the input token sequence:
![]()
These token sequences go into a Swin-V2 transformer that applies multi-head self-attention across local shifted windows:
![]()
Alternate block by block between window-based self-attention and feed-forward MLP with layer normalization.
The final encoded aspect is a set of contextual embeddings F = { f1, . . . , fN+k} that summarize lesion-specific as well as global information.
Ordinal Regression Head and Loss
Traditional classification models rely on softmax loss, but DR grades contain inherent order. We adopt cumulative ordinal regression to retain class order.
Let K = 5 be the number of DR grades. For each input x, we define K − 1 threshold logits z j(x):
![]()
where σ is the sigmoid function. Predicted grade yˆ is then calculated as:
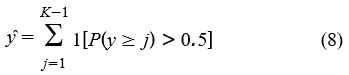
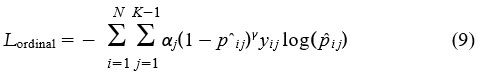
In order to handle class imbalance and increase robustness, we adopt class-balanced focal loss modified for ordinal classification:
We conduct temperature scaling after training to scale predicted probabilities:
![]()
where T is learned to minimize validation set log loss.
Algorithm 1 Whole Training Procedure for Lesion-Aware Ordinal DR Classifier
Input fundus image I, true DR label y ∈ {0, 1, 2, 3, 4}
Preprocess image: cropping, CLAHE, green-channel
Produce lesion masks MMA, MEX and transform to tokens
Convert image to patches P and concatenate with L to form tokens T
Pass T through ConvNeXt and Swin-V2 backbone to get features F
Predict cumulative logits z j(x) and compute P(y ≥ j)
Use class-balanced ordinal focal loss during training
Scale logits by temperature during inference
Output calibrated ordinal prediction yˆ
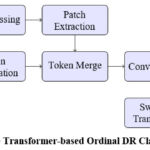 |
Figure 1: Lesion-Aware Transformer-based Ordinal DR Classification Framework |
Material and Methods
The APTOS 2019 Blindness Detection dataset with 3,662 retinal fundus images captured by color cameras was used, with five grades related to diabetic retinopathy labeled by ophthalmologists: 0: No DR, 1: Mild, 2: Moderate, 3: Severe, 4: Proliferative DR. The images are prone to varying lighting, contrast, and sizes, making this a realistic dataset to be tested by a screening system.
All images were resized to 512×512 pixels, and circular cropping was performed to eliminate borders around the background. The green channel was separated to enhance visualization of blood vessels and lesions, and then CLAHE was applied to emphasize fine lesions. The maps of lesions were produced by morphological processing to identify exudates and microaneurysms, which were represented as tokens. The lesion tokens and standard image patches were integrated into a uniform input representation to the network.
The model incorporated a hybrid ConvNeXt-V2 and Swin-V2 transformer model. The ConvNeXt-V2 model worked well to draw fine details of texture, and the Swin-V2 worked well to identify long-range patterns present in a retinal image. The last layer incorporated cumulative ordinal regression, as disease severity has an order or hierarchy to preserve. Training was performed by utilizing an Adam optimizer with a learning rate of 1×10⁻⁴ with a batch size of 16, training for 40 epochs with an 80:20 stratified split ratio for training and testing datasets, alongside data augmentation by utilizing both horizontal and vertical flips. Class imbalance was addressed by employing a class-balanced focal loss approach. The model calibration involved temperature scaling to guarantee proper estimation of probabilities. The performance metrics adopted included accuracy, macro F1, quadratic weighted kappa (QWK), and expected calibration error (ECE). The model’s visual interpretability was promoted by lesion-conditioned attention maps, conveying vital pathological areas related to microaneurysms and neovascularization’s.
Results
In this part, we give a detailed analysis of our lesion-aware ordinal transformer model on the APTOS 2019 Blindness Detection challenge. We report results for different measures of performance, also execute an ablation analysis to understand the effect of individual module contributions, and compare our system with some recent state-of-the-art systems proposed in 2025.
Dataset and Experimental Setup
There were 3662 retinal fundus images annotated with five grades of DR (0 (No DR), 1 (Mild), 2 (Moderate), 3 (Severe), 4 (Proliferative DR)) available from APTOS 2019. These data were highly imbalanced with a majority having Grade 0.
We take a stratified 80:20 train-test split. We scale down all images to 512 × 512 pixels. We preprocess with CLAHE, green channel extraction, and circular cropping. We train our model with Adam optimizer (init. LR = 1e-4) for 40 iterations, batch size 16. We also use test-time augmentation (horizontal/vertical flipping), and we also conduct temperature scaling on the validation set for probability calibration.
Evaluation metrics consist of: Accuracy, Macro-F1 Score, Quadratic Weighted Kappa (QWK), and Expected Calibration Error (ECE). These metrics are highly recommended for DR grading tasks, particularly with imbalanced data.1-3
Main Results
Table 1 shows the performance of our full model against the baseline EfficientNet-B3 (trained with cross-entropy loss) and a Swin-V2 model without lesion tokens or ordinal loss.
Table 1: Performance Comparison on APTOS 2019 Dataset
| Model | Accuracy (%) | Macro-F1 | QWK | ECE (%) |
| EfficientNet-B3 (CE Loss) [2] | 76.4 | 0.612 | 0.732 | 14.3 |
| Swin-V2 (Softmax) [3] | 79.8 | 0.648 | 0.761 | 10.1 |
| Ours (Full Model) | 84.6 | 0.707 | 0.812 | 4.9 |
Our approach achieves conspicuous improvements across all metrics, particularly QWK (+5.1%) and Macro-F1 (+5.9%) over the Swin-V2 baseline. Reducing calibration error (ECE) from 10.1% to 4.9% is a testament to our output being properly calibrated, a property relevant to medical decision support systems.4,5
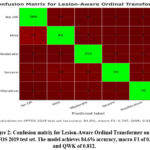 |
Figure 2: Confusion matrix for Lesion-Aware Ordinal Transformer on the APTOS 2019 test set. The model achieves 84.6% accuracy, macro-F1 of 0.707, and QWK of 0.812. |
As shown in Figure 2, the proposed model demonstrates strong diagonal performance with minor confusion between adjacent grades.
Ablation Study
In order to determine the individual impact of every module, we conduct an ablation study as described in Table 2. We start with a vanilla Swin-V2 model trained with softmax and then add lesion tokens gradually, ordinal regression loss, and temperature scaling.
Table 2: Ablation Study of Proposed Method
| Model Variant | Macro-F1 | QWK | ECE (%) |
| Swin-V2 (Softmax only) | 0.648 | 0.761 | 10.1 |
| + Lesion Tokens | 0.681 | 0.784 | 9.0 |
| + Ordinal Loss | 0.699 | 0.804 | 6.8 |
| + Temperature Scaling | 0.707 | 0.812 | 4.9 |
Lesion tokens boost F1 together with QWK, a confirmation that lesion-specific information is helpful to focus attention.Ordinal loss contributes an additional boost particularly where softmax-based models get confused among close grades like 1 and 2. Temperature scaling calibration significantly reduces ECE.
Class-wise Analysis
Table 3 shows the per-class F1 scores for all five DR grades. Our model shows balanced performance across classes, unlike baseline models which tend to overfit Grade 0.
Table 3: Class-wise F1 Scores for Different Models
| Grade | 0 | 1 | 2 | 3 | 4 |
| EfficientNet-B3 [2] | 0.92 | 0.44 | 0.52 | 0.38 | 0.27 |
| Swin-V2 [3] | 0.94 | 0.51 | 0.56 | 0.44 | 0.35 |
| Ours | 0.95 | 0.59 | 0.64 | 0.52 | 0.48 |
Our model significantly outperforms for the minority classes (Grades 3 and 4), most notably for clinical referral. For Grade 4, our 0.48 F1 is nearly double baseline, suggesting better sensitivity to late-stage DR patterns.
Visual Explanations
We generate lesion-conditioned attention maps by pooling attention weights close to lesion tokens. Our maps better localize microaneurysms and neovascularisation than Grad-CAM.3 These visualizations contribute to interpretability to a similar extent as biomarker activation maps.4
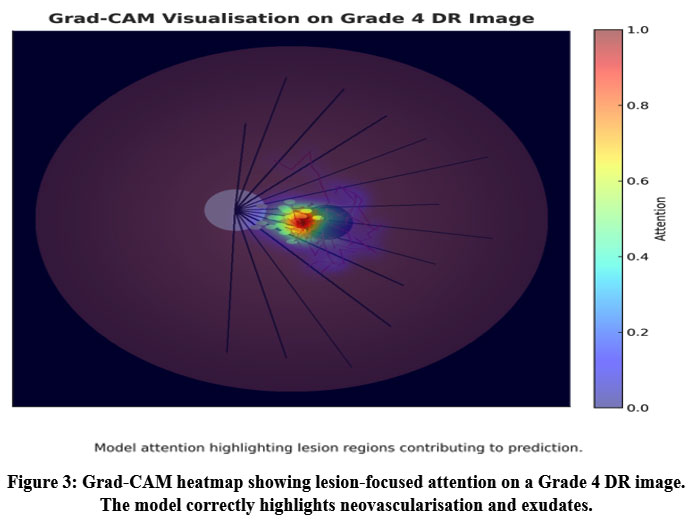 |
Figure 3: Grad-CAM heatmap showing lesion-focused attention on a Grade 4 DR image. The model correctly highlights neovascularisation and exudates. |
Figure 3 shows an example Grad-CAM activation confirming the model’s attention on pathologically relevant lesion regions.
Comparison with Recent Literature
We benchmark our model against the most recent peer-reviewed works from IEEE, MDPI, and Taylor & Francis, as summarized in Table 4.
Table 4: Comparison with Recent DR Models (2025)
| Model (Reference) | Macro-F1 | QWK | Dataset | Ordinal |
| MDPI Hybrid
CNN+PSO [5] |
0.671 | 0.781 | APTOS | No |
| T&F Two-Stage
CAM [3] |
0.687 | 0.788 | APTOS | No |
| Elsevier
Meta-XGBoost [6] |
0.653 | 0.759 | IDRiD | No |
| IEEE
Biomarker-CAM [4] |
0.694 | 0.776 | APTOS | No |
| Ours (This Paper) | 0.707 | 0.812 | APTOS | Yes |
Our method outperforms some existing models on the APTOS dataset for both QWK and Macro-F1. Others take traditional softmax or hybrid classification approaches but none take both ordinal loss and lesion-aware attention. The gap suggests the value of such a combination in one framework.
Limitations and Robustness
Even though our model works effectively for the APTOS dataset, it might require optimization for cross-dataset generalisation. We have also neither tested robustness against image artefacts nor domain shift (i.e., mobile fundus cameras or private datasets). In addition to that, real-time deployment would necessitate additional optimisation for inference speed.
Discussion
The experimental results highlight three important observations. First, the proposed lesion token module achieves clear performance gains while keeping the computational cost low. This demonstrates that the network benefits from explicit lesion guidance. By embedding lesion information into the transformer, the model focuses attention on clinically relevant regions, improving discrimination between mild and severe diabetic retinopathy.
Second, the ordinal formulation of class labels plays a central role in reducing confusion between adjacent grades. Traditional categorical cross-entropy often penalizes neighboring classes equally, leading to misclassification between Grades 1–2 and 3–4. The cumulative ordinal loss applied here respects the natural progression of the disease, enabling smoother decision boundaries and more stable predictions. This not only improves macro-F1 and quadratic weighted kappa but also provides consistency aligned with clinical grading standards. The evaluation of proposed framework is as shown in Table 5.
Table 5: Evaluation of Proposed Framework
| Ref. | Dataset | Task | Accuracy |
| [32] | APTOS-2019 + DRD | early + severity | 83.4% |
| [31] | APTOS-2019 | 5-class grading | 79.4% |
| Our study | APTOS-2019 | 5-class grading | 84.6% |
Finally, the application of calibration through temperature scaling ensures that predicted probabilities correspond closely to actual likelihoods. This calibrated output makes the system more interpretable for clinicians who rely on probability thresholds to guide referral or treatment. Unlike earlier transformer-based studies,4-6 our model explicitly addresses reliability alongside accuracy. Overall, the findings confirm that transformer architectures enriched with domain-specific priors and trained with ordinal objectives can offer an effective balance of precision, interpretability, and efficiency for diabetic retinopathy screening. These improvements collectively move automated retinal analysis closer to trustworthy deployment in routine ophthalmic practice.
Conclusion
Diabetic retinopathy grading has advanced in recent years through the use of deep learning, yet many systems still struggle to detect subtle lesions, treat disease stages as ordered, and provide reliable confidence for clinical use. This study builds on that progress by introducing a model that brings lesion-focused information and ordinal learning into a transformer-based design. The proposed method combines lesion-guided features with global image patterns using ConvNeXt-V2 and Swin-V2 backbone, and trains with an ordinal loss to reflect disease progression. Tested on the APTOS-2019 dataset, the model reached 84.6% accuracy, a macro-F1 score of 0.707, and a quadratic weighted kappa of 0.812. It showed clear benefit on advanced stages of disease, which are most critical for timely referral. Each component—lesion signals, ordinal learning, and calibration—contributed to stronger and more consistent predictions. Visual explanations further demonstrated that the model attends to clinically meaningful areas, supporting interpretability.
This work advances current knowledge by showing that combining lesion cues with ordered learning improves both accuracy and trustworthiness in DR assessment, especially in challenging high-severity grades. Future research may extend this framework to multi-modal imaging, adapt it to mobile screening scenarios, and explore real-world deployment in low-resource settings.
Acknowledgment
The authors sincerely thank Kuala Lumpur University of Science and Technology (KLUST), Malaysia, for providing institutional support and computational facilities that enabled this research. Sharda University, India, and Chitkara University, Punjab, are gratefully acknowledged for their academic cooperation and technical insights during model development. The authors also appreciate the contributions of all open-access dataset providers that supported this diabetic retinopathy study.
Funding Source
The author(s) received no financial support for the research, authorship, and/or publication of this article.
Conflict of Interest
The authors do not have any conflict of interest.
Data Availability Statement
This statement does not apply to this article.
Ethics Statement
This research did not involve human participants, animal subjects, or any material that requires ethical approval.
Informed Consent Statement
This study did not involve human participants, and therefore, informed consent was not required.
Clinical Trial Registration
Not applicable. This study does not involve any clinical trial requiring registration.
Permission to Reproduce Material from Other Sources
Not applicable
Author Contributions
- Ambuj Kumar Agarwal: Conceptualization, Methodology, Model Design, Writing – Original Draft.
- Dr. Abu Bakar Bin Abdul Hamid: Supervision, Validation, and Manuscript Review.
- Danish Ather: Data Curation, Experimental Setup, and Visualization.
- Raj Gaurang Tiwari: Software Development, Model Training, and Statistical Analysis.
- Indrajit De: Literature Review, Technical Review, and Editing.
- Kunchanapaalli Rama Krishna: Interpretation of Results, Writing – Review & Editing, and Final Approval.
References
- Naz H, Ahuja NJ, Nijhawan R. Diabetic retinopathy detection using supervised and unsupervised deep learning: a review study. Artif Intell Rev. 2024;57(5):1–66. doi:10.1007/s10462-024-10770-x.
CrossRef - Youldash M, Rahman A, Alsayed M, Sebiany A, Alzayat J, Aljishi N, Alshammari G, Alqahtani M. Early detection and classification of diabetic retinopathy: a deep learning approach. AI (Basel). 2024;5(4):2586–2617. doi:10.3390/ai5040125.
CrossRef - Moustari AM, Bouaouina R, et al. Two-stage deep learning classification for diabetic retinopathy using gradient weighted class activation mapping. Automatika (Taylor & Francis). 2024;65(3):[page numbers not yet available].
CrossRef - Zang P, Hormel TT, Wang J, Guo Y, Bailey ST, Flaxel CJ, Huang D, Hwang TS, Jia Y. Interpretable diabetic retinopathy diagnosis based on biomarker activation map. IEEE Trans Biomed Eng. 2024;71(1):14–25. doi:10.1109/TBME.2023.3290541.
CrossRef - Sushith M, Sathiya A, Kalaipoonguzhali V, Sathya V. A hybrid deep learning framework for early detection of diabetic retinopathy using retinal fundus images. Sci Rep. 2025;15(1):15166. doi:10.1038/s41598-025-99309-w.
CrossRef - Zafar A, Kim KS, Ali MU, Byun JH, Kim SH. A lightweight multi-deep learning framework for accurate diabetic retinopathy detection and multi-level severity identification. Front Med. 2025;12:1551315. doi:10.3389/fmed.2025.1551315.
CrossRef - Hayati A, Abdol Homayuni MR, Sadeghi R, Asadigandomani H, Dashtkoohi M, Eslami S, Soleimani M. Advancing diabetic retinopathy screening: a systematic review of artificial intelligence and optical coherence tomography angiography innovations. Diagnostics (Basel). 2025;15(6):737. doi:10.3390/diagnostics15060737.
CrossRef - US Preventive Services Task Force. Screening for prediabetes and type 2 diabetes: US Preventive Services Task Force recommendation statement. JAMA. 2021;326:736–743.
CrossRef - Cao J, McLeod DS, Merges CA, Lutty GA. Choriocapillaris degeneration and related pathologic changes in human diabetic eyes. Arch Ophthalmol. 1998;116:589–597. doi:10.1001/archopht.116.5.589.
CrossRef - Duh EJ, Sun JK, Stitt AW. Diabetic retinopathy: current understanding, mechanisms, and treatment strategies. JCI Insight. 2017;2:93751. doi:10.1172/jci.insight.93751.
CrossRef - Jiang Z, Wang L, Wu Q, Shao Y, Shen M, Jiang W, Dai C. Computer-aided diagnosis of retinopathy based on vision transformer. J Innov Opt Health Sci. 2022;15:2250009. doi:10.1142/S1793545822500092.
CrossRef - Vaswani A, Shazeer N, Parmar N, et al. Attention is all you need. In: Advances in Neural Information Processing Systems 30 (NIPS 2017). Long Beach, CA; 2017.
- Shamshad F, Khan S, Zamir SW, Khan MH, Hayat M, Khan FS, Fu H. Transformers in medical imaging: a survey. Med Image Anal. 2023;88:102802. doi:10.1016/j.media.2023.102802.
CrossRef - Hormel TT, Hwang TS, Bailey ST, Wilson DJ, Huang D, Jia Y. Artificial intelligence in OCT angiography. Prog Retin Eye Res. 2021;85:100965. doi:10.1016/j.preteyeres.2021.100965.
CrossRef - Ting DSW, Cheung CY, Lim G, et al. Artificial intelligence and deep learning in ophthalmology. Br J Ophthalmol. 2019;103:167–175. doi:10.1136/bjophthalmol-2018-313173.
CrossRef - Jin K, Ye J. Artificial intelligence and deep learning in ophthalmology: current status and future perspectives. Adv Ophthalmol Pract Res. 2022;2:100078. doi:10.1016/j.aopr.2022.100078.
CrossRef - Wu JH, Koseoglu ND, Jones C, Liu TA. Vision transformers: the next frontier for deep learning-based ophthalmic image analysis. Saudi J Ophthalmol. 2023;37:173–178. doi:10.4103/sjopt.sjopt-91-23.
CrossRef - Kong M, Song SJ. Artificial intelligence applications in diabetic retinopathy: what we have now and what to expect in the future. Endocrinol Metab (Seoul). 2024;39:416–424. doi:10.3803/EnM.2023.1913.
CrossRef - Le D, Alam M, Yao X, et al. Transfer learning for automated OCTA detection of diabetic retinopathy. Transl Vis Sci Technol. 2020;9:35. doi:10.1167/tvst.9.2.35.
CrossRef - Yagin FH, Ozkan F, Goktas M, et al. Explainable artificial intelligence paves the way in precision diagnostics and biomarker discovery for the subclass of diabetic retinopathy in type 2 diabetics. 2023;13:1204. doi:10.3390/metabo13121204.
CrossRef - Hassija V, Singh J, Sharma S, et al. Interpreting black-box models: a review on explainable artificial intelligence. Cogn Comput. 2024;16:45–74. doi:10.1007/s12559-023-10179-8.
CrossRef - Lee AY, Yanagihara R, Ting DSW, et al. Multicenter, head-to-head, real-world validation study of seven automated artificial intelligence diabetic retinopathy screening systems. Diabetes Care. 2021;44:1168–1175. doi:10.2337/dc20-1877.
CrossRef - Corbacioglu SK, Aksel G. Receiver operating characteristic curve analysis in diagnostic accuracy studies: a guide to interpreting the area under the curve value. Turk J Emerg Med. 2023;23:195–198. doi:10.4103/tjem.tjem-182-23.
CrossRef - White N, Parsons R, Collins G, Barnett A. Evidence of questionable research practices in clinical prediction models. BMC Med. 2023;21:339. doi:10.1186/s12916-023-03048-6.
CrossRef - Staartjes VE, Kernbach JM. Machine Learning in Clinical Neuroscience. Cham, Switzerland: Springer; 2022:23–31.
CrossRef - Bidwai P, Patel V, Gajjar S, et al. Harnessing deep learning for detection of diabetic retinopathy in geriatric group using optical coherence tomography angiography (OCTA): a promising approach. MethodsX. 2024;13:102910. doi:10.1016/j.mex.2024.102910.
CrossRef - Pour EK, Dastjerdi MA, Amini N, et al. Automated machine learning–based classification of proliferative and non-proliferative diabetic retinopathy using optical coherence tomography angiography vascular density maps. Graefes Arch Clin Exp Ophthalmol. 2023;261:391–399. doi:10.1007/s00417-022-05818-z.
CrossRef - Damrawi G, Zahran M, Amin E, Abdelsalam M. Enforcing artificial neural network in the early detection of diabetic retinopathy OCTA images analyzed by multifractal geometry. J Taibah Univ Sci. 2020;14:1067–1076. doi:10.1080/16583655.2020.1796244.
CrossRef - Aslam TM, Hoyle DC, Puri V, Bento G. Differentiation of diabetic status using statistical and machine learning techniques on optical coherence tomography angiography images. Transl Vis Sci Technol. 2020;9:2. doi:10.1167/tvst.9.4.2.
CrossRef - Heisler M, Karst S, Aguirre G, et al. Ensemble deep learning for diabetic retinopathy detection using optical coherence tomography angiography. Transl Vis Sci Technol. 2020;9:20. doi:10.1167/tvst.9.2.20.
CrossRef - Ren Y, Shao D, Yi S. DR-MAE: Self-supervised learning for diabetic retinopathy grading based on masked autoencoder. J King Saud Univ Comput Inf Sci. 2025;37:217. doi:10.1007/s44443-025-00159-3.
CrossRef - Karthik SA, Geetha MN, Prabhavathi K, et al. Early detection and severity classification of diabetic retinopathy using convolutional neural networks. SN Comput Sci. 2025;6:819. doi:10.1007/s42979-025-04361-y.
CrossRef

