
Manuscript accepted on :28-11-2024
Published online on: 13-02-2025
Plagiarism Check: Yes
Reviewed by: Dr. Anjaneyulu. V and Dr. Patel Maulik
Second Review by: Dr. Adinarayana Andy
Final Approval by: Dr. Anton R Keslav
Kumudhavalli Manni Venkatachari 1* and Venkatraj Ramasamy2
1Department of Pharmacognosy, Vinayaka Mission’s College of Pharmacy, Vinayak Mission’s Research Foundation (DU), Yercaud Main Road, Salem, Tamilnadu, India.
2Vinayaka Mission’s College of Pharmacy, Vinayak Mission’s Research Foundation (DU), Yercaud Main Road, Salem, 636008, Tamilnadu, India.
Corresponding Author E-mail:kumudhu27@gmail.com
DOI : https://dx.doi.org/10.13005/bpj/3113
Abstract
In this work, QbD tools have been applied for the validation and optimization of parameters for irinotecan hydrochloride using Box-Behnken design with the objective of acquiring a short retention time. The RP-HPLC method was developed using a C18 column by using a mobile phase composition of Acetonitrile and potassium dihydrogen phosphate whose pH was adjusted to 3.2 using orthophosphoric acid in the ratio of 60:40v/v. These included system suitability parameters like ambient temperature, flow rate 1.0 ± 0.2 ml/min, and an overall run time of 7 minutes. Analysis was carried out at 222 nm using PDA detector.The developed methodology was then validated according to ICH guidelines under various conditions. The retention time for Irinotecan HCl was found 2.16 min. Linearity was ranged from 40-120 µg/ml, the correlation coefficient less than 1. Stability time for both analyte and standard solution were found to be 5 days. Using this method, the minimum detectable limits LOD and LOQ could be estimated at 0.8 ng/ml and 2.0 ng/ml, respectively.
Keywords
Box-Behnken design; Irinotecan; Isocratic; Method validation; QbD; RP-HPLC
Download this article as:| Copy the following to cite this article: Venkatachari K. M, Ramasamy V. Box -Behnken Design Approach to Method Development for Irinotecan Hydrochloride Trihydrate by Using RP-HPLC Method. Biomed Pharmacol J 2025;18(1). |
| Copy the following to cite this URL: Venkatachari K. M, Ramasamy V. Box -Behnken Design Approach to Method Development for Irinotecan Hydrochloride Trihydrate by Using RP-HPLC Method. Biomed Pharmacol J 2025;18(1). Available from: https://bit.ly/3WZKdEV |
Introduction
Analytical Quality by Design (A QbD) is a systematic and risk-based approach to developing analytical methods in the field of pharmaceuticals and other regulated industries. It draws inspiration from the principles of Quality by Design (QbD) and applies them specifically to analytical methods1–3. ICH Q8(R2) Pharmaceutical Development and provides further clarification of key concepts outlined in the core guideline4. Moreover, Applying of QbD is important in developing a new method it fit for the purpose assure the quality. The result it could be organized by CQA, risk assessment and outlining of design space it set for the future investigations. 5,6.
Irinotecan is primarily used in the treatment of Metastatic colorectal cancer. This is semi synthetic derivative of Camptotheca accuminata which contains Comptothecin alkaloid belongs to Nyssaceae family7,8. There are the several methods are available in the irinotecan hydrochloride trihydrate injections using QbD. But in this study describes about the implementation of QbD impact the outcome of analytical process development and validation. Understanding about critical quality attributes & critical method, material attributes. In this present work, a novel RP-HPLC method was developed & validated.
Materials and Methods
Materials
Irinotecan reference standard (99.5%) was purchased in the Reputed pharmaceutical company. The sample injection of Irinotecan was purchased in the market. Acetonitrile analytical grade was purchased in Spectro hem Pvt. Ltd., Mumbai KH2PO4 Buffer Purchased in Merck Pvt. Ltd., Mumbai.
Instruments
A Shimadzu HPLC system equipped with dual pump. UV-Vis detector was used in this present work. The PDA detector used for determination of proper wavelength of irinotecan hydrochloride trihydrate 222 nm was found wave length.
Experimental Procedure
standard stock solution preparation
acquired quantity (5 mg) of Irinotecan API was transferred in to a 25 ml calibrated volumetric flask. To this 15 ml of mobile phase (ACN: KH2PO4) was added and sonication was done. Finally, it was filled up to the mark with mobile phase. It was used for further analysis.
Preparation of analyte
Pipette out 0.25 ml of irinotecan injection which is equivalent to 5 mg of drug is transfer in to 25 mal of volumetric flask and made up with mobile phase. From this various concentration there prepared for calibration and validation parameter.
Method optimization
The mobile phase was optimized according to the ICH-guidelines Q2(R2) using a 3-factor, 3-level Box-Behnken design analyzed with ANOVA software. For this study, we set acetonitrile as factor X, buffer concentration as Y, and buffer pH as Z. Capacity factor (K1) was set as an independent variable, resolution (RS12), and elution time-tR1-was considered as the response. The surface analysis was targeted at the location of the various independent variables’ effects based on observations. Table 1 shows the Box-Behnken-generated experimental design of 20 runs that have been subjected to show the observed and expected responses.
The results were evaluated using the ANOVA method, besides the desirability function to select optimum conditions after the procedure of optimization was over. The advantage of using a Box-Behnken design lies in the fact that it optimizes experimental designs that contain at least three dependent variables or factors, and several responses can be compared against CCD and full factorial design. This experimental design contains three factors-straight line, quadratic, and interaction terms-which can be expressed by the model Y0.
= β0 + β1 X1 + β2 X2 + β3 X3 + β12 X1 X2 + β13 X1 X3 + β23 X2 X3 + β11 X 2 + β22 X 2 + β33 X 2
Y0 = response to be modeled, β0 = constant, β2, β3, β4 = linear coefficients,
β13, β14, β24 = interaction coefficients, β11, β22, β33 = quadratic coefficients.
The statistical parameter given in table 2.
Method validation
Method was validated as per the ICH Q2(R2) guidelines.
System Condition
The system condition was obtained by the mirroring the analysis of six sample standard injections at 80 µg/ml and finally get optimize chromatogram. From chromatogram calculate the system condition parameters such as tailing factor, theoretical plate count and reproducibility (% RSD of analyte retention time and area of the six replicates).
Specificity
The ability of a developed analytical method accurately measures the samples in the presence of the other residues or compounds. the major peak was used studied for the peak purity and developed method it should effectively separates the analytes and denatured products.
Linearity
The linearity verifies by minimum 5 different concentration standard solution was prepared at the different concentration range from 50 to150% to showing that assay concentrations. Weighed accuratlyb5 mg of standard dissolve into 10ml of mobile phase into 25 ml of volumetric flask. Sonicate, make up to the marked volume.
Precision
Take accurately weighed 5mg of standard irinotecan dissolved in 15ml of mobile phase in to 25ml of volumetric flask and sonicate and make up the volume up to the mark. Accurately take two ml of above solution was transferred to 5ml of volumetric flask and the volume was make up with mobile phase. 6 such preparations were made.
Accuracy
The accuracy was performed by percentage of recovery conducted at the different concentration range 80,100 and 120%. Two ml of standard solution into 5ml of volumetric flask make up to volume with mobile phase solution. 1.6 ml and 2ml of test solution pipette out transfer into two different 5ml volumetric flask make up to the volume to the mark with mobile phase.
LOD and LOQ
Serial dilutions of Irinotecan were prepared from standard test solution in the range of 1%, 2 % and 3% to target assay concentration (80ppm). The samples were analyzed by HPLC replicated for 5 times. Standard deviation was calculated in each 5 injections concentration.
LOD = (3.3 X S.D/slope)
LOQ = (10 X S.D/slope)
Ruggedness
Ruggedness of this method was confirming by the performing the following variations.
Analyst person to analyst person variation, 2. Different Column variation, 3. Day to days variation. This mentioned parameter was studied to estimate the percentage assay on few different days using different analytical columns. Sample analysis was carried out by two different analysts, varying one parameter each time. Analysis was carried out in duplicate.
Robustness
Robustness test was performed deliberately changes in mobile phase to the developed HPLC conditions viz., Flow rate change into (± 0.2 ml/min), Composition change into (± 5 ml): and buffer pH adjusted in to (± 0.2) as per method validation protocol.
Results and Disscussion
Table 1: Box – Behnken design arrangement and responses
|
Run |
Type |
ACN concentration X (%vol/vol) |
Buffer Concentration Y(Milli Mole) |
Buffer Strength (pH) Z |
Capacity factor (K1) |
Resolution (Rs1,2) |
Retention time (tR1) |
|
3 |
Axial |
55.00 |
45.00 |
3.16 |
0.78 |
6.90 |
5.25 |
|
7 |
Axial |
65.00 |
35.00 |
3.84 |
0.78 |
10.46 |
5.10 |
|
14 |
Axial |
55.59 |
45.00 |
3.00 |
0.96 |
4.68 |
4.55 |
|
18 |
Axial |
55.00 |
48.36 |
3.00 |
0.86 |
11.46 |
3.36 |
|
19 |
Axial |
57.00 |
41.64 |
4.00 |
0.85 |
14.60 |
2.45 |
|
17 |
Axial |
57.41 |
43.00 |
3.00 |
0.94 |
4.92 |
6.50 |
|
2 |
Center |
60.00 |
40.00 |
3.20 |
1.0 |
11.68 |
2.16 |
|
1 |
Fact |
60.00 |
45.00 |
3.50 |
0.91 |
11.68 |
8.63 |
|
4 |
Fact |
55.00 |
53.00 |
2.50 |
0.92 |
8.86 |
9.53 |
|
5 |
Fact |
58.00 |
42.00 |
2.50 |
0.96 |
8.98 |
6.56 |
|
9 |
Fact |
58.00 |
42.00 |
2.50 |
0.82 |
10.88 |
6.56 |
|
12 |
Fact |
58.00 |
42.00 |
3.50 |
0.80 |
6.94 |
6.30 |
|
13 |
Fact |
58.00 |
43.00 |
3.50 |
0.80 |
6.98 |
6.25 |
|
15 |
Fact |
58.00 |
43.00 |
3.50 |
0.88 |
8.12 |
6.25 |
|
17 |
Fact |
60.00 |
42.00 |
3.50 |
0.76 |
10.86 |
6.56 |
Table 2: Surface response models and parameters
|
|
Regression model |
Adjusted R2 |
Model P value |
% C.V |
Adequate Precision |
|
K1
Rs1,2
T R1 |
+1.07-2.68E-005A-0.013B-0.022 C+0.042AB- 0.037A2-0.071B2-0.098C2 +12.14-0.79A+0.41C-2.39A2-1.01 C2 +4.41+1.48A-0.17B+0.28AB+0.76 A2+0.17B2– 3.07 AB2 |
0.9110 0.7209
0.8455 |
<0.0001 <0.0001
<0.0001 |
3.61 5.19
8.52 |
14.975 11.601
15.082 |
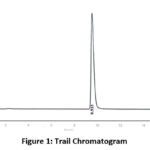 |
Figure 1: Trail Chromatogram
|
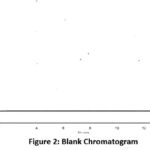 |
Figure 2: Blank Chromatogram.
|
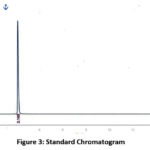 |
Figure 3: Standard Chromatogram
|
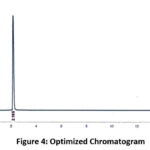 |
Figure 4: Optimized Chromatogram
|
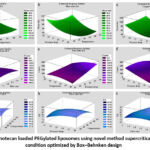 |
Figure 5: Irinotecan loaded PEGylated liposomes using novel method supercritical fluid and condition optimized by Box–Behnken design
|
Estimated response surfaces were generated under the following fixed conditions: pressure drop (a, d, g) at 22.5 MPa, flow rate (b, f, h) at 1.2 mL/min, and temperature (c, e, i) at 22.5 °C, for the mean size, count, and EE, respectively.
Method Validation
System Suitability
Table 3: System condition parameters
|
Injection |
Retention time (min) |
Area of analyte |
Plate count |
Tailing factor |
|
1 |
2.158 |
8370847 |
2295 |
1.22 |
|
2 |
2.142 |
8372813 |
2289 |
1.21 |
|
3 |
2.167 |
8376715 |
2320 |
1.22 |
|
4 |
2.156 |
8371638 |
2290 |
1.23 |
|
5 |
2.154 |
8371824 |
2323 |
1.21 |
|
6 |
2.159 |
8372438 |
2315 |
1.24 |
|
Mean |
2.156 |
8372713 |
2305.33 |
1.22 |
|
S D |
0.0081 |
2075.068 |
15.68 |
0.01169 |
|
% RSD |
0.375 |
0.024 |
0.680 |
0.958 |
Specificity
Table 4: Result of Specificity
|
|
|
Temp/ |
Time |
Analyte Rt (min) |
Impurities Rt (min) |
|
Physical degradation |
Heat stress |
105º C |
6 hrs |
2.15 |
4.5 |
|
Chemical degradation |
Base degradation (1 N NaOH) |
60 º C |
60 min |
2.15 |
1.9, 2.7 |
|
Acid degradation (1 N HCl) |
60 º C |
60 min |
2.15 |
4.6 |
|
|
Oxidation degradation |
60 º C |
60 min |
2.15 |
— |
Linearity
Table 5: Result of Linearity
|
Injection |
Con. (%) |
Con. of sample (µg/ml) |
Response |
% Purity |
|
1 |
25 |
20 |
220675 |
98.8 |
|
2 |
50 |
40 |
439351 |
98.8 |
|
3 |
75 |
60 |
635989 |
98.89 |
|
4 |
100 |
80 |
837084 |
99.6 |
|
5 |
125 |
100 |
1025839 |
99.8 |
|
6 |
150 |
120 |
1228245 |
99.8 |
|
Correlation coefficient not more than 1. |
||||
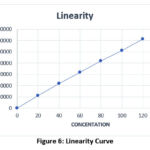 |
Figure 6: Linearity Curve.
|
Precision
Table 6: Result of Precision
|
Injection |
Peak area |
% Assay |
|
1 |
8345201 |
99.69 |
|
2 |
8342215 |
99.65 |
|
3 |
8343136 |
99.66 |
|
4 |
8343217 |
99.66 |
|
5 |
8343328 |
99.67 |
|
6 |
8344307 |
99.68 |
|
Mean |
8343567
|
99.66 |
|
Standard deviation |
1040.27 |
0.01472 |
|
%RSD |
0.012 |
0.014 |
Accuracy
Table 7: Accuracy results
|
Compound |
Concentration (%) |
Amount added (mg) |
Amount found (mg) |
Mean Recovery (%) |
SD |
RSD (%) |
|
Irinotecan |
80 100 120 |
0.064 0.080 0.096 |
0.06374 0.07864 0.09542 |
99.1 |
0.458 |
0.462 |
Result of Limit of Detection and Limit of Quantification
LOD and LOQ were calculated by the method which was based on the standard deviation of the response and slope of calibration curve at the level approximately Limit of Detection and Limit of Quantification was found to be 0.8ppm and 2ppm respectively.
Robustness
Table 8: Results of robustness study
|
Parameter |
% RSD of % purity |
Tailing factor |
Plate count |
% Purity |
|
|
Flow rate ± 0.2 (ml) |
1.2 |
0.92 |
1.3 |
2345 |
99.2 |
|
0.8 |
1.10 |
1.4 |
2549 |
99.5 |
|
|
Temperature± 5 ºC |
20 |
0.64 |
1.2 |
2285 |
99.1 |
|
30 |
0.70 |
1.3 |
2299 |
99.3 |
|
|
Mobile phase composition ± 5 ml |
45:55 |
1.10 |
1.3 |
2472 |
98.6 |
|
35:65 |
1.30 |
1.2 |
2283 |
98.7 |
|
|
pH of buffer ± 0.2 |
3.4 |
0.83 |
1.4 |
2457 |
99.5 |
|
3.0 |
1.01 |
1.2 |
2269 |
99.8 |
|
The developed method was then validated according to ICH guidelines and is suitable for estimating the bulk drug in marketed products. This method was applied to the injection Irnocam from the local market to determine the amount of irinotecan in bulk drug formulations. The marketed formulation was analyzed in triplicate, and it was found that the irinotecan content in Irnocam is 19.76 mg/ml, whereas the claimed value was 20 mg/ml. The sample purity in percentage was estimated as 98.2%. Since the result for % RSD was 0.132%, the developed RP-HPLC method is accurate and precise for the quantitative determination of irinotecan in bulk dosage forms.
Conclusion
In the present study, the Box-Behnken design was used to develop a new technique for the estimation of irinotecan from marketed formulations using RP-HPLC. This technique utilized surface methodology to determine the impact of independent variables, namely % mobile phase ratio, flow rate, and triplet levels on chromatographic responses. The chromatographic resolution, tailing factor, and theoretical plate values were the responses measured. The developed technique was then validated according to ICH guidelines Q1(R2) and showed precision, accuracy, and speed. It is specifically designed for the quantitative determination of irinotecan in pharmaceutical formulations and hence suitable for routine analysis at laboratories.
Acknowledgement
We would like to thank our Respected Principal prof. Dr. M. Kumar, VMCP & VMRF (DU) for this overall support to carry out this research in the campus.
Conflict of Interest
The author(s) do not have any conflict of interest.
Data Availability Statement
This statement does not apply to this article.
Ethics Statement
This research did not involve human participants, animal subjects, or any material that requires ethical approval.
Informed Consent Statement
This study did not involve human participants, and therefore, informed consent was not required.
Clinical Trial Registration
This research does not involve any clinical trials
Author Contributions
- Kumudhavalli Manni Venkatachari: designed the study, performed the statistical analysis, wrote the protocol,
- Venkatraj Ramasamy : Data Collection, Analysis, Writing – Review & Editing, Visualization, Supervision, Project Administration.
References
- Wang, Y. Application of Quality by Design in Analytical Method Development: A Case Study on Irinotecan Pharmaceutical Development and Technology. 2021; 26(7), 843-851.
- Balakrishnan, A. Quality by Design in Analytical Method Development: A Review. Current Pharmaceutical Analysis. 2020;16(2), 129-138.
- Kumar, P. Critical Quality Attributes in Analytical Methods: A Review of Recent Advances. Journal of Pharmaceutical Sciences, 2019; 108(7), 2241-2250.
- Mahesh, R. Integration of Quality by Design in Method Development: A Systematic Review. Journal of Chromatography B. 2023; 1210, 123321.
- Gupta, R. “Development and Validation of RP-HPLC Method for Irinotecan Analysis: Implementation of QbD Principles. Analytical Methods. 2022; 14(15), 1873-1885.
- Jain A, Tikariya K, Mukherjee D. Analytical method development and validation of posaconazole by QbD approach. Int J Pharm Sci Rev Res. 2022; 70:109-113.
CrossRef - Kciuk M, Marciniak B, Kontek R. Irinotecan—still an important player in cancer chemotherapy: a comprehensive overview. Int J Mol Sci. 2020;21(14):4919.
CrossRef - Kumudhavalli M, Prakash C, Kumar M. A novel technique for the quantification of irinotecan HCl injection. Res J Pharm Tech. 2019;12(12):602s7.
CrossRef

