
Manuscript accepted on :22-01-2025
Published online on: 05-03-2025
Plagiarism Check: Yes
Reviewed by: Dr. Noora Thamer Abdulaziz
Second Review by: Dr. Mohammed Siddique
Final Approval by: Dr. Prabhishek Singh
Asaad Babker1* , Rania Saad Suliman2 , Aisha Ali M Ghazwani2, Wiam AlHarbi3 and Vyacheslav Lyashenko4
1Department of Medical Laboratory Sciences, College of Health Sciences, Gulf Medical University, Ajman, UAE.
2Department of Clinical Laboratory Sciences, Prince Sultan Military College for Health Sciences, Dhahran, Saudi Arabia
3Histopathology Department, King Fahad Military Medical Complex, Dhahran, Saudi Arabia.
4Department of Media Systems and Technology, Kharkiv National University of Radio Electronics, Kharkiv, Ukraine
Corresponding Author E-mail: azad.88@hotmail.com
DOI : https://dx.doi.org/10.13005/bpj/3077
Abstract
Digital medical images study, analysis and processing is one of medical visualization areas, which helps to improve diagnostic diseases and detection, monitoring their progression and treatment. In this regard, the analysis of cytological images is important and effective, it allows to study various cellular structures. One of the components of such research is the allocation of potential areas of interest, considering the specifics of color medical images presentation. The paper proposes a new combined approach for identifying potential areas of interest based on edge detection operators, which is compared with the corresponding classical methods. It is shown that the proposed combined approach gives results no worse than classical methods, and for some types of images, even better. At the same time, resulting images quality assessments compactness is achieved, the range of the obtained results for making effective decisions is expanded depending on the specification of the analysis goals. It is shown that for images with a semi-transparent background, low-contrast difference between the background and objects of interest the proposed approach, in comparison with classical approaches, provides superiority in terms of niqe quality assessment of at least 10%, brisque quality assessment of more than 20%, derivative assessments (ME and AE) – 7.5% and 1%, respectively. The analysis of potential areas of interest details based on the processed images visualization results is the best for the combined approach in all cases. At the same time, the study provides an answer to the best combination of edge detection operators in individual color channels and without using pre-processing methods of the original image. This allows for increased efficiency of clinical trials in making a diagnosis.
Keywords
Color Channels; Cytological Image; Edge Detection; Image Processing; Medical Image; Microscopic Smear; RGB Format
Download this article as:| Copy the following to cite this article: Babker A, Suliman R. S, Ghazwani A. A. M, AlHarbi W, Lyashenko V. Combined Use of Edge Selection Operators in Individual Color Channels for the Analysis of Cytological Images Presented in RGB Format. Biomed Pharmacol J 2025;18(March Spl Edition). |
| Copy the following to cite this URL: Babker A, Suliman R. S, Ghazwani A. A. M, AlHarbi W, Lyashenko V. Combined Use of Edge Selection Operators in Individual Color Channels for the Analysis of Cytological Images Presented in RGB Format. Biomed Pharmacol J 2025;18(March Spl Edition). Available from: https://bit.ly/41nD7eF |
Introduction
Cytological images are one of information sources for decision-making in medical practice for the diseases and diagnosis detection, monitoring the disease progress and its treatment 1-4. Among cytological images, images of various cells should be highlighted, including blood cells, which are used for primary diagnosis or more detailed examination of a certain disease 5, 6. Thus, the analysis of cytological images is constantly in the field of view of researchers and doctors.
Cytological images are mainly microscopic images presented in color. Various methods of staining microscopic smears are used for these purposes 7, 8. Each method has its own specifics, purposes for staining and disadvantages. A common disadvantage of staining is the uneven distribution of the dye in the smear and, as a result, insufficient staining of certain objects for their accurate identification 9, 10. Ultimately, this affects the solution of various problems of studying microscopic smears, the precise selection of objects of study. Therefore, the task of improving the analysis quality for the necessary objects of interest selection arises.
The most common format for digital representation of cytological images is the RGB format 4, 11, 12. RGB format – Red, Green, and Blue (A type of color space for representing color images). For the purposes of analysis, various methods and approaches to digital image processing are used 13-17. Among such methods, edge detection should be highlighted. This can be used for segmentation, identification and determination of potential areas of interest. For example, study 18 considers issues of improving edge detection in cytological images of the cervix. The authors emphasize the need to color the smear under study and the complexity of automatic detection of cell nuclei. Such complexity, as the researchers of the article claim, is associated with uneven coloring of all samples and, consequently, a decrease in the accuracy of cell nuclei detection. For the purposes of the study, the authors consider a whole classifier system that allows dividing cells into aberrant and normal, based on the available data. E. Chen, H. N. Ting, J. Huang Chuah, and J. Zhao review approaches to segmentation of overlapping cells in cervical cytology images, which also considers edge detection methods 19. The authors emphasize the importance of the staining of the smear being examined, but at the same time draw attention to the fact that in conditions of overlapping cells, uneven staining distribution across the smear complicates clear detection of the cell edge and subsequent segmentation procedure. The paper shows that traditional machine learning methods and deep learning methods can be used for research purposes. This emphasizes the complexity and versatility of the possible solution to the problem posed. The paper 20 considers a diagnostic system for detecting cancer cells in cytological images of pleural effusion. The basis of such a system is the edge detection methods. It is important to have an automated system for screening cytological images. However, such systems face the disadvantages of smear staining. Therefore, to improve the accuracy of detecting the necessary areas of interest, the authors use several morphological operations to clarify the initial results. N. Merlina, E. Noersasongko, P. N. Andono, M. A. Soeleman and D. Riana analyze the efficiency of using preliminary processing methods to detect cell boundaries in images of smears of cytological preparations 21. The authors note that the complexity of the cell structure, their possible overlapping and uneven distribution of the staining preparation lead to poor image contrast. This affects the efficiency of edge detection and complicates automatic visual interpretation of the presented data. To solve this problem, the authors explore the possibility of using edge detection operators such as Robert’s and Prewitt’s. Article 22 studies the issues of pixel segmentation of cytological images, where edge detection methods are also considered.
An interesting approach is described in the work of H. Alquran, A. Badarneh, M. Alsalatie, W. A. Mustafa and B. Alquraan, which is based on the use of image channel transformation methods 23. For these purposes, the authors consider individual color channels of the RGB and HSV representation of the original image, which are used for such analysis. In this case, the authors select the channels with the best results. However, this approach does not significantly eliminate the inefficiency of staining the smear under study. In this case, it is advisable to consider all channels in each individual digital representation format of the input image. And then obtain the resulting image considering the data on individual channels for each digital image representation format. At the same time, different edge detection operators can be used in each color channel, which should increase the overall efficiency of detecting potential areas of interest.
Thus, the key objective of this work is to investigate the combined use of edge detection operators in individual color channels for the analysis of cytological images presented in RGB format.
Materials and Methods
General methodology for conducting the study and examples of cytological images for analysis
To achieve the goal of this study, it is necessary to consider various edge detection options for color cytological images. Here it is advisable to highlight:
the classical approach, which involves preliminary conversion of a color image from RGB format to monochrome format (or gray format) with subsequent edge detection by some operator and superimposition of the results on the input image.
This approach, which involves decomposing a color image in RGB format into separate color channels with subsequent processing by the same edge detection operator, merging the obtained results and superimposing them on the input image. This is the so-called improved classical approach.
the combined use of different edge detection operators in separate color channels, merging the obtained results and generalizing them on the input image.
Next, the obtained results are compared using a certain set of quality assessments of the processed images and the obtained results are generalized.
The general scheme of such a study is presented in Fig. 1.
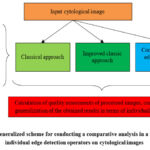 |
Figure 1: Generalized scheme for conducting a comparative analysis in a study using individual edge detection operators on cytological images |
At the same time, the corresponding formalization of the approach under consideration is presented as follows:
For the classical approach
![]()
where
BRGB– original input color cytology image,
Bgray– converted image in gray format,
{EDGE}– a set of edge extraction operators that are used in the study,
Bedge – processed image after applying the edge selection operator,
BRGBՌBedge – overlay image of edge extraction results and input image,
{QA} – evaluations of the resulting image quality,
RC(QA) – a set of quality scores for comparison for the classical approach.
For an improved classical approach
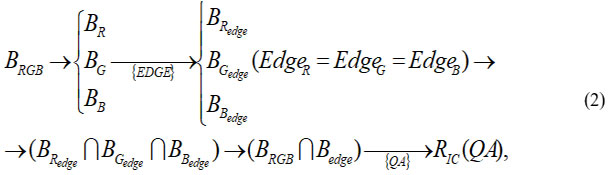
where
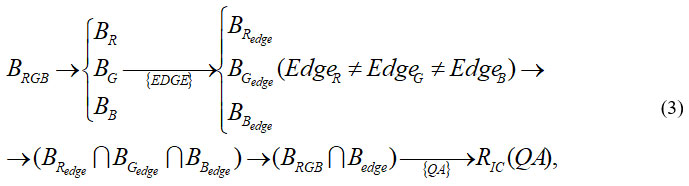
BR,BG,BB – decomposition of the original input image BRGB into separate color channels R, G, B,
BRedge,BGedge,BBedge– edge selection results in individual color channels. Here the edge selection operator is the same for each color channel (EdgeR = EdgeG = EdgeB ),
BRedgeՌBGedgeՌBBedge – merging the edge selection results in each channel into a single image,
RIC(QA) – a set of quality scores for comparison for the improved classical approach.
For the combined use of edge detection operators
Thus, the essence of the corresponding study in this article is carried out according to the presented in Fig. 1 and on the basis of the formalization presented above. For these purposes, various examples of cytological images are considered, which are presented below. All images are in the public domain and were used in our earlier work.
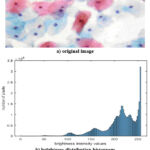 |
Figure 2: Cytology image as a representation of the multifaceted presentation of color medical imaging – Example 1 |
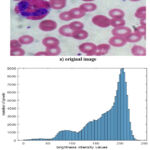 |
Figure 3: Cytology image as a representation of the multifaceted presentation of color medical imaging – Example 2 |
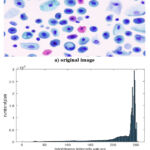 |
Figure 4: Cytology image as a representation of the multifaceted presentation of color medical imaging – Example 3 |
Each figure, which will be referred to hereafter as Example 1, Example 2 and Example 3, shows cytological images and their corresponding brightness distribution histogram.
It should be noted that all images in Fig. 2a, Fig. 3a and Fig. 4a differ from each other. These images have different data formation textures, color gamut of the studied details representation, visualization contrast, and difference in brightness between the background and objects of interest. The difference in the presented samples of microscopic cytological smears is emphasized by the histograms of the brightness distribution, which can be seen from Fig. 2b, Fig. 3b and Fig. 4b. All this emphasizes the complexity of solving the task at hand, which must be performed automatically. At the same time, it is necessary to talk about the typicality of such images, which allows us to generalize the results obtained. In this case, it is important not so much to determine the contours of the cells, as to highlight potential areas of interest, which are various elements of such cells.
Edge detection and image quality assessment methods used in the study
A prerequisite for conducting this study is a specific set of edge detection operators selection. Among such operators, the most popular are classic edge detection detectors 24, 25. Among such detectors, the following are usually considered: Prewitt, Roberts, Sobel, LoG and Canny operators 26, 27. Each of the edge detection operators has its own characteristics and disadvantages. However, the most common for processing digital microscopic medical images are Sobel, LoG and Prewitt operators 28, 29. This choice takes into account the medical images formation and presentation conditions, and their visualization features.
So, the Sobel edge detection operator is based on convolution of the image with small separable integer filters in the vertical and horizontal directions 30. The Sobel operator allows finding the direction of the greatest increase in brightness and the magnitude of its change in this direction at each point in the image 31, 32. It is easy to use and easy to calculate, which expands the possibilities of application and obtaining reliable results.
The LoG operator is calculated as the sum of the differences on the neighbors of the central pixel 33, 34. At the same time, the LoG operator allows for significant detailing of both small details and wider edge transitions. This makes it indispensable in the study of microscopic medical images, which include cytological images.
The Prewitt operator finds the local orientation of the edge at each pixel 35, 36. This operator was specifically designed for edge detection in medical images.
Thus, the edge detection operators used for the analysis in this study are Sobel, LoG, and Prewitt.
No less important, but problematic is the issue of choosing the quality assessments of the resulting images, which is confirmed by many relevant studies 37-40. This is due to both the multitude of such assessments and the issue of choosing such assessments in a particular case, which is determined by the task being solved. Since this study conducts a comparative analysis of the quality of areas of interest selection, it seems appropriate to choose no-reference quality assessments. This is because in this case it is difficult to determine the reference model with which the necessary comparison will be made. Moreover, the choice of such a model is subjective.
Based on the above, the most popular no-reference quality assessments are: niqe and brisque 41-43. These assessments allow us to evaluate the quality of naturalness and spatial quality of the image under study, respectively. Lower values of such assessments indicate a better quality of the resulting image perception, which is important in medical visualization. At the same time, these assessments allow us to talk about the possibility of considering derivative assessments. This is important if the assessments have a significant spread in indicators relative to each other.
In the first case, we should consider the multiplication of such estimates ME:
![]()
where
n – niqe assessment,
b – brisque assessment.
In the second case, additivity AE:
![]()
If necessary, for the purpose of efficient data visualization, the normalized niqe and brisque estimates (estimates that are brought to a common measurement scale for comparison purposes) can be considered when considering the multiplication and additivity of such estimates.
Results
Considering the results obtained during the processing of the cytological images studied by various edge detection operators, we will first pay attention to the classical approach effectiveness and the improved classical approach. Table 1 presents the results of edge detection by various operators based on the images processing, considered Example 1, Example 2 and Example 3. Such results are presented in the form of individual indicators values for assessing the resulting images quality.
Table 1: The resulting images quality assessments after their processing by different edge detection operators (case of classical and improved classical approaches)
| Edge highlight operator | Quality assessments/classical approach | Quality assessments/improved classical approach | |||||||
| niqe | brisque | ME | AE | niqe | brisque | ME | AE | ||
| Image – Example 1 | |||||||||
| Sobel | 25.7389 | 53.4262 | 1375.1316 | 79.1651 | 28.4477 | 53.3857 | 1518.7003 | 81.8334 | |
| LoG | 27.4630 | 43.4610 | 1193.5694 | 70.9240 | 21.9946 | 43.4583 | 955.8457 | 65.4528 | |
| Prewitt | 25.6791 | 52.9653 | 1360.1012 | 78.6444 | 27.3835 | 53.1094 | 1454.3212 | 80.4929 | |
| Image – Example 2 | |||||||||
| Sobel | 26.6862 | 54.8421 | 1463.5272 | 81.5283 | 31.8181 | 54.4291 | 1731.8305 | 86.2472 | |
| LoG | 35.0309 | 49.0205 | 1717.2322 | 84.0514 | 39.0471 | 43.4659 | 1697.2173 | 82.513 | |
| Prewitt | 27.3443 | 54.8270 | 1499.2059 | 82.1713 | 31.9586 | 54.2728 | 1734.4827 | 86.2314 | |
|
Image – Example 3 |
|||||||||
| Sobel | 20.9890 | 47.2352 | 991.4196 | 68.2242 | 17.3445 | 49.9855 | 866.9735 | 67,33 | |
| LoG | 21.8886 | 52.0877 | 1140.126 | 73.9763 | 15.8190 | 47.0056 | 743.5815 | 62.8246 | |
| Prewitt | 20.9404 | 47.1556 | 987.4571 | 68.096 | 18.3299 | 49.9631 | 915.8186 | 68.293 | |
Here and below, the most significant assessments are highlighted in bold and underlined font.
It should be noted that for each image, its own assessment types prevail in each specific case of using edge detection operators. This emphasizes the differences in the presented images, their complexity and the uniqueness of conducting the corresponding analysis. The greatest unity in the presented assessments is observed in terms of derived assessments (ME and AE).
It should also be noted that the Prewitt operator, as a specialized edge detection operator for medical images, does not always give the best result.
Table 2 presents the edge detection operators combined use results for the image Example 1 (Fig. 2a). This cytological image is characterized by the fact that some cellular structures are translucent and some of them are slightly visible against the background. This generally complicates the edge detection and potential areas of interest identification process.
From here on, the abbreviation for the combined edge selection operator means in the first place is the first letter of the edge operator Sobel (S), LoG (L) or Prewitt (P) for the R color channel, in the second place is for the G color channel, and in the third place is B, for the original image presented in RGB format.
Table 2: Processed image Example 1 quality assessments after combined processing with different edge detection operators in different color channels
| Combined edge selection operator | Quality assessments | |||
| niqe | brisque | ME | AE | |
| SLP | 22.3574 | 43.7738 | 978.6683 | 66.1312 |
| SPL | 22.6336 | 43.4583 | 983.6177 | 66.0919 |
| LSP | 22.2815 | 43.7063 | 973.8419 | 65.9878 |
| LPS | 22.4599 | 43.7098 | 981.7177 | 66.1697 |
| PSL | 22.8204 | 43.4584 | 991,7380 | 66.2788 |
| PLS | 20.2594 | 43.7983 | 887.3272 | 64.0577 |
As can be seen from the data in Table 2, the most effective combined form of original image Example 1 processing is the combination – PLS (channel R – operator Prewitt, channel G – operator LoG, channel B – operator Sobel).
When comparing the data in Table 2 and the corresponding data in Table 1, it should be emphasized:
In terms of niqe quality assessment, the combined approach to image processing Example 1 exceeds the corresponding indicators in both the classical and improved classical approaches. This superiority is at least 10%,
In terms of brisque quality assessment, the combined approach to image processing Example 1 is no worse than the data from the classical and improved classical approaches. Moreover, in the combined approach, the brisque quality assessment is approximately at the same level for various combinations of edge detection operators for different color channels. In general, this allows us to talk about the effectiveness of the combined approach in terms of brisque assessment in comparison with the data in Table 1, by more than 20%. This increases this cytological images type processing efficiency by the combined approach for identifying areas of interest,
According to the derivative estimates (ME and AE), it is also worth noting the superiority of the combined approach to identifying potential areas of interest based on edge detection operators in comparison with the classical and improved classical approaches. The minimum value of such superiority is 7.5% for the ME estimate and 1% for the AE estimate. It should also be noted here that there are minor fluctuations in the derived estimates (ME and AE) for the combined approach, which cannot be said about the data for the classical and improved approaches.
No less important is the visual examination of the results obtained. Figure 5 shows some results of the corresponding image processing Example 1.
From the data in Fig. 5 it is evident that processing the original image Example 1 with the improved classical approach using the LoG operator gives good detailing of the areas of interest. However, many false points appear, which complicates further processing of such an image.
The original image Example 1 processing using the classical approach based on the Prewitt operator does not provide sufficient detail; many potential areas of interest are missed, which necessitates original image additional processing.
Processing the original image Example 1 with a combined approach based on the PLS combination yields good detailing. At the same time, the number of false points is significantly smaller than in the case of processing with an improved classical approach using the LoG operator. Moreover, such false points can be eliminated using simple filtering methods. This is more difficult to do than the image shown in Fig. 5a.
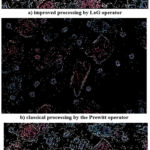 |
Figure 5: The result of image processing Example 1 using different approaches as a result of reflecting the superiority of the combined approach |
In general, the presented results for the image Example 1 are acceptable, given the complexity of this image. Moreover, our main task is to show the possibility and feasibility of using the proposed combined approach to processing cytological images without any preliminary processing of the input image.
Table 3 shows the edge detection operators combined use results for the image Example 2 (Fig. 3a). This image has a significant difference between the color and contrast of the background and potential areas of interest. In addition, small details in the form of platelets and places where false highlights are observed in the background should be noted in the image. All of that can complicate the corresponding process and affect the result.
Table 3: Processed image Example 2 quality assessments after combined processing with different edge detection operators in different color channels
| Combined edge selection operator | Quality assessments | |||
| niqe | brisque | ME | AE | |
| SLP | 37.0737 | 51.5409 | 1910.8118 | 88.6146 |
| SPL | 36.6371 | 49.6971 | 1820.7576 | 86.3342 |
| LSP | 43.6763 | 43.5209 | 1900.8318 | 87.1972 |
| LPS | 42.6602 | 43.4167 | 1852.1651 | 86.0769 |
| PSL | 37.8903 | 49.3671 | 1870.5342 | 87.2574 |
| PLS | 37.4086 | 51.2971 | 1918.9526 | 88.7057 |
When examining the data in Table 3 in comparison with the corresponding data in Table 1, it should be noted:
All the considered values estimates are more compact for the proposed combined approach in comparison with such estimates for the classical and improved classical approaches,
Niqe estimates in the classical and improved approaches are less than niqe estimates for the combined approach. The opposite is also observed for some positions,
Brisque estimates in the combined approach are generally better in comparison with brisque estimates for the classical and improved classical approaches,
The values of the derived estimates (ME and AE) for the classical and improved classical approaches are also less than the corresponding values of the estimates for the combined approach.
Considering the above, we will conduct a the best results visual comparison in each of the approaches under consideration (Fig. 6).
The data in Fig. 6a show that the use of the classical approach based on the Sobel edge extraction operator in this case does not sufficiently detail the possible areas of interest. This concerns the cell nuclei and the structure of the megaloblastic anemia cell. At the same time, small details such as platelets are highlighted.
Using an improved classical approach based on the LoG edge detection operator gives good detailing of all features of potential areas of interest (Fig. 6b). However, false highlights present in the background are also identified. This adds many false points. Ultimately, all this complicates the overall procedure of identifying areas of interest.
The use of a combined approach based on its SPL variety allows for good detailing of potential areas of interest (Fig. 6c). At the same time, false points are almost absent.
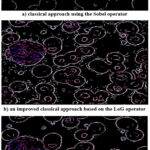 |
Figure 6: The result of image processing Example 2 using different approaches as a result of reflecting the superiority of the combined approach |
Considering that for the image Example 2 the corresponding quality assessments are contradictory, one should rely on the obtained results visualization. Thus, the combined approach considered also shows a good result in this case. At the same time, to improve the proposed approach, attention should be paid to the selection of the resulting image more effective estimates. For example, for these purposes, the opinions of experts can be considered. Nevertheless, in any case, the proposed combined approach expands the base for research and gives practicing doctors the opportunity to choose the best presentation of the original images processing results.
Table 4 shows the edge detection operators combined use results for the image Example 3 (Fig. 4a). This image has different areas: with a clear separation of the background and objects of interest, individual objects complex detailing, minor differences in color and contrasts between objects and the background. All of that imposes its own peculiarities on this image analysis.
Table 4: Processed image Example 3 quality assessments after combined processing with different edge detection operators in different color channels
| Combined edge selection operator | Quality assessments | |||
| niqe | brisque | ME | AE | |
| SLP | 15.6629 | 49.7585 | 779,3624 | 65,4214 |
| SPL | 15.5564 | 49.5637 | 771,0327 | 65,1201 |
| LSP | 15.8833 | 49.9519 | 793,4010 | 65,8352 |
| LPS | 15.8744 | 49.9082 | 792,2627 | 65,7826 |
| PSL | 15.5710 | 49.5588 | 771,6800 | 65,1298 |
| PLS | 15.6143 | 49.6973 | 775,9885 | 65,3116 |
The data in Table 4 analysis shows that
The niqe evaluation values for the combined approach are the best in all cases of such consideration in comparison with the classical and improved classical approaches. Also, in general, the niqe evaluation values for the combined approach are more compact,
The values of the brisque estimates for the combined approach are also more compact in comparison with the classical and improved classical approaches. In general, such estimates for the combined approach are not worse than the estimates for the classical and improved classical approaches. It can be seen that such estimates values are in the middle of estimates values set for the classical and improved classical approaches,
The derived estimates (ME and AE) are multifaceted. Thus, in comparison with the classical approach, the ME estimates for the combined approach are better. This should also be said regarding the values of the AE estimates. In comparison with the improved classical approach, the ME estimates for the combined approach are inthe former values middle. The same is also characteristic of the AE estimates.
Thus, positive results are also observed here for the combined approach compared to the classical and improved classical approaches for the purpose of identifying potential regions of interest based on edge detection operators.
Fig. 7 shows the results of the best extraction of areas of potential interest for the image Example 3 based on different approaches used for its processing.
The data in Fig. 7a show insufficiently complete selection of all potential areas of interest. This concerns those cells whose color merges with the background color and is low contrast. The detailing of individual cellular structures is also insufficient.
Better detailing of potential areas of interest is observed based on the data in Fig. 7b and Fig. 7c. Here, cells whose color merge with the background color and are low-contrast are more clearly drawn. Various cellular structures are also better visible. At first glance, the data in Fig. 7b and Fig. 7c seem identical, but this is not so. In Fig. 7c, compared to Fig. 7b, cellular structures with an edge effect are better drawn. This is visible at the bottom of each Fig. 7b and Fig. 7c when comparing them. Such edge effects are sometimes useful for analysis, since they necessitate additional studies.
 |
Figure 7: The result of image processing Example 3 using different approaches as a result of reflecting the superiority of the combined approach |
Thus, overall, the combined approach also shows good results for the image Example 3.
At the end of the obtained results review, we will briefly dwell on the importance of considering the quality assessment generalized indicators. First, the compactness of their values is striking, which indicates the combined approach considered effectiveness (see Fig. 8 for the different images presented).
 |
Figure 8: Individual images processing results using different approaches, summarized based on ME and AE estimates |
The nest is shown here: magenta triangular marks – generalized quality estimates of ME and AE when processing images using the combined approach; a red circle mark (operator Sobel), green (operator LoG), blue (operator Prewitt) are used when processing images using the classical approach; a yellow circle mark (operator Sobel), black (operator LoG), cyan (operator Prewitt) are used when processing images using the improved classical approach.
It is evident from the data in Fig. 8 that the ME and AE assessments results are compact precisely for the combined approach in comparison with the classical and improved classical approaches. The disadvantages are the fact that such assessments do not always fully reflect the dynamics of comparison by means of primary assessments (niqe and brisque), which was mentioned when considering the data on assessments in separate tables above. Also, the generalized assessment should include obtained results visualization assessments, which will allow making more balanced decisions. In this case, detailing the areas of potential interest under consideration is important. Nevertheless, this does not reduce the overall assessment of the proposed combined approach and the feasibility of its practical use. The noted shortcomings can be the basis for further research.
It should also be noted that the combined approach generally prevails. However, each specific case has its own most effective combination of image processing. Most likely, this is due to the difference in the efficiency of using individual edge selection operators and the unevenness of the color of the smears, which is reflected in the presentation of the overall color in the form of individual color channels. This necessitates additional research to examine in detail the potential limitations of the combined approach in specific scenarios and propose options to overcome them. The general concept of the combined approach is also considered here, and the feasibility of its application is substantiated.
Discussion
Medical information using digital images presentation and study is one of the powerful tools for diagnosing diseases, determining ways for their treatment and monitoring such processes 44-48. Each specific case uses a specific type of medical images and information, which creates the need to address individual specific issues. Thus, there is a need to use different methods of processing and analyzing the relevant information 49–52. This explains the growing interest in the field of such research and the emergence of many different scientific and practical works. Among such studies, a special place is occupied by works that consider methods and approaches to the analysis of cytological images.
In their work, N. A. Alias, W. A. Mustafa, M. A. Jamlos, Nasrudin, M. A. S. Mansor and H. Alquran focus on preliminary procedures for improving the input image quality18. In particular, the authors propose using contrast enhancement to improve edge detection efficiency for the purpose of identifying the nuclei of the cells under study. This allowed us to state that this approach improves the detection of cell nuclei by 6.15% compared to similar studies and reaches 90% in the case of identifying cells among seven classes 18. Our study is different in that it does not consider preliminary procedures for improving the input image but investigates the feasibility of using a new approach to highlight potential areas of interest in the original input images. In addition, our work contains comparative studies of the proposed approach with classical approaches. It is shown that the efficiency of the approach proposed in our work ranges from 1 to 20% compared to classical methods and depends on the features of the image being processed.
K. Y. Win, S. Choomchuay, K. Hamamoto, M. Raveesunthornkiat, L. Rangsirattanakul and S Pongsawat also use input image preprocessing methods in their study of cytological images 20. These methods include brightness intensity adjustment and median filtering to improve the quality of the original image. Edge detection and edge correction methods were used to extract cell nuclei. This highlights the importance of analyzing different approaches used for edge detection. The authors of the study 20 achieved 98.7% cell identification accuracy and the sensitivity of the method was 87.97. The work pays special attention to images with overlapping cells. In this regard, this position echoes our studies, which contain translucent images of cells and their similarity to the surrounding background. In their work 20, the authors emphasize the effectiveness of the proposed hybrid approach, which also echoes our ideas on the use of a combined approach for edge detection.
The study by N. KT, K. Prasad and B. M. K. Singh provides a detailed review of the methods and approaches for analyzing images of red blood cells, their extraction and identification 53. The need to automate this process is emphasized, which determines the feasibility of developing new methods using image processing. This is completely consistent with the main ideas of our study, its main goal. The authors of 53 also note the importance of considering edge detection methods as a basis for analyzing images of red blood cells. The work emphasizes the use of hybrid methods for analyzing images of red blood cells as a type of cytological image. This makes the above-mentioned combined approach to edge detection appropriate for identifying potential areas of interest. The work 53 emphasizes that previously developed approaches had good characteristics of the accuracy of identifying individual cellular structures in a blood smear, at least 90%. However, with the transition to processing color images and the use of different methods of their coloring, there is a need to use new approaches to carry out the appropriate analysis.
The work of C. Di Ruberto, A. Loddo and L. Putzu is devoted to the detection of red and white blood cells from microscopic images of blood 54. For this purpose, a new combined approach for the detection and quantification of individual blood cells is proposed, where special attention is also paid to edge detection methods. For the malaria parasite database, the accuracy in the range of 89–99% was achieved 54. However, for the erythrocyte database, the detection accuracy fluctuates in the range of 96–98% for 180 images 53. Thus, the relative comparison of the results obtained in different works is not always objective. This is due to the fact that such accuracy depends on the type of processed images. In this regard, our study provides a comparison of the classical approach and the proposed combined approach on the same images. This increases the overall assessment of the results obtained.
B. K. Das, K. K. Jha, and H. S. Dutta analyze blood cells using different edge extraction operators 55. The paper considers such elements of cellular structures as nuclei and cytoplasm. For the purposes of analysis, edge extraction operators such as Canny, Sobel, and Laplacian of a Gaussian are considered in comparison with the approach proposed by the authors. The authors achieved 85% accuracy for identifying different cell types 55. This is fully consistent with the results presented above.
F. Al-Hafiz, S. Al-Megren and H. Kurdi consider the issues of erythrocyte segmentation using a threshold value and a Canny detector 56. First of all, the authors emphasize that automation of the erythrocyte segmentation process remains a complex task, which gives rise to the development of new methods and approaches to its solution. For these purposes, the authors propose to initially use a number of improvements in local and global details of the input data based on morphological operations. Next, the Canny edge detection operator is used. In general, this approach provides an accuracy of 87.9% 56. This is also consistent with the results obtained and described above. Moreover, it can be said that the classical use of edge detection operators does not always give the optimal result, which is confirmed in study 56. At the same time, as noted in article 53, the analysis of medical cytological images, where predominantly classical approaches based on traditional edge detection methods are used, does not exceed 5% of the total number of such studies. This gives rise to the development of new modified algorithms for edge detection in medical images.
N. Merlina, E. Noersasongko, P. N. Andono, M. A. Soeleman, and D. Riana pay special attention to the methods of pre-processing the original image for more efficient edge detection in medical images 21. In this study, the efficiency of edge detection using the Robert and Prewitt operators is considered. A specific method of staining the studied smears, which gives poor contrast, is also considered 21. Thus, the authors know in advance the necessity of using the methods of pre-processing the original image. But this cannot always be known, especially when automating the relevant processes. The result of the accuracy of detection of the necessary cells and their nuclei, which was obtained in the work 21, is 86.8%. At the same time, it is not clear to which edge detection method this result refers. In our study, individual edge detection methods and characteristics of the results obtained in each case are clearly distinguished.
H. Alquran, A. Badarneh, M. Alsalatie, W. A. Mustafa and B. Alquraan also explore the possibility of the cell nuclei identification efficiency increasing in a smear based on digital image analysis 23. Here, different color channels are also allocated for subsequent analysis. However, such allocation does not imply different edge detection methods combined use. In fact, the authors use individual channels as the original image representation modification in gray format. In this case, the accuracy of 88.3% is achieved 23. At the same time, the work emphasizes that the disadvantage of representing color digital medical images is poor contrast and uneven coloring 23. Yes, any color channel can give a better result, but other channels can provide additional information and increase the detection accuracy. For these purposes, it is important to use the individual channels results combination. This is what the approach described in our study suggests.
The above confirms that the topic under consideration is in demand and corresponds to the key provisions of the analysis in the field of color cytological image processing for decision making. At the same time, many provisions are confirmed by the corresponding conclusions of other authors and substantiate the feasibility of further research in this area.
Conclusion
This paper presents a new combined approach to using edge detection operators in individual color channels for analyzing cytological images presented in RGB format. This approach is compared with classical and improved classical approaches for detecting potential areas of interest in cytological images. For these purposes, color cytological images of varying complexity and edge detection operators such as Sobel, LoG, and Prewitt are considered. To evaluate the results, niqe and brisque scores, as well as their multiplicative (ME) and additive (AE) combinations, are used.
The proposed combined approach strength is the possibility to obtain a set of original image processing results, possessing the property of their results estimates compactness in comparison with classical approaches. This expands the possibility of research choice for doctors, since in many cases the combined approach gives better values of estimates. The problematic aspect of the proposed combined approach is the need to improve the derivative estimates of the processing results (ME and AE), since in some cases such estimates are not the best in comparison with simple estimates (niqe and brisque).
A number of experiments were conducted, the results of which are presented in the form of a different assessments set, which is effective for conducting a comparative analysis. Also, the processing results are visualized in the form of different images for some approaches that were applied to processing the original images. This allows us to draw conclusions regarding the quality assessments used for the processing results obtained.
The main direction of these studies continuation is to consider the improvement of derivative estimates for the comparing the obtained results purposes. It is also important to expand such studies: study of possible ways of combining intermediate results in each channel into a single whole, study of contrasting to increase the efficiency of identifying potential areas of interest. A separate topic of research is a detailed study of the potential limitations of the combined approach in specific scenarios and the formalization of options for overcoming them.
Acknowledgement
The authors are thankful to the Department of Media Systems and Technology, Kharkiv National University of Radio Electronics, Kharkiv, Ukraine, and the Department of Medical Laboratory Sciences, College of Health Sciences, Gulf Medical University, Ajman, United Arab Emirates, for providing support and facilities.
Funding Source
The author(s) received no financial support for the research, authorship, and/or publication of this article
Conflict of Interest
The author(s) do not have any conflict of interest.
Data Availability Statement
This statement does not apply to this article.
Ethics approval
This research did not involve human participants, animal subjects, or any material that requires ethical approval.
Informed Consent Statement
This study did not involve human participants, and therefore, informed consent was not required
Clinical Trial Registration
This research does not involve any clinical trials
Author Contributions
Vyacheslav Lyashenko and Asaad Babker: Conceptualization, Methodology, Writing and Original Draft.
Vyacheslav Lyashenko and Asaad Babker: Data Collection, Analysis, Writing Review and Editing.
Vyacheslav Lyashenko: Visualization, Supervision, Project Administration.
Asaad Babker, Rania Saad Suliman, Aisha Ali M Ghazwani ,Wiam AlHarbi: Funding Acquisition: Resources, Supervision.
The final manuscript was read and approved by all authors.
References
- Jiang H, Zhou Y, Lin Y, Chan RC, Liu J, Chen H. Deep learning for computational cytology: A survey. Image Anal. 2023;84:102691. doi:10.1016/j.media.2022.102691
CrossRef - Saini T, Bansal B, Dey P. Digital cytology: current status and future prospects. Diagnostic Cytopathology 2023;51(3):211-218. doi:10.1002/dc.25099
CrossRef - Babker AMAA, Gameel FEMH. Molecular Characterization of Prothrombin G20210A gene Mutations in pregnant Sudanese women with spontaneous recurrent abortions. Rawal Med J. 2015;40(2):207-209. https://www.rmj.org.pk/fulltext/27-1418133455.pdf
- Rabotiahov A, Kobylin O, Dudar Z, Lyashenko V. Bionic image segmentation of cytology samples method. In: 2018 14th International Conference on Advanced Trends in Radioelectronics, Telecommunications and Computer Engineering (TCSET). IEEE; 2018:665-670. doi:10.1109/TCSET.2018.8336289
CrossRef - Babker AM, Suliman RS, Elshaikh RH, Boboyorov S, Lyashenko V. Sequence of Simple Digital Technologies for Detection of Platelets in Medical Images. Biomed Pharmacol J. 2024;17(1):141-152. doi:10.13005/bpj/2842
CrossRef - Aazad SK, Saini T, Ajad A, Chaudhary K, Elsayed EE. Deciphering Blood Cells-Method for Blood Cell Analysis using Microscopic Images. Journal of Modern Technology 2024;1(1):9-18. https://journal-of-modern-technology.com/wp-content/uploads/2024/09/Manuscript_2.pdf
- Georgia B, Prathiba R, Abilasha R. Comparative evaluation of conventional smear method with the novel smear hub method in the improved accuracy of interpretation of peripheral blood smears. Orofacial Sci. 2023;15(1): 92-98. doi: 10.4103/jofs.jofs_33_23
CrossRef - Aulia S, Suksmono AB, Mengko TR, Alisjahbana B. A Novel Digitized Microscopic Images of ZN-Stained Sputum Smear and Its Classification Based on IUATLD Grades. IEEE Access 2024;12:51364-51380. doi:10.1109/ACCESS.2024.3386208
CrossRef - Das S, Sheela SR. Pros and Cons of Air-Dried and Conventional Wet-Fixed Pap Smears: An Institutional Study. Hum. Biol. 2023;13(3):277-280. doi:10.4103/aihb.aihb_15_23
CrossRef - Torous VF, Cuda JM, Manucha V, Randolph ML, Shi Q, VandenBussche CJ, American Society of Cytopathology Clinical Practice Committee. Cell blocks in cytology: review of preparation methods, advantages, and limitations. Journal of the American Society of Cytopathology 2023; 12(2):77-88. doi:10.1016/j.jasc.2022.11.003
CrossRef - Mousavi SMH, Victorovich LV, Ilanloo A, Mirinezhad SY. Fatty Liver Level Recognition Using Particle Swarm optimization (PSO) Image Segmentation and Analysis. In: 2022 12th International Conference on Computer and Knowledge Engineering (ICCKE). IEEE; 2022:237-245. doi:10.1109/ICCKE57176.2022.9960108
CrossRef - Orobinskyi P, Petrenko D, Lyashenko V. Novel Approach to Computer-Aided Detection of Lung Nodules of Difficult Location with Use of Multifactorial Models and Deep Neural Networks. In: 2019 IEEE 15th International Conference on the Experience of Designing and Application of CAD Systems (CADSM). IEEE;2019:1-5. doi:10.1109/CADSM.2019.8779340
CrossRef - Khlamov S, Tabakova I, Trunova T, Deineko Z. Machine Vision for Astronomical Images Using the Canny Edge Detector. In: IX International Scientific Conference “Information Technology and Implementation” (IT&I-2022). Ceur-Ws; 2022:1-10. https://ceur-ws.org/Vol-3384/Paper_1.pdf
CrossRef - Khlamov S, Tabakova I, Trunova T. Recognition of the astronomical images using the Sobel filter. In: 2022 29th International Conference on Systems, Signals and Image Processing (IWSSIP). IEEE; 2022:1-4. doi:10.1109/IWSSIP55020.2022.9854425
CrossRef - Abu-Jassar AT, Al-Sharo YM, Lyashenko V, Sotnik S. Some Features of Classifiers Implementation for Object Recognition in Specialized Computer Systems. TEM J Technol Educ Manag Inform. 2021;10(4):1645-1654. doi:10.18421/TEM104-21
CrossRef - Al-Sharo YM, Abu-Jassar AT, Sotnik S, Lyashenko V. Neural networks as a tool for pattern recognition of fasteners. Int J Eng Trends Technol. 2021;69(10):151-160. doi:10.14445/22315381/IJETT-V69I10P219
CrossRef - Ahmad MA, Baker JH, Tvoroshenko I, Lyashenko V. Modeling the structure of intellectual means of decision-making using a system-oriented NFO approach. Int J Emerg Trends Eng Res. 2019;7(11):460-465. doi:10.30534/ijeter/2019/107112019
CrossRef - Alias NA, Mustafa WA, Jamlos MA, Nasrudin MW, Mansor MAS, Alquran H. Edge Enhancement and Detection Approach on Cervical Cytology Images. Journal of Advanced Research in Applied Sciences and Engineering Technology 2022;28(1):44-55. doi:10.37934/araset.28.1.4455
CrossRef - Chen E, Ting HN, Huang Chuah J, Zhao J. Segmentation of Overlapping Cells in Cervical Cytology Images: A Survey. IEEE Access 2024;12:114170-114189. doi:10.1109/ACCESS.2024.3445371
CrossRef - Win KY, Choomchuay S, Hamamoto K, Raveesunthornkiat M, Rangsirattanakul L, Pongsawat S. Computer aided diagnosis system for detection of cancer cells on cytological pleural effusion images. BioMed Res. Int. 2018;2018(1): doi:10.1155/2018/6456724
CrossRef - Merlina N, Noersasongko E, Andono PN, Soeleman MA, Riana D. Optimization of the preprocessing method for edge detection on overlapping cells at Pap smear images. JOIV: International Journal on Informatics Visualization 2023;7(2):471-476. doi:10.30630/joiv.7.2.1329
CrossRef - Harangi B, Bogacsovics G, Toth J, Kovacs I, Dani E, Hajdu A. Pixel-wise segmentation of cells in digitized Pap smear images. Data 2024;11(1):733. doi:10.1038/s41597-024-03566-9
CrossRef - Alquran H, Badarneh A, Alsalatie M, Mustafa WA, Alquraan B. Nucleus region detection of cervical cytology using image channel conversion techniques. In AIP Conference Proceedings. 3135(1). AIP Publishing;2024:020013. doi:10.1063/5.0212977
CrossRef - Spontón H, Cardelino J. A review of classic edge detectors. Image Processing On Line 2015;5:90-123. doi:10.5201/ipol.2015.35
CrossRef - Xian R, Lugu R, Peng H, Yang Q, Luo X, Wang J. Edge detection method based on nonlinear spiking neural systems. International journal of neural systems 2023;33(01): doi:10.1142/S0129065722500605
CrossRef - Pritha A, Fathima G. A Detailed Description on Various Techniques of Edge Detection Algorithms. Integrating Metaheuristics in Computer Vision for Real‐World Optimization Problems 2024:193-205. doi:10.1002/9781394230952.ch11
CrossRef - Yahya S, Elsanary H, Hassan M, Ali A. An Improved Edge Detection Method for Image Analysis in Diverse Domains. Aswan Sci. Technol. Bull. 2024: 1-19. doi:10.21608/astb.2024.310816.1004
CrossRef - Lv B, Liu F, Li Y, Nie J, Gou F, Wu J. Artificial intelligence-aided diagnosis solution by enhancing the edge features of medical images. Diagnostics 2023;13(6): doi:10.3390/diagnostics13061063
CrossRef - Venu DN. Segmentation Analysis for Local Maximum Edge Binary Patterns using Medical Images. IJFANS International Journal of Food and Nutritional Sciences 2023;12(1):917-927. https://www.researchgate.net/ profile/Nookala-Venu-2/publication/361923631_ Local_Maximum_Edge_Binary_ Patterns_for_Medical_ Image_ Segmentation/links/6499cacc95bbbe0c6ef6a47b/Local-Maximum-Edge-Binary-Patterns-for-Medical-Image-Segmentation.pdf
- Ranjan R, Avasthi V. Edge detection using guided Sobel image filtering. Wireless Personal Communications 2023;132(1):651-677. doi:10.1007/s11277-023-10628-5
CrossRef - Lu F, Tang C, Liu T, Zhang Z, Li L. Multi-attention segmentation networks combined with the sobel operator for medical images. Sensors 2023;23(5): doi:10.3390/s23052546
CrossRef - Mushtaq F, Bedi H. A Review Based on the Comparison between Canny Edge Detection and Sobel Algorithm. Kilby 2023;100: doi:10.2139/ssrn.4485325
CrossRef - Jie Y, Li X, Zhou F, Tan H. Medical image fusion based on extended difference-of-Gaussians and edge-preserving. Expert Systems with Applications 2023;227: doi:10.1016/j.eswa.2023.120301
CrossRef - Roy S, Das D, Lal S, Kini J. Novel edge detection method for nuclei segmentation of liver cancer histopathology images. Journal of Ambient Intelligence and Humanized Computing 2023;14(1):479-496. doi:10.1007/s12652-021-03308-4
CrossRef - Duong LT, Chu CQ, Nguyen PT, Nguyen ST, Tran BQ. Edge detection and graph neural networks to classify mammograms: A case study with a dataset from Vietnamese patients. Applied Soft Computing 2023;134: doi:10.1016/j.asoc.2022.109974
CrossRef - Yang C. Evaluation of edge detection algorithm of frontal image of facial contour in plastic surgery. Frontiers in Physics 2023;11: doi:10.3389/fphy.2023.1108393
CrossRef - Ding K, Ma K, Wang S, Simoncelli EP. Image quality assessment: Unifying structure and texture similarity. IEEE transactions on pattern analysis and machine intelligence 2020;44(5):2567-2581. doi:10.1109/TPAMI.2020.3045810
CrossRef - Ding K, Ma K, Wang S, Simoncelli EP. Comparison of full-reference image quality models for optimization of image processing systems. International Journal of Computer Vision 2021;129(4):1258-1281. doi:10.1007/s11263-020-01419-7
CrossRef - Wang X, Xiong J, Lin W. Visual interaction perceptual network for blind image quality assessment. IEEE Transactions on Multimedia 2023;25:8958-8971. doi:10.1109/TMM.2023.3243683
CrossRef - Liang Z, Lu W, Zheng Y, He W, Yang J. The context effect for blind image quality assessment. Neurocomputing 2023;521:172-180. doi:10.1016/j.neucom.2022.11.026
CrossRef - Mittal A, Soundararajan R, Bovik AC. Making a “completely blind” image quality analyzer. IEEE Signal Process Lett. 2012;20(3):209-212. doi:10.1109/LSP.2012.2227726
CrossRef - Mittal A, Moorthy AK, Bovik AC. No-reference image quality assessment in the spatial domain. IEEE Trans Image Process. 2012;21(12):4695-4708. doi:10.1109/TIP.2012.2214050
CrossRef - Venkatanath N, Praneeth D., Bh MC, Channappayya SS, Medasani SS. Blind image quality evaluation using perception based features. In: 2015 Twenty First National Conference on Communications (NCC). IEEE; 2015:1-6. doi:10.1109/NCC.2015.7084843
CrossRef - Diwakar M, Singh P, Garg D. Edge-guided filtering based CT image denoising using fractional order total variation. Signal Process. Control 2024; 92:106072. doi:10.1016/j.bspc.2024.106072
CrossRef - Zhang S, Metaxas D. On the challenges and perspectives of foundation models for medical image analysis. Image Anal. 2024; 91:102996. doi:10.1016/j.media.2023.102996
CrossRef - Kumar S, Singh J, Ravi V, Singh P, Al Mazroa A, Diwakar M, Gupta I. Utilizing Multi-layer Perceptron for Esophageal Cancer Classification Through Machine Learning Methods. The Open Public Health Journal 2024; 17: doi:10.2174/0118749445335423240808062700
CrossRef - Hoque MZ, Keskinarkaus A, Nyberg P, Seppänen T. Stain normalization methods for histopathology image analysis: A comprehensive review and experimental comparison. Information Fusion 2024; 102: doi:10.1016/j.inffus.2023.101997
CrossRef - Mohamed H, Abbas AM, Huneif MA, Alqahtani SM, Ahmed AM, Babker AM, Elagab EAM, Haris PI. Influence of Ramadan fasting on hemoglobin A1C, lipid profile, and body mass index among type 2 diabetic patients in Najran City, Saudi Arabia. Open Access Macedonian Journal of Medical Sciences 2021;9(B):318-325. doi:10.3889/oamjms.2021.6084
CrossRef - Dash S, Siddique M, Mishra S, Gelmecha DJ, Satapathy S, Rathee DS, Singh RS. Brain Tumor Detection and Classification Using IFF‐FLICM Segmentation and Optimized ELM Model. Journal of Engineering 2024;2024(1): doi:10.1155/2024/8419540
CrossRef - Pattnaik RK, Siddique M, Mishra S, Gelmecha DJ, Singh RS, Satapathy S. Breast cancer detection and classification using metaheuristic optimized ensemble extreme learning machine. International Journal of Information Technology 2023;15(8):4551-4563. doi:1007/s41870-023-01533-y
CrossRef - Mohapatra S, Siddique M, Paikaray BK, Riyazbanu S. Automated invasive cervical cancer disease detection at early stage through deep learning. J. Bioinf. Res. Appl. 2023;19(4):306-326. doi:10.1007/s42452-021-04786-z
CrossRef - Pattanaik RK, Mishra S, Siddique M, Gopikrishna T, Satapathy S. Breast Cancer Classification from Mammogram Images Using Extreme Learning Machine‐Based DenseNet121 Model. Sens. 2022;2022(1):2731364. doi:10.1155/2022/2731364
CrossRef - KT N, Prasad K, Singh BMK. Analysis of red blood cells from peripheral blood smear images for anemia detection: a methodological review. Biol. Eng. Comput. 2022;60(9):2445-2462. doi:10.1007/s11517-022-02614-z
CrossRef - Di Ruberto C, Loddo A, Putzu L. Detection of red and white blood cells from microscopic blood images using a region proposal approach. Biol. Med. 2020;116:103530. doi:10.1016/j.compbiomed.2019.103530
CrossRef - Das BK, Jha KK, Dutta HS. A new approach for segmentation and identification of disease affected blood cells. In: 2014 International conference on intelligent computing applications. IEEE;2014: 208-212. doi:10.1109/ICICA.2014.52
CrossRef - Al-Hafiz F, Al-Megren S, Kurdi H. Red blood cell segmentation by thresholding and Canny detector. Procedia Computer Science 2018;141:327-334. doi:10.1016/j.procs.2018.10.193
CrossRef

