
Manuscript accepted on :06-02-2025
Published online on: 28-02-2025
Plagiarism Check: Yes
Reviewed by: Dr. Sharath B S
Second Review by: Dr. Saad Mohammed Ali Taher Al-Momen
Final Approval by: Dr. Prabhishek Singh
Rohit Lamba1 , Pooja Rani2, Ravi Kumar Sachdeva3, Priyanka Bathla4, Karan Kumar1*, Vikas Mittal5and Kapil Joshi6
1Department of Electronics and Communication Engineering, MMEC, Maharishi Markandeshwar (Deemed to be University), Mullana, Ambala, India.
2MCA Department, MMICTBM, Maharishi Markandeshwar (Deemed to be University), Mullana, Ambala, India.
3Department of Computer Science and Engineering, Chitkara University Institute of Engineering and Technology, Chitkara University, Punjab, India.
4Department of Computer Science and Engineering, Chandigarh University, Gharuan, Mohali, Punjab, India.
5Department of Electronics and Communication Engineering, Chandigarh University, Gharuan, Mohali India.
6Department of Computer Science and Engineering, Uttaranchal Institute of Technology (UIT), Uttaranchal University, Dehradun, Uttarakhand, India.
Corresponding Author E-mail:karan.170987@gmail.com
DOI : https://dx.doi.org/10.13005/bpj/3075
Abstract
Lung cancer is one of the leading causes of death worldwide. Increasing patient survival rates requires early detection. Traditional methods of diagnosis often result in late-stage detection, necessitating the development of more advanced and accurate predictive models. This paper has proposed a methodology for lung cancer prediction using machine learning models. Synthetic minority over-sampling technique (SMOTE) is used before classification to resolve the problem of class imbalance. Bayesian optimization is used to enhance model’s performance. Performance of three classifiers adaptive boosting (AdaBoost), random forest (RF), and extreme gradient boosting (XGBoost) is evaluated both with and without hyperparmater optimization. Optimized models of RF, AdaBoost and XGBoost achieved accuracies of 96.11%, 95.74% and 95.92% respectively. Results demonstrate the effectiveness of combining machine learning classifiers, SMOTE, and hyperparameter tuning in improving prediction accuracy.
Keywords
AdaBoost; Lung Cancer; Machine Learning; Random Forest; XGBoost
Download this article as:| Copy the following to cite this article: Lamba R, Rani P, Sachdeva R. K, Bathla P, Kumar K, Mittal V, Joshi K. An Optimized Predictive Machine Learning Model for Lung Cancer Diagnosis. Biomed Pharmacol J 2025;18(March Spl Edition). |
| Copy the following to cite this URL: Lamba R, Rani P, Sachdeva R. K, Bathla P, Kumar K, Mittal V, Joshi K. An Optimized Predictive Machine Learning Model for Lung Cancer Diagnosis. Biomed Pharmacol J 2025;18(March Spl Edition). Available from: https://bit.ly/4ii6hCN |
Introduction
Lung cancer causes a significant portion of cancer-related fatalities. It causes more deaths than the total deaths from breast, colon, and cervical cancers. Cancer arises when cells in the body begin to proliferate uncontrollably. Lung cancer usually develops gradually and predominantly affects those aged 55 to 65. Lung cancer can be non-small cell (NSCLC) or small cell (SCLC) lung cancer. Eighty to eighty five percent of cases of lung cancer are of NSCLC. Ten to fifteen percent of cases are of SCLC. NSCLC is more commonly developed by smokers or ex-smokers. In cigarette smokers, there is a high chance of developing SCLC.1
The most typical sign of lung cancer is coughing, which can worsen with time, become more severe, and can even produce bloody sputum. Additional symptoms include haemoptysis, anorexia, weight loss, chest pain, and shortness of breath. Improving patient outcomes requires detection of lung cancer at early stage.2 Traditional methods of diagnosis can lead to diagnosis at late stage. Early-stage diagnosis can help in providing better treatment to patients. The diverse and complex characteristics of lung cancer make it challenging to identify early indicators using conventional clinical approaches.3,4
In recent decades, advent of machine learning has brought revolution in numerous fields by offering different tools for analysing patterns in large datasets. It has a big impact on the medical field as well.5
Authors evaluated three machine learning algorithms RF, AdaBoost, and XGBoost regarding their performance in lung cancer prediction. This paper introduced a novel approach for lung cancer detection by combining SMOTE for class imbalance handling and Bayesian optimization for hyperparameter tuning, ensuring enhanced accuracy for lung cancer detection. The aim of this research is to improve early-stage diagnosis of lung cancer by harnessing machine learning techniques.
The objectives of this research are as follows:
To perform comparative analysis of performance of three classifiers RF, AdaBoost, and XGBoost in lung cancer prediction. This research sheds light on the classifiers’ initial performance as well as areas for improvement by assessing them both with and without optimization.
To address the problem of imbalanced datasets using SMOTE. Class imbalance is a common problem in datasets involving medical diagnosis. By training the models on balanced dataset, this phase helps to minimize bias and improves the models’ capacity to generalize across various patient populations.
To fine-tune the hyperparameters of the RF, AdaBoost, and XGBoost using bayesian optimization.
Section 2 of literature survey reviews existing research to establish the relevance of the study. Section 3 methodology describes proposed methodology. Section 4 presents the key findings. Section 5 discusses the results. After that paper is concluded in Section 6 by summarizing key insights and discussing future scope.
Literature Review
In recent decades, extensive research has been conducted on using various machine learning techniques for predicting lung cancer. Various classifiers have been used by researchers to improve diagnostic accuracy. Numerous studies have analysed how different models perform on various datasets. This literature survey highlights the key findings from recent research efforts.
Radhika evaluated the performance of four traditional classifiers, including SVM, NB, LR, and DT. The study utilized datasets from the UCI Repository and found that SVM attained the highest accuracy of 99.2%, outperforming other classifiers. It highlighted the potential of SVM in handling complex data typical in medical imaging.6 Patra performed lung cancer classification using the dataset available on Kaggle. Weka tool was used to perform experiments with different classifiers. Experiments were done with KNN, NB, RF and J48 classifiers. KNN achieved 75% accuracy, NB achieved 78.12% accuracy, RBF achieved 81.25% accuracy, and J48 achieved 78.12% accuracy.7 Dritsas evaluated the performance of various classifiers, including artificial neural network (ANN), support vector machine (SVM), K-nearest neighbour (KNN), decision tree (DT), naive bayes (NB), and Rotation Forest, achieving accuracies of 94.6%, 95.4%, 95.2%, 93.7%, 95%, and 97.1%, respectively. Rotation Forest demonstrated the highest accuracy at 97.1%.8
Mamun performed lung cancer prediction using the dataset available on kaggle. Dataset was balanced using SMOTE. Experiments were done using XGBoost, AdaBoost, LightGBM and Bagging attaining accuracies of 94.42%, 90.70%, 92.55, and 89.76% respectively.9 Sachdeva performed lung cancer prediction using the dataset of 59 records available on kaggle. Performance of DT, KNN, RF, Adaboost, SVM, LR, NB and Xgboost was evaluated. NB outperformed other classifiers with 98.33% accuracy.10
Ojha performed lung cancer prediction using SVM, NB, AdaBoost, KNN, logistic regression (LR), and J48, yielding accuracies of 92.6%, 91.6%, 90.5%, 90.5%, 94.7%, and 90.5%, respectively, with LR outperforming the other models.11 Riktapresented XML-GBM model, which combined gradient boosting with explainable AI to enhance lung cancer diagnosis. Random Oversampling method was used for class balancing. Training used 65% of data and testing used 35%. Principal component analysis and hypertuning were also used to improve the accuracy. GBM obtained accuracy of 98.76%.12
Maurya evaluated the performance of twelve classifier including LR, Bernoulli NB, Gaussian NB, RF, SVM, XGBoost, KNN, AdaBoost, Extra Tree, Ensemble of XGB and AdaBoost, Voting Classifier and multilayer perceptron (MLP). KNN achieved maximum accuracy of 92.86%.13 Prakasha focused on feature extraction techniques like Gray-Level Co-occurrence Matrix (GLCM) and Principal Component Analysis (PCA) to enhance performance of classifiers. After comparing performance of NB, DT, and SVM for lung cancer classification it was found that SVM, when combined with GLCM features, achieved the highest accuracy of 96.1%. It demonstrated the importance of integrating effective feature extraction techniques with machine learning models for improved classification accuracy.14
In reviewing the existing literature, several demerits have been identified. Some studies faced challenges with class imbalance leading to biased predictions. Additionally, limited emphasis on hyperparameter optimization in models can prevent achieving optimal performance. Many studies also rely on very small datasets such as 59 records dataset of kaggle which may not generalize well. To address these gaps, the proposed work incorporated SMOTE to handle class imbalance and applied bayesian optimization for hyperparameter tuning. Authors evaluated classifiers on a larger, balanced dataset and provided a comparison of RF, AdaBoost, and XGBoost classifiers. The proposed work integrated class balancing with optimization techniques ensuring improved model performance.
Materials and Methods
Proposed methodology for lung cancer prediction is presented in Figure 1. The methodology includes following steps: data acquisition, class balancing, model implementation, hyper parameter optimization, and model evaluation.
Dataset
The dataset used in this research is acquired from Kaggle.15 It has a total of 15 predictive attributes: Age, Gender, Smoking, PeerPressure, Anxiety, Yellow Fingers, Allergy, Fatigue, Chronic Disease, Coughing, Alcohol Consuming, Wheezing, Chest Pain, Swallowing Difficulty and Shortness of Breath. Comprehensive details about the dataset are shown in Table 1. Figure 2 illustrates a two-sided bar chart displaying the distribution of features for patients with Lung Cancer and without Lung Cancer. Correlation of each predictive feature with target feature is shown in Figure 3. It helps in finding the most relevant features and improving model performance by focusing on impactful variables. It also helps domain experts to better understand which factors influence the target outcome that increase model interpretability. Initially, the dataset was imbalanced. It comprised 309 instances, with 39 instances of Class 0 (non-cancerous) and 270 instances of Class 1 (cancerous). After balancing both the classes have 270 instances. Number of instances before balancing and after balancing is shown in Figure 4.
Table 1: Comprehensive details about the dataset
| Dataset Link | https://www.kaggle.com/datasets/shuvojitdas/lung-cancer-dataset |
| Number of Records | 309 |
| Attribute Name | Description |
| Age | Age of the individual |
| Gender | Gender of the individual (e.g., Male/Female) |
| Smoking | Whether the individual smokes |
| PeerPressure | Influence of peer pressure |
| Anxiety | Presence of anxiety |
| Yellow Fingers | Observed yellow fingers (potentially due to smoking) |
|
Allergy |
Any allergies reported |
| Fatigue | Feeling of fatigue |
| Chronic Disease | Presence of any chronic disease |
| Coughing | Frequency or severity of coughing |
| Alcohol Consuming | Alcohol consumption habits |
| Wheezing | Presence of wheezing sounds |
| Chest Pain | Reported chest pain |
| Swallowing Difficulty | Difficulty in swallowing |
| Shortness of Breath | Experience of breathlessness |
Class Balancing
To resolve the class imbalance problem, SMOTE was used. SMOTE generates artficial samples in minority class by performing interpolation between existing instances.16 It works by identifying the k-nearest neighbours of each minority class instance, then creating new samples by interpolating between the original instance and its neighbours. This process generates diverse, synthetic data points that balance the dataset. It resulted in balanced dataset with equal number of 270 instances for both classes.
Classification Algorithms
Three machine learning classifiers named RF, XGBoost and AdaBoost are applied to the balanced dataset. Random Forest is an ensemble learning algorithm in which multiple decision trees are constructed and merged to produce a more robust prediction. It operates by selecting random subsets of the features and data points to construct each tree, which reduces overfitting and improves generalizability of the model. AdaBoost is a boosting ensemble method that combines multiple weak learners to create a strong model.
It works by adjusting the weights of incorrectly predicted samples, placing more emphasis on these points in subsequent iterations. Multiple models are trained and each new model tries to correct the errors made by the previous model. In XGBoost, ensemble of decision trees is constructed. Each next tree corrects the errors of the previous tree.
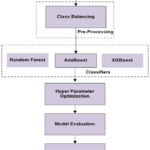 |
Figure 1: Methodology for Lung Cancer PredictionClick here to view Figure |
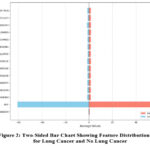 |
Figure 2: Two-Sided Bar Chart Showing Feature Distributions for Lung Cancer and No Lung CancerClick here to view Figure |
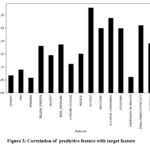 |
Figure 3: Correlation of predictive feature with target featureClick here to view Figure |
Optimization of Classifiers
The performance of the classifiers is further enhanced through hyperparameter optimization. Bayesian optimization method is utilized for optimization. This method helped in finding the optimal hyperparameters for each classifier, improving their performance.17 Bayesian optimization is computationally intensive and may not find the global optimum due to suboptimal configuration. To address this challenge, optimization settings are carefully tuned such as the choice of acquisition function and number of iterations.
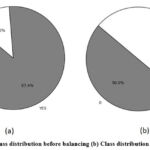 |
Figure 4: (a) Class distribution before balancing (b) Class distribution after balancing Click here to view Figure |
Model Evaluation
The classifiers’ performance is evaluated based on standard metrics accuracy, precision, recall, specificity and F1-Measure, MCC (Matthews Correlation Coefficient), Cohen’s Kappa, Log-Loss and receiver operating characteristics (ROC) curve.18,19 Validation is done using k fold cross-validation method. It involves splitting the dataset into k subsets and using each subset for testing while the remaining K-1 subsets are used for training.20
Results
Performance of RF, AdaBoost and XGBoost classifiers is evaluated without optimization and with optimization to assess the impact of hyperparameter tuning on classification accuracy. Table 2 demonstrates the performance before hyperparameter tuning illustrating how these algorithms perform initially. RF, AdaBoost and XGBoost achieved accuracies of 95.55%, 94.81%, and 94.62% respectively.
Table 2: Performance metrics of classification algorithms before hyperparameter tuning
| Classification Algorithm | Accuracy (%) | Precision (%) | Recall (%) | Specificity (%) | F-Measure (%) | MCC (%) | Cohen’s Kappa (%) | Log Loss (%) | ROC-AUC (%) |
| RF | 95.55 | 94.89 | 96.92 | 94.81 | 95.58 | 91.12 | 91.11 | 12.75 | 98.1 |
| AdaBoost | 94.81 | 93.84 | 95.91 | 93.70 | 94.87 | 89.65 | 89.62 | 61.76 | 97.8 |
| XGBoost | 94.62 | 94.46 | 94.81 | 94.44 | 94.63 | 89.25 | 89.25 | 18.33 | 99.0 |
Performance of the classifiers is improved by tuning the hyperparameters using bayesian optimization. This optimization process aimed to identify the best combination of hyperparameters that could maximize the classifiers’ performance. Table 3 shows values of hyperparameters obtained through optimization, highlighting the adjustments made to improve model performance. It also shows the performance of classifiers after optimization. Figures 5 to 9 show the enhancement in the classifier’s performance after optimization.
Table 3: Values of Hyperparameters obtained through optimization
| Classifier | Hyperparameter | Value | Accuracy (%) | Precision (%) | Recall(%) | Specificity(%) | F-Measure(%) | MCC(%) | Cohen’s Kappa (%) | Log Loss (%) | ROC-AUC(%) |
| RF | criterion | gini | 96.11 | 95.94 | 96.97 | 95.92 | 96.11 | 92.22 | 92.22 | 15.73 | 99.0 |
| bootstrap | True | ||||||||||
| max_features | 1 | ||||||||||
| random_state | 1 | ||||||||||
| min_samples_leaf | 1 | ||||||||||
| n_estimators | 10 | ||||||||||
| max_depth | 6 | ||||||||||
| XGB | learning_rate | 0.59 | 95.92 | 96.26 | 95.55 | 96.29 | 95.91 | 91.85 | 91.85 | 13.70 | 98.8 |
| max_depth | 1 | ||||||||||
| gamma | 1 | ||||||||||
| AdaBoost | learning_rate | 0.68 | 95.74 | 95.91 | 95.99 | 95.92 | 95.73 | 91.48 | 91.48 | 45.60 | 98.8 |
| n_estimators | 10 |
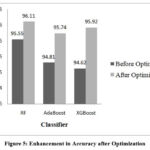 |
Figure 5: Enhancement in Accuracy after OptimizationClick here to view Figure |
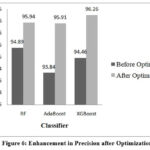 |
Figure 6: Enhancement in Precision after OptimizationClick here to view Figure |
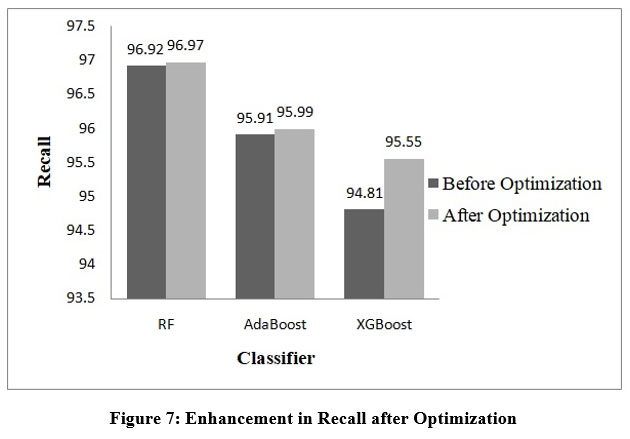 |
Figure 7: Enhancement in Recall after OptimizationClick here to view Figure |
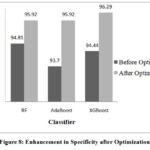 |
Figure 8: Enhancement in Specificity after OptimizationClick here to view Figure |
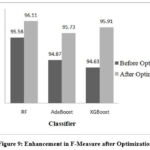 |
Figure 9: Enhancement in F-Measure after OptimizationClick here to view Figure |
Figure 10 and 11 illustrates the ROC curve of the classifier before and after the optimization process.
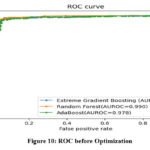 |
Figure 10: ROC before OptimizationClick here to view Figure |
Both XGBoost and AdaBoost have shown an improvement in value of area under the ROC (AUROC) after optimization. However, RF exhibits no change in its AUROC value. Confusion matrix for the three classifiers is demonstrated in Figure 13 to 15. Results indicate that RF has given the best performance with 96.11 % accuracy. Comparison of classifiers’ accuracy is shown in Figure 16.
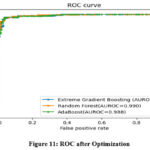 |
Figure 11: ROC after OptimizationClick here to view Figure |
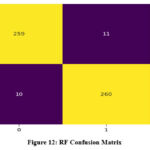 |
Figure 12: RF Confusion MatrixClick here to view Figure |
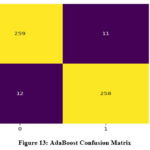 |
Figure 13: AdaBoost Confusion MatrixClick here to view Figure |
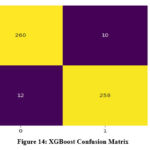 |
Figure 14: XGBoost Confusion MatrixClick here to view Figure |
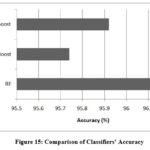 |
Figure 15: Comparison of Classifiers’ AccuracyClick here to view Figure |
AdaBoost, RF, and XGBoost are complex models and less interpretable as compared to simpler models. To resolve this problem, SHAP (Shapley Additive Explanations) tool is used. This tool helps in visualizing the contribution of each feature to the predictions of model. It helps in making the results more transparent and easier for clinicians to interpret. Figure 16 shows the SHAP value of each feature.
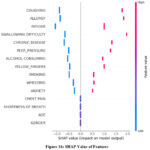 |
Figure 16: SHAP Value of FeaturesClick here to view Figure |
Discussion
Results demonstrate the effectiveness of hyperparameter optimization in boosting the classifiers’ predictive power. All three classifiers showed enhanced accuracy after optimization, AdaBoost and XGBoost benefited significantly from tuning, underscoring the importance of tailored hyperparameter adjustments for specific algorithms. RF has given the best performance with 96.11% accuracy, further increasing its reliability as a robust classification model in this study.
A detailed comparison between the proposed work and existing studies is outlined in Table 4. Comparison in graphical manner is shown in Figure 17. To make the evaluation consistent and fair, comparison is done with studies using the same dataset. This comparison highlights the competitive edge of the proposed work in terms of accuracy and robustness. Such evaluations ensure a fair and consistent benchmarking process, further validating the efficacy of the optimized model in lung cancer prediction task.
Table 4: Comparison between proposed work and existing studies
| Year | Authors | Classification Method | Accuracy |
| 2022 | Mamun10 | XGBoost | 94.82% |
| 2023 | Ojha12 | LR | 94.7% |
| 2024 | Maurya14 | KNN | 92.86% |
| 2024 | Proposed | RF | 96.11% |
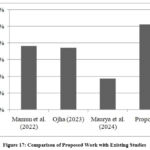 |
Figure 17: Comparison of Proposed Work with Existing StudiesClick here to view Figure |
Proposed work has certain limitations also. SMOTE method is used for balancing. This method generates synthetic samples through interpolation, which may not fully represent the complexity of real-world data. This could introduce the problem of overfitting in model when applied on new data. Dataset size is small, region-specific and derived from a particular demographic. It may limit the generalizability of findings to diverse populations. This limitation can be resolved by validating the model on large datasets in future. Another limitation of this research work is that it primarily focuses on computational performance. This limitation can be removed by validating the model on real-world clinical datasets in future to assess its performance in diverse and practical settings. Kaggle lung cancer dataset provides a degree of clinical relevance as it is derived from patient data but for full clinical validation there is a need of involving diverse datasets and real-world clinical collaboration.
Conclusion
This research work presented a method for predicting lung cancer employing machine learning algorithms. Methods of SMOTE and bayesian optimization are used to improve performance of classifiers. RF, AdaBoost and XGBoost achieved accuracies of 96.11%, 95.74%, and 95.92% respectively. RF has shown the highest accuracy. The integration of explainability technique of SHAP has enhanced model interpretability, making the predictions more transparent for clinicians. There are several possibilities of improvement in future. Dataset can be expanded to include more patient parameters. Collaboration with medical professionals in future can validate the model in real-world clinical settings. Testing the model on more diverse populations could improve its generalizability across different demographic groups. More methods of optimization can be investigated to further improve the performance. Deep leaning methods can be used on the dataset of images.
Acknowledgement
The authors would like to express their gratitude to Maharishi Markandeshwar (Deemed to be University), Mullana-Ambala, for supporting and facilitating this research work.
Funding Sources
The author(s) received no financial support for the research, authorship, and/or publication of this article.
Conflict of Interest
The author(s) do not have any conflict of interest.
Data Availability Statement
This statement does not apply to this article.
Ethics Statement
This research did not involve human participants, animal subjects, or any material that requires ethical approval.
Informed Consent Statement
This study did not involve human participants, and therefore, informed consent was not required.
Clinical Trial Registration
This research does not involve any clinical trials
Author Contributions
Conceptualization & Methodology: Rohit Lamba
Visualization & Supervision: Pooja Rani and Ravi Kumar Sachdeva:
Analysis and Writing – Original Draft: Priyanka Bathla, Karan Kumar, Kapil Joshi
Visualization & Reviewing: Vikas Mittal
All authors made a significant and equal contribution to this work.
References
- Raoof SS, Jabbar MA, Fathima SA. Lung cancer prediction using machine learning: a comprehensive approach. In: Proceedings of the 2nd International Conference on Innovative Mechanisms for Industry Applications (ICIMIA), 2020, 108-115.
CrossRef - Patil VP, Kshirsagar P, Unhelkar B, Chakrabarti P. Design and development of lung cancer prediction model for performance enhancement using boosting ensembled machine learning classifiers with shuffle-split cross validations. J Electr Syst. 2020, 20(10s), 9-28.
- Srivastava S, Dhyani N, Sharma V. Lung infection and identification using heatmap. In: Proceedings of the 2nd International Conference on Applied Artificial Intelligence and Computing (ICAAIC), 2023, 1093-1098.
CrossRef - Singla P, Kukreja V, Singh DP, Vats S, Sharma R. Enhancing diagnostic accuracy for lung disease in medical images: a transfer-learning approach. In: Proceedings of the 4th IEEE Global Conference for Advancement in Technology (GCAT), 2023, 1-5.
CrossRef - Singla P, Kukreja V, Singh DP, Vats S, Sharma R. Enhancing diagnostic accuracy for lung disease in medical images: a transfer-learning approach. In: Proceedings of the 4th IEEE Global Conference for Advancement in Technology (GCAT), 2023, 1-5.
CrossRef - Radhika PR, Nair RA, Veena G. A comparative study of lung cancer detection using machine learning algorithms. In: Proceedings of the IEEE International Conference on Electrical, Computer and Communication Technologies (ICECCT), 2019, 1-4.
CrossRef - Patra R. Prediction of lung cancer using machine learning classifier. In: Chaubey N, Parikh S, Amin K, eds. Computing Science, Communication and Security (COMS2). Communications in Computer and Information Science. 1235. Springer; 2020.
CrossRef - Dritsas E, Trigka M. Lung cancer risk prediction with machine learning models. Big Data Cogn Comput. 2022, 6(4), 139.
CrossRef - Mamun M, Farjana A, Al Mamun M, Ahammed MS. Lung cancer prediction model using ensemble learning techniques and a systematic review analysis. In: Proceedings of the IEEE World AI IoT Congress (AIIoT); 2022, 187-193.
CrossRef - Sachdeva RK, Garg T, Khaira GS, Mitrav D, Ahuja R. A systematic method for lung cancer classification. In: Proceedings of the 10th International Conference on Reliability, Infocom Technologies and Optimization (Trends and Future Directions) (ICRITO); 2022, 1-5.
CrossRef - Ojha TR. Machine learning-based classification and detection of lung cancer. J Artif Intell Capsule Netw. 2023;5(2):110-128.
CrossRef - Rikta ST, Uddin KMM, Biswas N. XML-GBM lung: an explainable machine learning-based application for the diagnosis of lung cancer. J Pathol Inform. 2023, 14:100307.
CrossRef - Maurya SP, Sisodia PS, Mishra R, Singh DP. Performance of machine learning algorithms for lung cancer prediction: a comparative approach. Sci Rep. 2024,14(1), 8562.
CrossRef - Prakasha RUM. Machine learning approach for lung cancer detection and classification–a comparative analysis. Int J Intell Syst Appl Eng. 2024, 12(3),3819-3826.
- Lung cancer dataset. Kaggle. https://www.kaggle.com/datasets/shuvojitdas/lung-cancer-dataset. Accessed 17, 2024.
- Rani P, Lamba R, Sachdeva RK, Kumar K, Iwendi C. A machine learning model for Alzheimer’s disease prediction. IET Cyber‐Phys Syst Theory Appl. 2024, 9(2), 125-134.
CrossRef - Sharma D, Kumar R, Jain A. An efficient breast cancer disease prediction method using deep learning. In: Proceedings of the 6th International Conference on Contemporary Computing and Informatics (IC3I); 2023, 1094-1097.
CrossRef - Dhiman H, Kumar R, Rani P. A hybrid model for early prediction of stroke disease. In: Proceedings of the 10th International Conference on Reliability, Infocom Technologies and Optimization (Trends and Future Directions) (ICRITO); 2022, 1-6.
CrossRef - Selvaraj J, Jayanthy AK. Automatic polyp semantic segmentation using wireless capsule endoscopy images with various convolutional neural network and optimization techniques: A comparison and performance evaluation. Biomedical Engineering: Applications, Basis and Communications. 2023, 35(06), 2350026.
CrossRef - Selvaraj J, Umapathy S., Rajesh NA. Artificial intelligence based real time colorectal cancer screening study: Polyp segmentation and classification using multi-house database. Biomedical Signal Processing and Control, 2025, 99, 106928.
CrossRef
Abbreviations
| AdaBoost | Adaptive Boosting | NSCLC | Non Small Cell Lung Cancer |
| ANN | Artificial Neural Network | PC | Pearson Correlation |
| DT | Decision Tree | RBF | Radial basis function |
| FS | Feature Selection | RF | Random Forest |
| GBM | Gradient Boosting Machine | ROC | Receiver Pperating Characteristic |
| KNN | K-Nearest Neighbour | SCLC | Small Cell Lung Cancer |
| LR | Logistic Regression | SMOTE | Synthetic Minority Oversampling Techniques |
| ML | Machine Learning | SVM | Support Vector Machine |
| MLP | Multi Layer Perception | UCI | University of California, Irvine |
| NB | Naïve Bayes | XGboost | Extreme Gradient Boosting |

